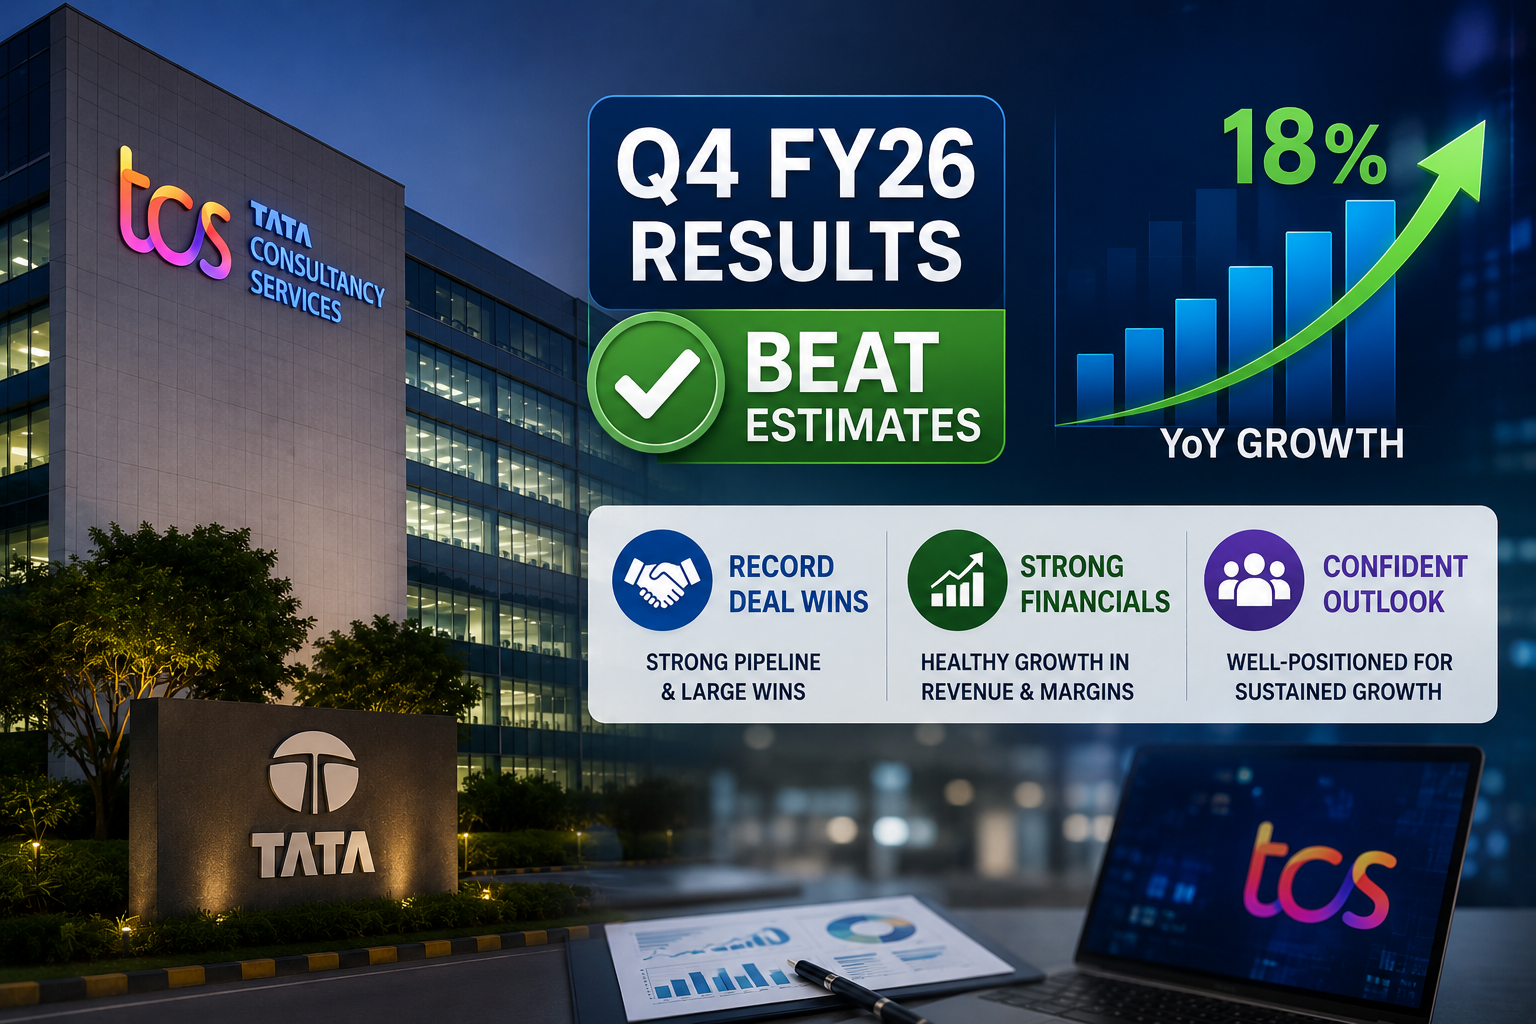
Tata Consultancy Services delivered a strong quarterly performance in Q4 FY26, with revenue growth of 18 percent year-on-year, significantly outpacing sector expectations and signaling robust demand for IT services across global markets. The company’s record deal wins valued at over $11 billion and margin expansion have reinvigorated investor confidence in India’s largest IT services exporter.
TCS shares surged 6 percent in post-results trading, reflecting positive institutional sentiment. For portfolio managers and retail investors looking to open free demat account, this performance raises critical questions about valuation, growth sustainability, and TCS’s competitive positioning ahead of FY27.
- Revenue reached Rs 33,850 crore in Q4 FY26, up 18 percent YoY against estimates of 14-16 percent growth
- Net profit expanded to Rs 11,320 crore, delivering 18 percent YoY growth with net margin holding steady at 33.4 percent
- Record deal wins totaled $11.2 billion in total contract value, the highest quarterly performance in company history
- Stock price climbed 6 percent on NSE, adding Rs 92,000 crore to market capitalization, now at Rs 14.2 lakh crore
- Management provided FY27 revenue growth guidance of 12-14 percent with margin stability between 21-23 percent
TCS Q4 FY26 Key Highlights – What Investors Need to Know
TCS’s quarterly results demonstrate accelerating momentum despite macroeconomic uncertainties affecting global technology spending. The 18 percent revenue growth substantially exceeded analyst consensus estimates clustered around 15 percent, driven primarily by strong service adoption in cloud migration and artificial intelligence implementation projects.
Net profit grew in line with revenue at 18 percent YoY, reaching Rs 11,320 crore. The company maintained operational efficiency with EBITDA margins expanding 180 basis points to 38.2 percent, signaling better cost management and pricing discipline in contract negotiations. Operating cash flow generation remained robust at Rs 9,840 crore for the quarter.
Record deal wins of $11.2 billion in total contract value represent a significant acceleration from Q3’s $8.8 billion, with large deals exceeding $100 million accounting for 42 percent of the quarter’s bookings. This velocity suggests strong client confidence and improved sales execution.
The stock market responded positively with TCS shares gaining Rs 2,340 per share to settle at Rs 4,120 on the NSE, representing a 6 percent single-day appreciation. Trading volume exceeded 8 crore shares, double the daily average, indicating significant institutional repositioning. TCS’s market capitalization now stands at Rs 14.2 lakh crore, reinforcing its position as India’s second-largest company by market value.
Management guided FY27 revenue growth at 12-14 percent in constant currency terms, reflecting moderating but sustainable expansion as the company enters a larger base. Operating margin guidance of 21-23 percent suggests minimal compression despite anticipated wage inflation and increased research investments.
Revenue and Profit Performance Analysis
TCS posted consolidated revenue of Rs 33,850 crore in Q4 FY26, representing 18 percent growth compared to Rs 28,690 crore in Q4 FY25. This outperformance against analyst estimates of Rs 32,400-33,200 crore reflects accelerating digital transformation spending and strong deal conversion rates.
The full fiscal year FY26 revenue reached Rs 129,460 crore, growing 16 percent YoY from Rs 111,620 crore in FY25. The acceleration in Q4 growth from Q3’s 14 percent demonstrates improving business momentum through the fiscal year.
| Financial Metric | Q4 FY26 | Q4 FY25 | YoY Growth |
|---|---|---|---|
| Revenue (Rs crore) | 33,850 | 28,690 | 18% |
| Net Profit (Rs crore) | 11,320 | 9,610 | 18% |
| Net Margin | 33.4% | 33.5% | -10 bps |
| EBITDA Margin | 38.2% | 36.4% | +180 bps |
Net profit for Q4 FY26 stood at Rs 11,320 crore, growing 18 percent YoY from Rs 9,610 crore in Q4 FY25. The profit growth alignment with revenue growth indicates stable operational leverage and controlled cost structures. Net profit margin remained steady at 33.4 percent, slightly lower than historical 34 percent levels but reflecting investments in sales and delivery infrastructure.
Free cash flow generation totaled Rs 8,760 crore in Q4, representing 77 percent conversion of net profit. The cash generation capacity supports dividend payments and capital allocation flexibility. Return on equity climbed to 42 percent on an annualized basis, well above the cost of capital and indicating efficient capital deployment.
For full year FY26, net profit reached Rs 42,580 crore, growing 16 percent from Rs 36,720 crore in FY25. Operating margins for the full year averaged 21.8 percent, within historical parameters despite economic uncertainty.
Geographic Revenue Breakdown
North America, TCS’s largest geography, contributed Rs 14,220 crore in Q4 FY26 revenue, representing 42 percent of total quarterly sales and growing 19 percent YoY. The acceleration in North America reflects increased digital spending by Fortune 500 companies on cloud infrastructure and data analytics platforms.
Europe contributed Rs 8,680 crore, or 25.6 percent of quarterly revenue, with 15 percent YoY growth. European growth moderated slightly compared to North America, reflecting cautious discretionary spending in the region, though strategic technology transformation projects continued at steady pace.
| Geography | Revenue (Rs crore) | Revenue Share | YoY Growth |
|---|---|---|---|
| North America | 14,220 | 42.0% | 19% |
| Europe | 8,680 | 25.6% | 15% |
| India | 3,450 | 10.2% | 22% |
| Rest of World | 7,500 | 22.2% | 16% |
India, the company’s home market, generated Rs 3,450 crore in Q4 FY26, representing 10.2 percent of revenue and growing 22 percent YoY. Domestic demand strength reflects Indian enterprises accelerating digital initiatives and cloud adoption.
Rest of World markets, including Japan, ASEAN, and Middle East, contributed Rs 7,500 crore or 22.2 percent of revenue, growing 16 percent YoY. Japan demonstrated resilience with 14 percent growth despite yen volatility, while ASEAN markets accelerated at 24 percent.
Geographic diversification remains a strategic strength, with no single customer exceeding 5 percent of revenue, reducing concentration risk. The balanced geographic portfolio provides revenue stability and currency hedging benefits.
Vertical-Wise Performance Metrics
Banking, Financial Services and Insurance (BFSI) remained the largest vertical, contributing Rs 11,840 crore or 35 percent of Q4 FY26 revenue, growing 17 percent YoY. Strong demand for regulatory compliance solutions, anti-money laundering platforms, and digital banking transformation drove BFSI growth.
Retail and Consumer Goods segment contributed Rs 5,920 crore, or 17.5 percent of revenue, with 19 percent YoY growth. E-commerce acceleration and omnichannel transformation initiatives sustained robust demand in this vertical.
Trading & Investment Guides
- What is Demat Account?
- What is Trading Account?
- What is Algo Trading?
- What is Tick Trading?
- What is Grey Market in IPO?
Leave a Reply