Top 7 Indicators for Swing Trading in 2026
Swing trading is a trading strategy where traders aim to capture short to medium term price movements over days or weeks. It requires a clear understanding of price trends, momentum, and patterns. By using the right indicators and identifying key patterns, swing traders can make informed decisions and enhance their success rate.
Let’s explore all you need to learn about swing trading indicators, including the best indicator for swing trading to generate reliable swing trading signals in the Indian stock market like Nifty 50.
Discovering the best indicator for swing trading among top technical indicators for swing trading can supercharge your strategy, especially for short-to-medium swings on stocks like Reliance or HDFC Bank.
What is Swing Trading?
Swing trading focuses on capturing price ‘swings’ in the stock market over a short to medium time frame. Unlike day trading, which involves frequent trades within a single day, swing trading holds positions for a few days to weeks. It’s ideal for swing traders who can’t monitor the market constantly but still want to benefit from price movements in stocks.

List of top 7 Indicators for Swing Trading in 2026
Indicators play a crucial role in swing trading by providing insights into share market trends, momentum, and potential reversal points. Here are some of the most effective indicators for swing trading to use in 2026:
- Moving Averages (MA): Top trend swing indicator
- Relative Strength Index (RSI): Momentum powerhouse
- MACD (Moving Average Convergence Divergence): Signal generator
- Bollinger Bands: Volatility tracker
- Fibonacci Retracement: Support/resistance levels
- Volume Indicators (e.g., On-Balance Volume): Confirmation tool
Average True Range (ATR): Risk manager
About 7 Best Indicators for Swing Trading
1. Moving Averages (MA)
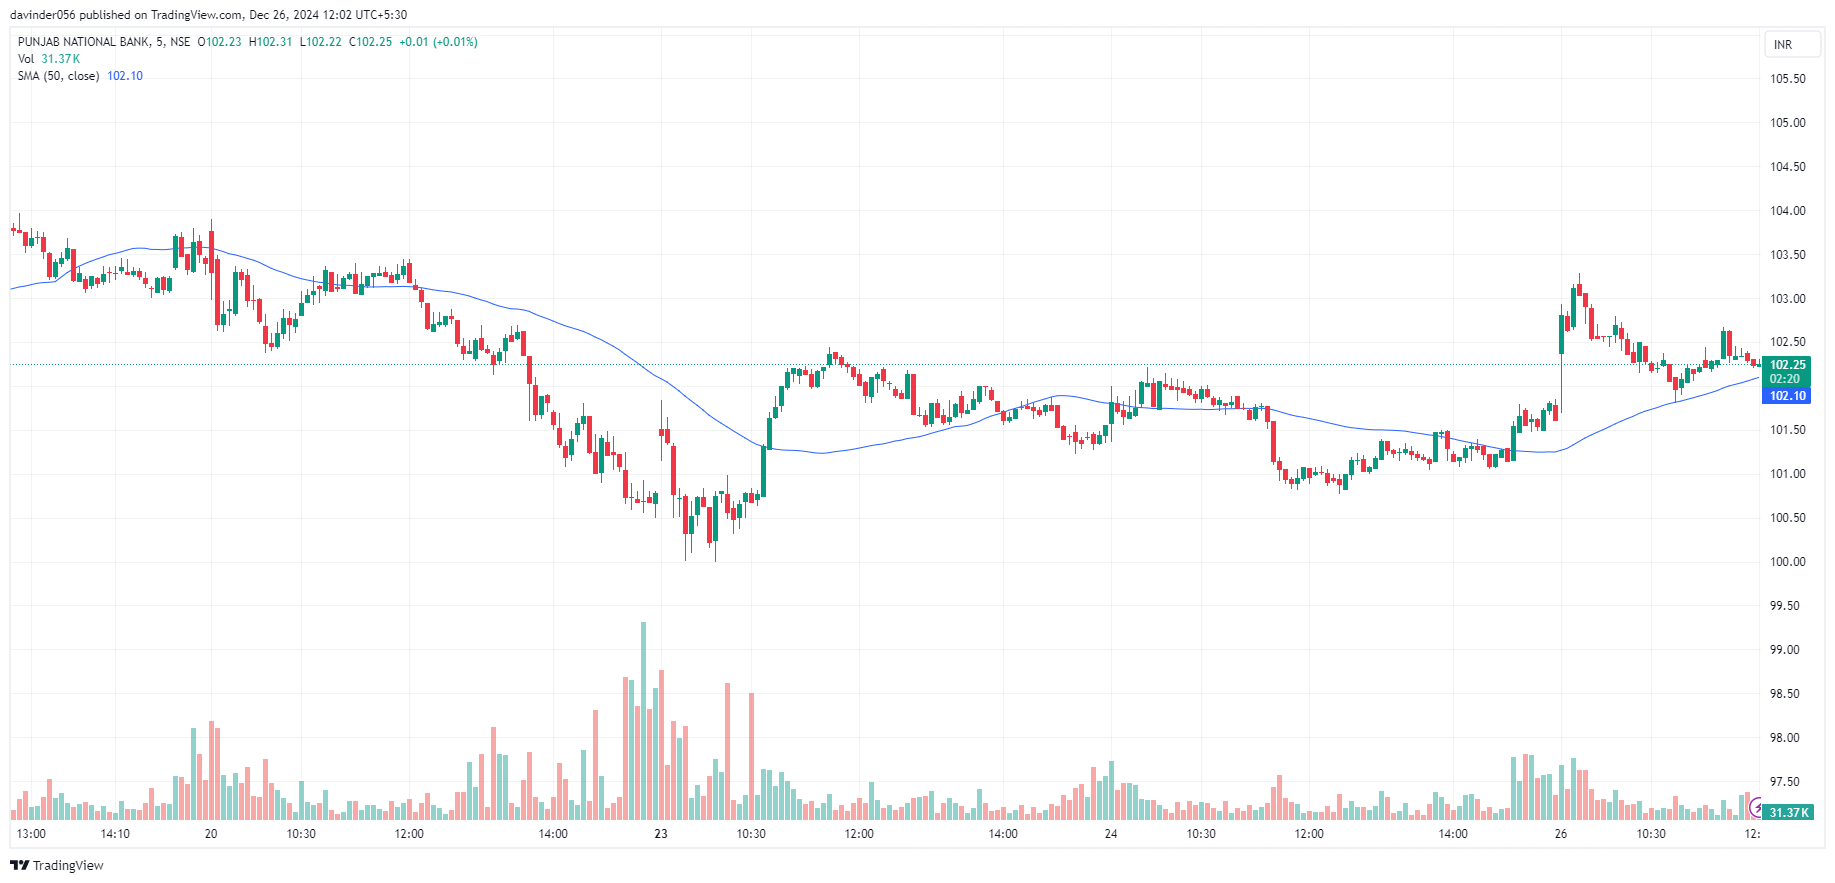
A moving average is a tool that smooths out stock price data by creating a constantly updated average price. It helps identify trends and potential reversals in the stock market. There are two common types of moving averages:
- Simple Moving Average (SMA)
- Exponential Moving Average (EMA)
SMA calculates the average of the past ‘X’ periods (e.g., 50-day or 200-day), while EMA assigns more weight to recent prices, making it more sensitive to price changes.
How to Use it?
To use the Moving Average (MA), check if the price is above (uptrend) or below (downtrend) the MA. Look for crossovers: a short MA crossing above a long MA signals a buy, and crossing below signals a sell. Use short periods for quick trends and long periods for bigger trends.
Best moving average for swing trading: 20/50 EMA crossover on Reliance Industries, buy when 20 EMA crosses above 50 EMA in uptrends (captured 12% swing in Q1 2026).
- Pros: Filters noise, clear swing trading signals.
- Cons: Lags in sideways markets.
2. Relative Strength Index (RSI)
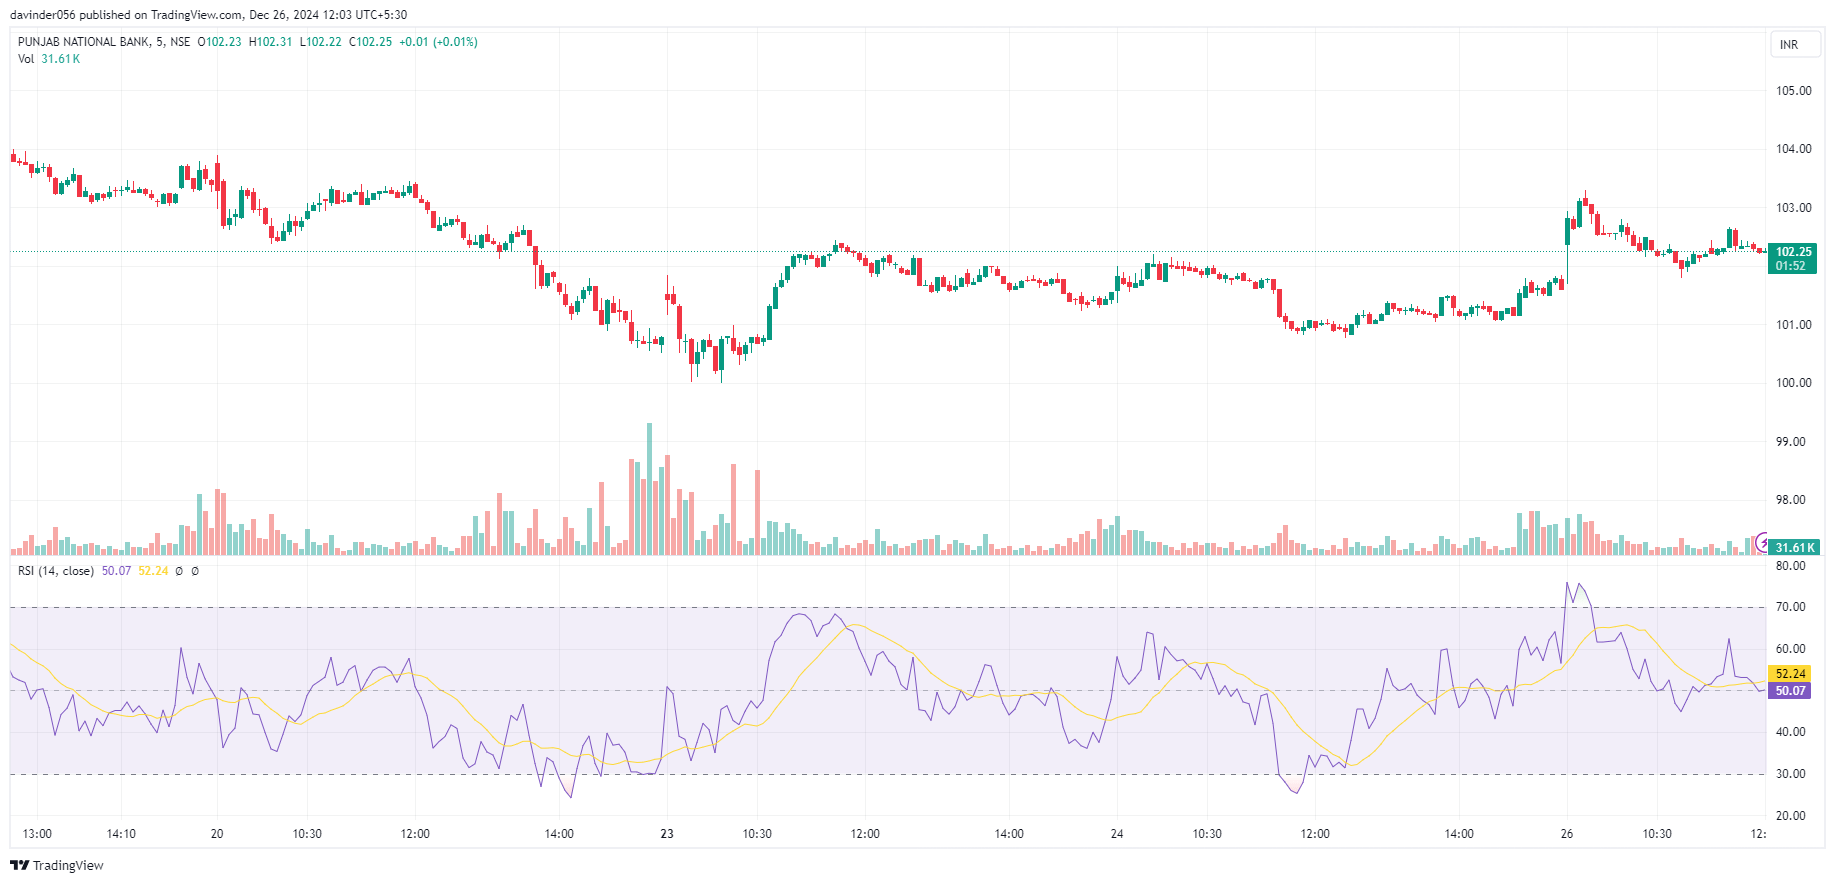
The RSI is a momentum oscillator that measures the speed and change of price movements. It ranges from 0 to 100 and helps determine whether a stock is overbought or oversold.
- Overbought: RSI above 70, meaning the stock may be overpriced.
- Oversold: RSI below 30, indicating the stock may be undervalued.
How to use:
To use the Relative Strength Index (RSI), check the value on a scale of 0-100. An RSI above 70 indicates overbought conditions (potential sell), while below 30 signals oversold conditions (potential buy). Use it with trends for confirmation.
Default: 14-period.
Example: HDFC Bank RSI <30 + uptrend = buy signal (15% gain, 2025).
Pros: Spots overbought/oversold.
Cons: False signals in trends.
3. MACD (Moving Average Convergence Divergence)
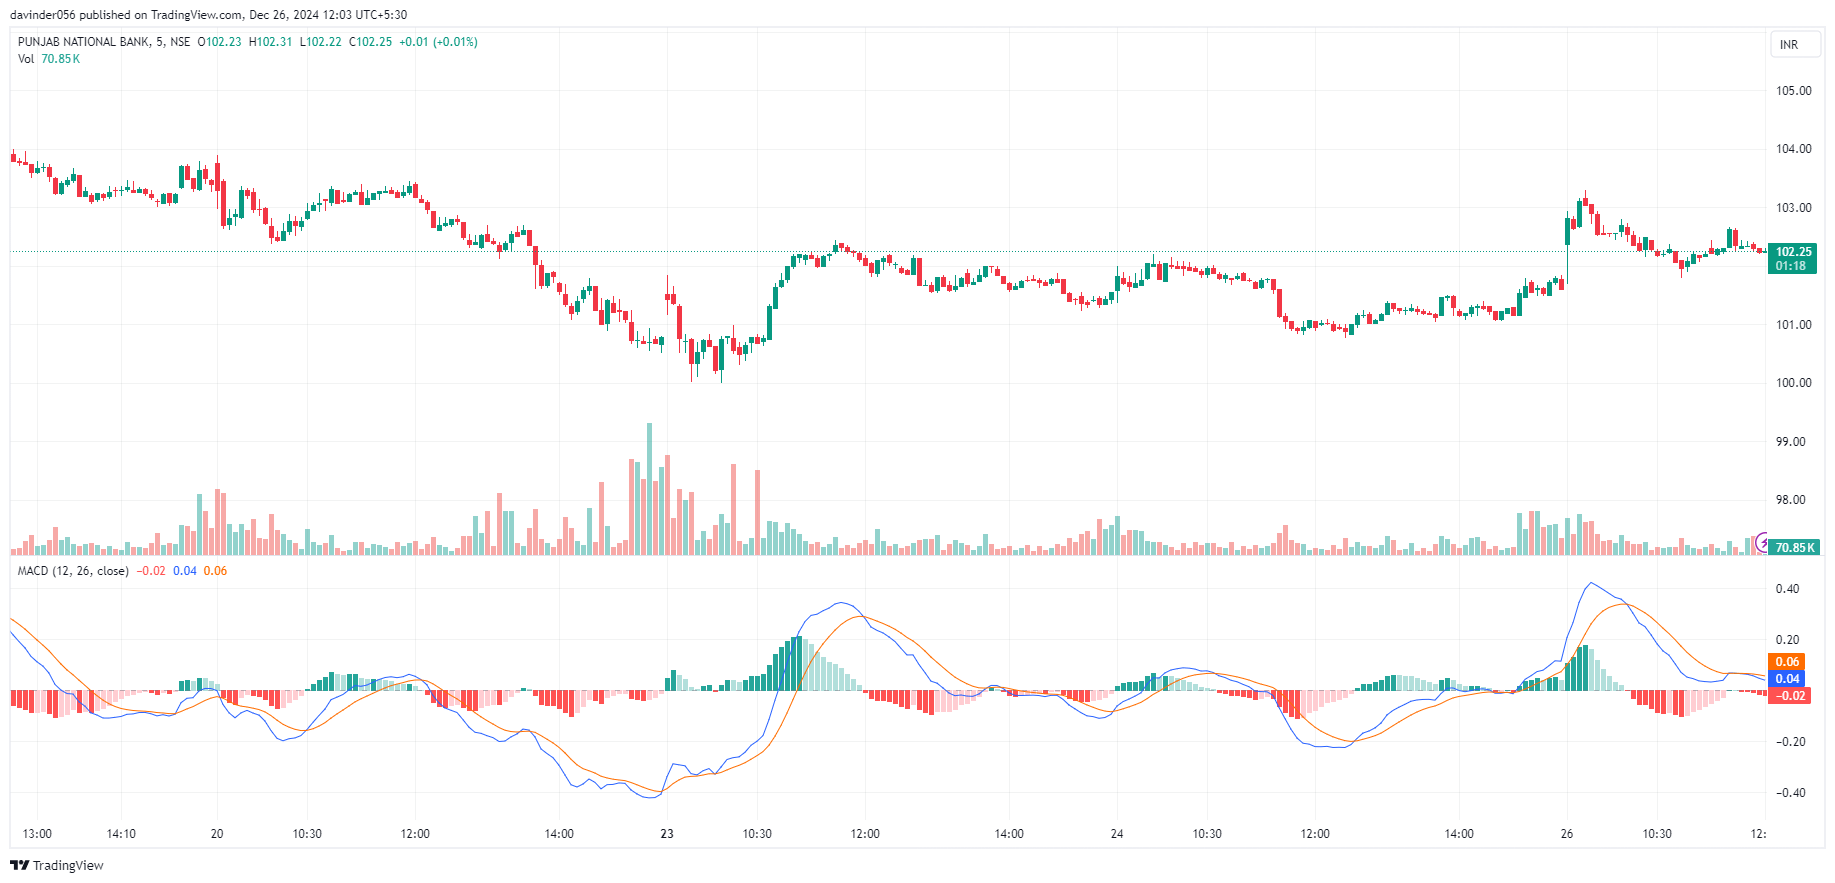
MACD is a trend-following momentum indicator that shows the relationship between two moving averages of a stock’s price. It includes:
- MACD Line: Difference between the 12-day and 26-day EMA.
- Signal Line: 9-day EMA of the MACD Line.
- Histogram: The difference between the MACD Line and the Signal Line.
How to use:
To use MACD, watch for the signal line crossover: when the MACD line crosses above, it’s a buy signal; when it crosses below, it’s a sell signal. Also, look at the histogram to gauge trend strength and momentum.
Settings: 12/26/9.
Example: TCS MACD line > signal = bullish swing trading signals.
Pros: Momentum + trend.
Cons: Whipsaws.
4. Bollinger Bands
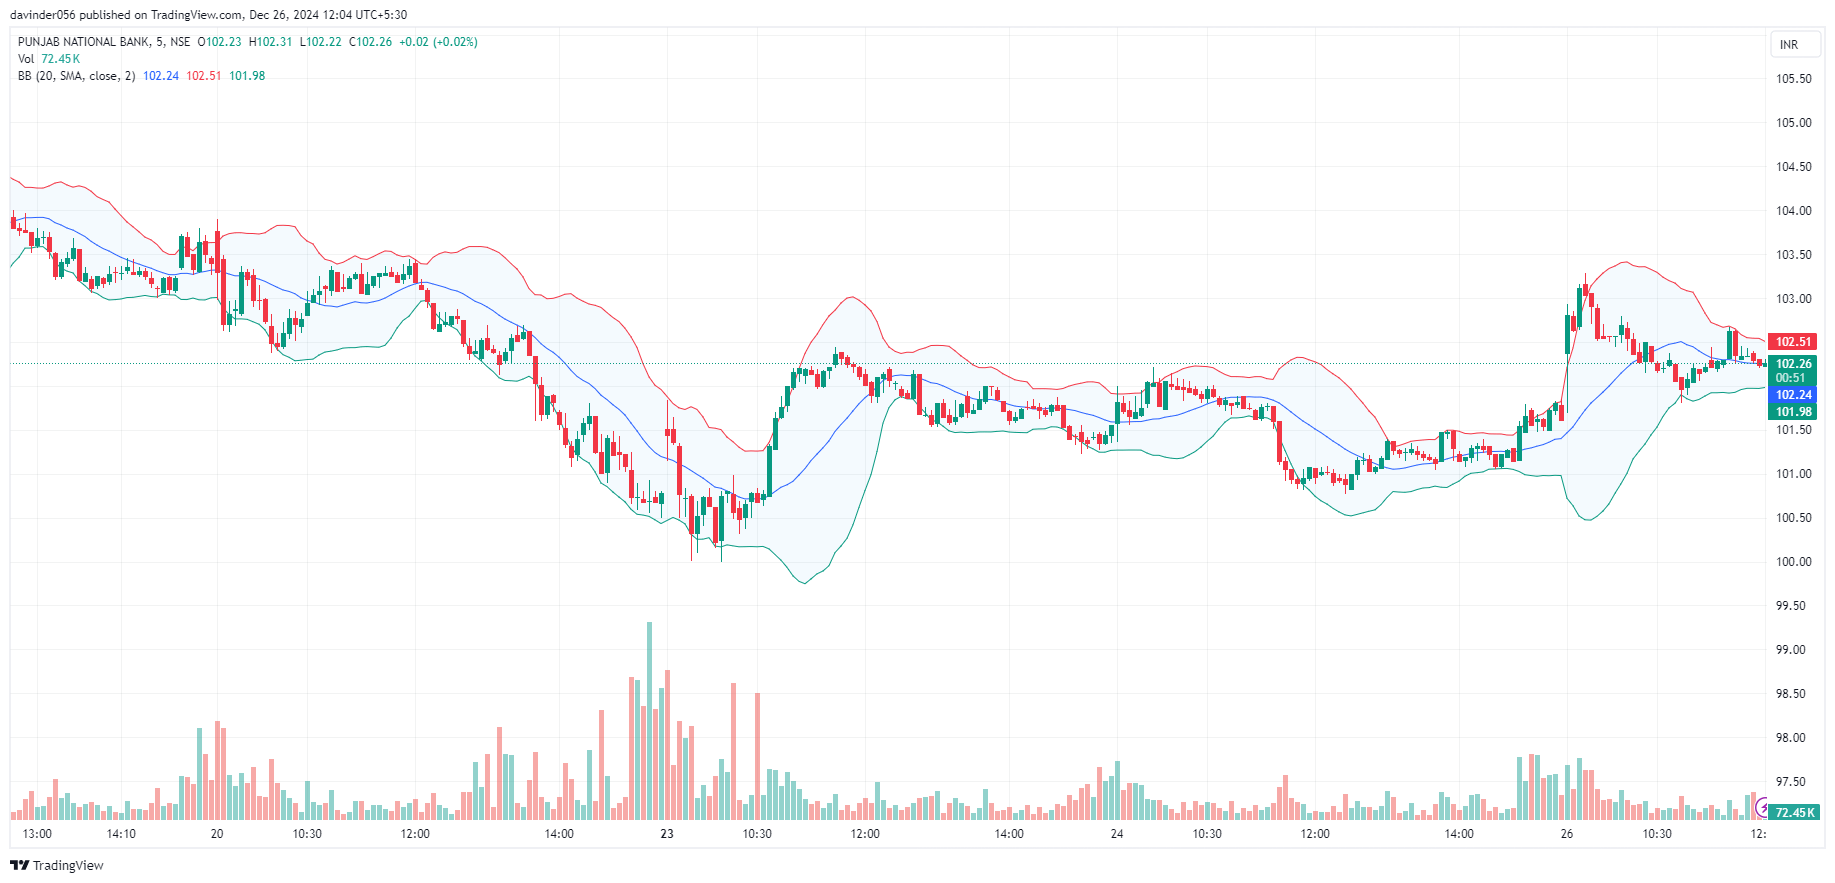
Bollinger Bands consist of three lines:
- Middle Band: A 20-period simple moving average.
- Upper Band: Middle band plus 2 standard deviations.
- Lower Band: Middle band minus 2 standard deviations.
How to use:
To use Bollinger Bands, observe the price relative to the bands. If the price touches or breaks the upper band, it signals overbought (potential sell); if it touches the lower band, it signals oversold (potential buy). Use the middle band as a trend indicator.
Settings: 20-period, 2 SD.
Example: Infosys squeeze breakout.
Pros: Volatility plays.
Cons: False breaks.
5. Fibonacci Retracement
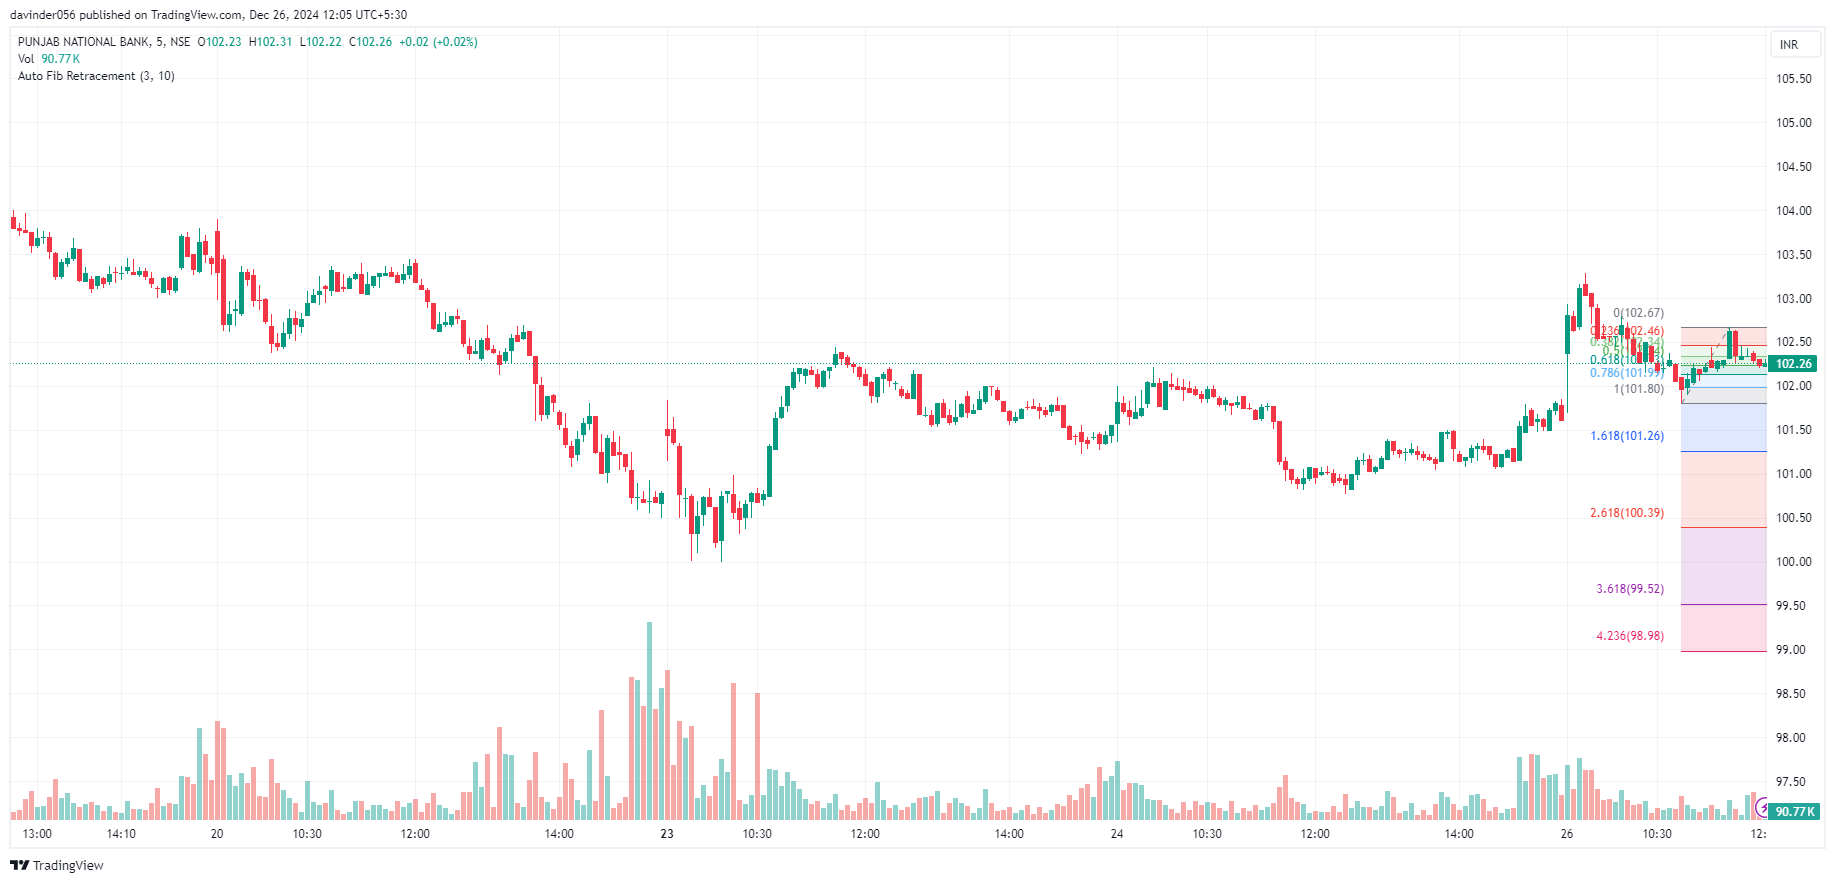
Fibonacci retracement is a tool that uses horizontal lines to indicate areas of support or resistance at key Fibonacci levels, which are based on a sequence of numbers (23.6%, 38.2%, 50%, 61.8%, and 100%).
How to use:
To use Fibonacci Retracement, identify a high and low point on a chart. Draw the retracement levels (e.g., 23.6%, 38.2%, 50%, 61.8%) between them. These levels act as potential support (buy) or resistance (sell) zones during price pullbacks.
Key levels: 38.2%/61.8%.
Example: Nifty pullback to 50% = support buy.
Pros: Precise zones.
Cons: Subjective.
6. Volume Indicators (e.g., On-Balance Volume)
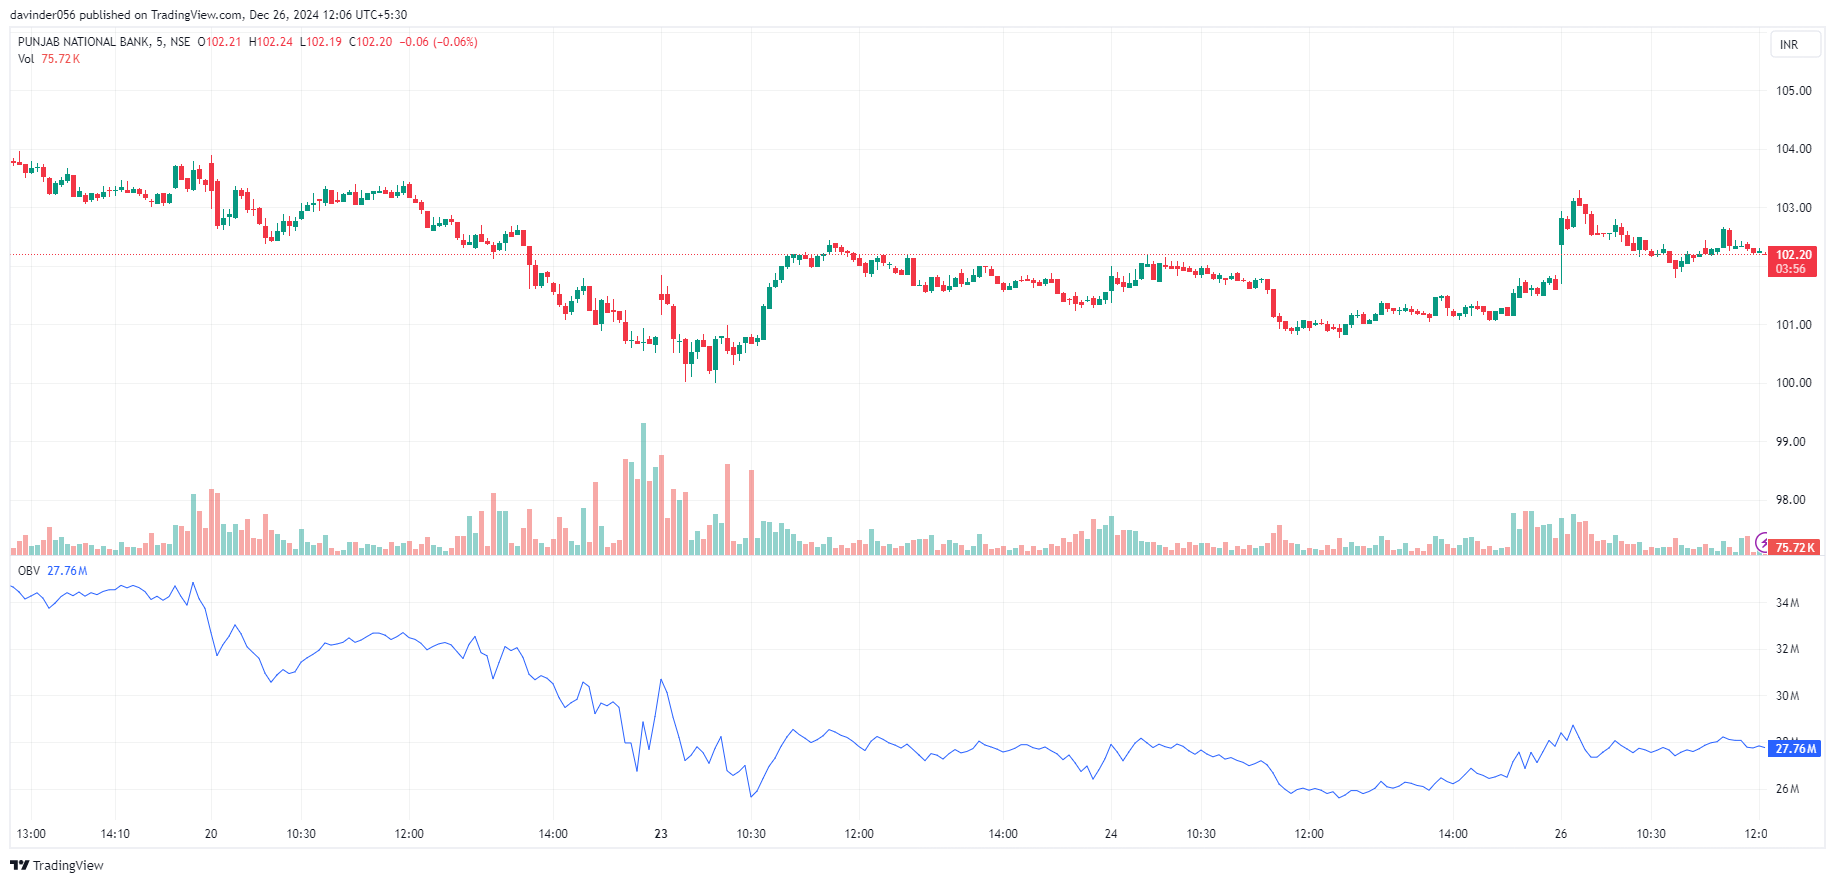
Volume indicators measure the strength of a trend based on trading volume. One example is On-Balance Volume (OBV), which adds or subtracts volume depending on whether the price closes higher or lower.
How to use:
To use Volume Indicators, like On-Balance Volume (OBV), watch for changes in volume with price movement. Rising OBV indicates increasing buying pressure (potential buy), while falling OBV signals selling pressure (potential sell). Use it to confirm trends.
Example: Rising OBV on Tata Motors breakout.
Pros: Confirms trends.
Cons: Lags volume spikes.
7. Average True Range (ATR)
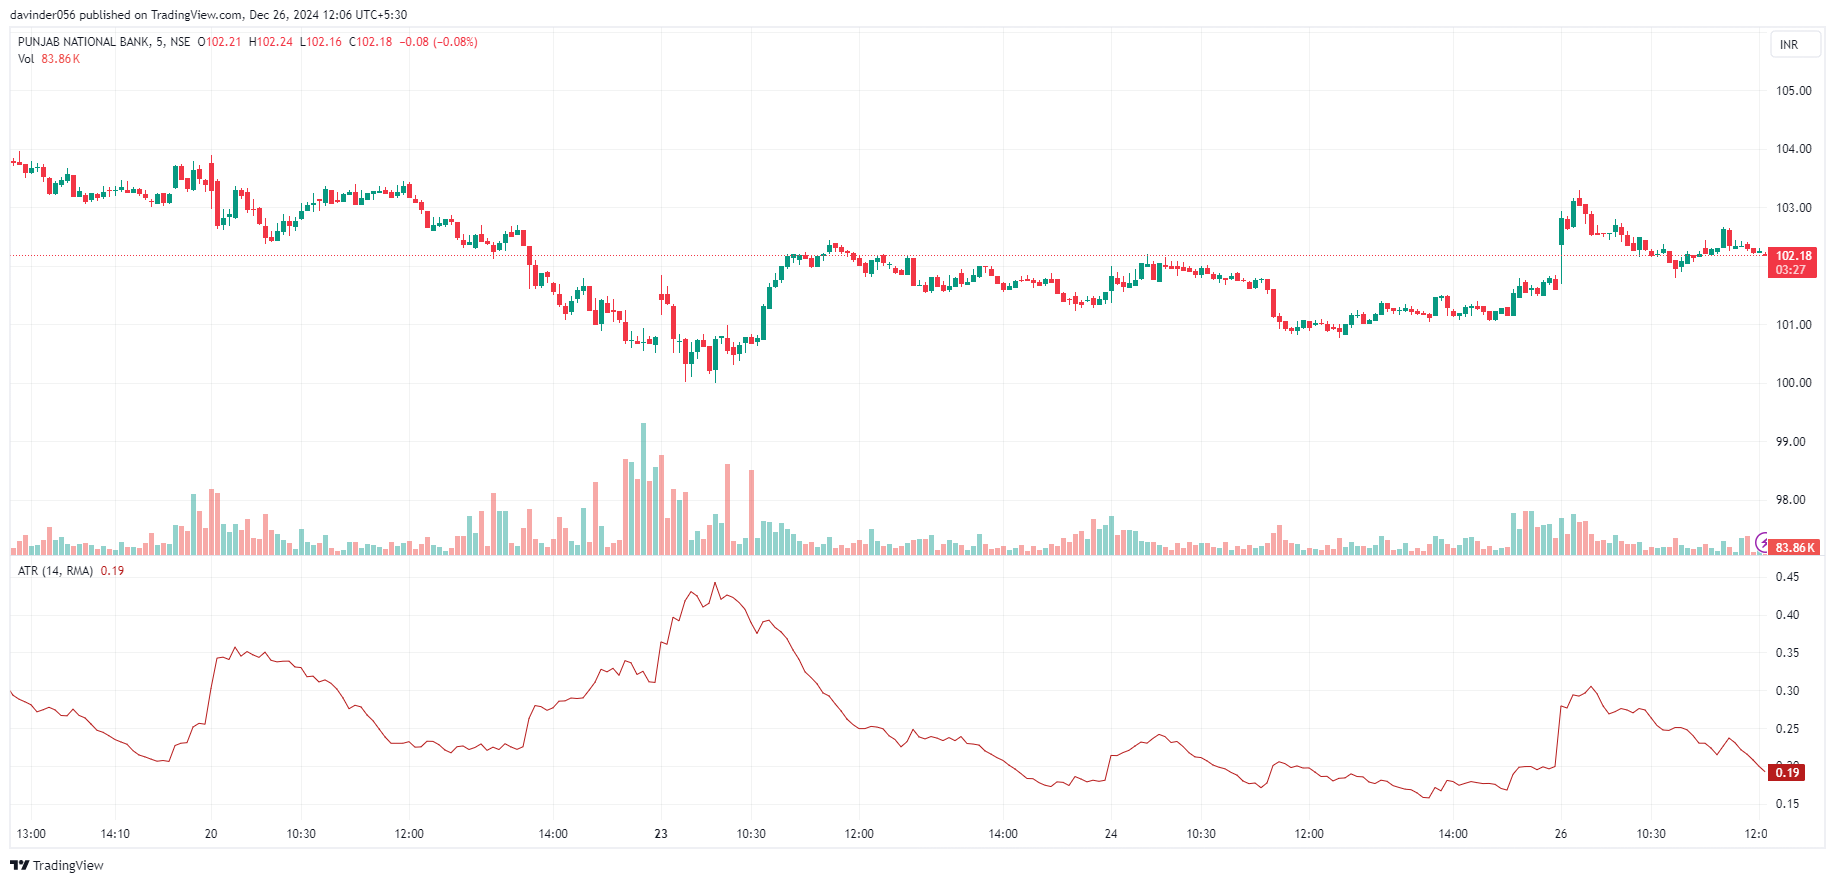
The Average True Range (ATR) is a technical indicator that measures the volatility of a stock by calculating the average price movement over a set period. It helps swing traders assess how much a stock’s price typically moves.
How to use:
You can use ATR to set stop losses and take profits based on a stock’s volatility, adjust your position size according to market conditions, and identify potential breakouts or trend changes. By using ATR, you can better manage risk and make more informed trading decisions.
Example: Set stops at 2x ATR on volatile stocks like Adani.
Pros: Risk sizing.
Cons: Not directional.
Quick Settings Table (for all 7):
| Indicator | Default | Best for Swing Trading |
|---|---|---|
| MA | 50/200 | Trends |
| RSI | 14 | Momentum |
| MACD | 12/26/9 | Signals |
| BB | 20,2SD | Volatility |
| Fib | 38.2-61.8% | S/R |
| OBV | N/A | Confirmation |
| ATR | 14 | Risk |
Automate these technical indicators for swing trading.
Related Blog: What are the prerequisites for Algorithmic trading?
Why Swing Traders Should Use These Indicators?
Swing trading indicators provide valuable insights and data that reduce guesswork by offering clear signals for entry and exit points, helping swing traders build confidence in decision-making. Here’s why these indicators are essential for swing traders before starting stock trading:
- Trend Direction: Indicators like Moving Averages (MA) reveal whether the stock is trending up, down, or sideways. It helps swing traders identify the dominant trend and avoid trading against it.
- Momentum: Tools such as the Relative Strength Index (RSI) measure the strength and speed of stock price movements. Momentum indicators help spot overbought or oversold conditions, signaling potential reversals.
- Support and Resistance Levels: Fibonacci Retracement and Pivot Points highlight key price levels where reversals or consolidations are likely to occur. It is useful for setting entry, exit, and stop-loss points.
- Volatility: Indicators like the Average True Range (ATR) and Bollinger Bands measure how much a stock’s price fluctuates. This helps swing traders adjust position sizes and risk management strategies.
- Volume Analysis: Volume indicators like On-Balance Volume (OBV) show the strength of stock price movements based on trading volume. High Volume on Breakouts confirms a strong trend. Divergence in Price and Volume signals potential reversals.
- Reversal Signals: Indicators like MACD (Moving Average Convergence Divergence) help spot potential reversal points in a stock. These signals are critical for timing entry and exit during swing trading.
- Price Consolidation Zones: Indicators like Bollinger Bands show periods of low volatility, where the stock price may consolidate before breaking out. It helps in anticipating sharp price movements.
These swing trading indicators generate powerful swing trading signals. The best indicator for swing trading? Often MA + RSI for Indian markets.
Comparison Table:
| Indicator | Strength | Weakness | Best Use |
|---|---|---|---|
| MA | Reliable trend identification | Lags price reversals | Direction – Uptrend/downtrend confirmation |
| RSI | Spots overbought/oversold extremes | False signals in strong trends | Entry timing – RSI<30 buy, >70 sell |
| MACD | Momentum + trend crossovers | Whipsaws in choppy markets | Confirmation – Signal line crossovers |
| Bollinger Bands | Volatility contraction/expansion | False breakouts | Breakouts – Band squeezes + volume |
| Fibonacci Retracement | Precise support/resistance levels | Subjective high/low selection | Pullback entries – 38.2%/61.8% bounces |
| OBV (Volume) | Confirms trend strength | Lagging volume confirmation | Trend validation – Rising OBV + price |
| ATR | Measures volatility for stops | Non-directional | Risk management – 2x ATR stop losses |
Key Chart Patterns for Effective Swing Trading
Stock Chart patterns provide visual cues for price direction, helping traders identify profitable opportunities. Time-tested and widely used by swing traders, they reflect real market psychology. Here are some of the best chart patterns for swing trading:
1. Head and Shoulders
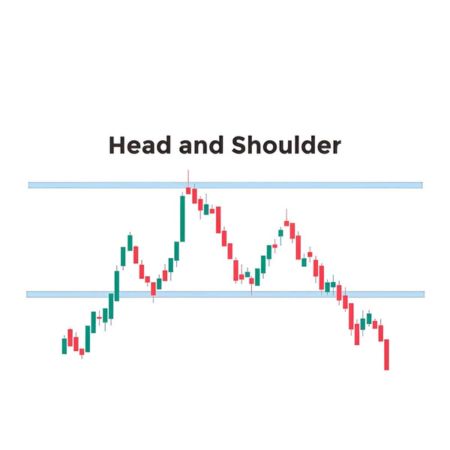
This pattern signals a potential reversal and is easy to spot on the chart.
How it works:
- The Head is the highest peak, flanked by two smaller peaks or Shoulders.
- The neckline, drawn through the lows of the pattern, acts as a support or resistance level.
- When the price breaks below the neckline (in a bearish head and shoulders), it confirms a trend reversal.
How to Use it:
- Short the stock when the neckline breaks in a downtrend.
- Invert the pattern (Inverse Head and Shoulders) for spotting bullish reversals.
Entry/Exit Rules:
- Bearish H&S: Short when price breaks neckline + OBV declining
- Inverse H&S: Buy neckline break + OBV rising
- Stop Loss: Opposite shoulder high/low
- Target: Neckline to head distance
2. Double Top and Double Bottom
These patterns suggest a reversal after a strong trend and are highly reliable.
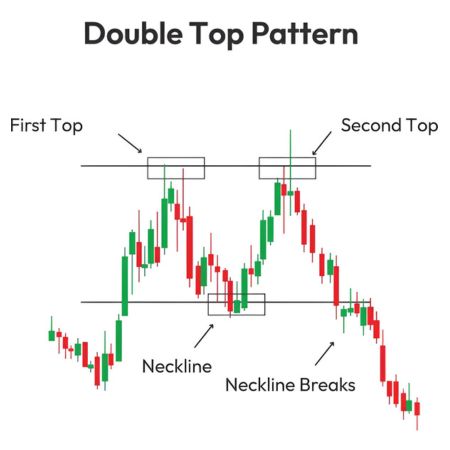
Double Top (Bearish): Price tests the resistance level twice but fails to break through, indicating a reversal to the downside.
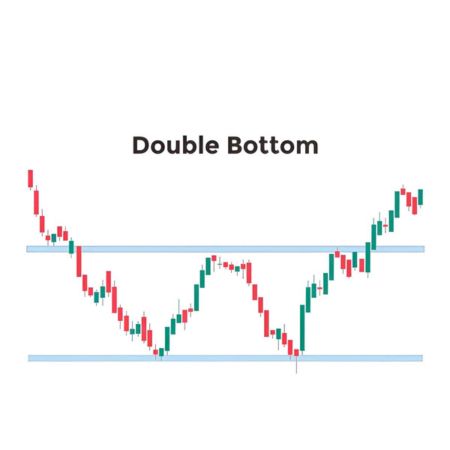
Double Bottom (Bullish): Price tests the support level twice but holds firm, signaling a reversal to the upside.
How to Use it?
- Enter trades after the confirmation of the pattern (e.g., price breaking below support in a double top or above resistance in a double bottom).
- Place stop-loss levels slightly above or below the peaks or troughs for risk management.
Entry/Exit Rules:
- Double Top (Bearish): Short below support + OBV divergence
- Double Bottom (Bullish): Buy above resistance + OBV rising
- Stop Loss: Beyond 2nd peak/trough
- Target: Pattern height projected
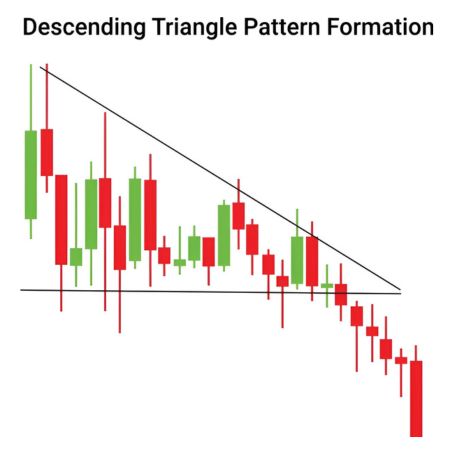
3. Ascending and Descending Triangles
Triangles indicate consolidation before a breakout, offering excellent opportunities to ride the trend.
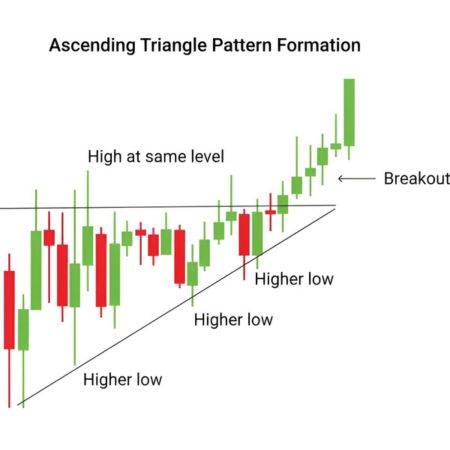
Ascending Triangle (Bullish): Price forms higher lows while resistance remains flat, signalling potential upward momentum.
Descending Triangle (Bearish): Price forms lower highs while support remains flat, hinting at downward movement.
How to Use it:
- Wait for the price to break out above or below the triangle.
- Combine with volume analysis; a high-volume breakout confirms the trend.
Entry/Exit Rules:
- Ascending Triangle: Buy upper resistance breakout + high volume
- Descending Triangle: Short lower support breakdown + volume surge
- Stop Loss: Opposite trendline
- Target: Triangle base width
4. Flags and Pennants
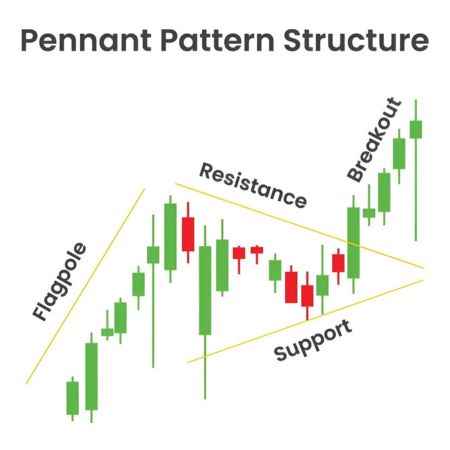
These are continuation patterns that often appear after sharp price movements.
Flags: It formed when the price consolidates in a rectangular range after a significant move. It typically slant against the prevailing trend.
Pennants: It is similar to flags but form a small symmetrical triangle. It represents short pauses before the price continues its movement.
How to Use it?
- Trade in the direction of the breakout after the consolidation phase ends.
- These patterns are ideal for swing traders looking to capitalize on strong momentum.
Entry/Exit Rules:
- Bull Flag: Buy upper flag breakout in uptrend + OBV support
- Bear Flag: Short lower flag breakdown in downtrend
- Stop Loss: Flag low/high
- Target: Flagpole length projected
Do’s and Don’ts for Swing Traders
- Combine Multiple Indicators: Relying on a single indicator can be misleading for swing traders. Combine trend-following indicators (e.g., Moving Averages) with momentum indicators (e.g., RSI) to improve accuracy. For example, use a 50-day moving average to identify the trend and RSI to spot overbought/oversold conditions.
- Test Before You Trade: Practice with demo accounts to test indicators in real market conditions. Simulate different trends to fine-tune your strategy and build confidence.
- Don’t Overcomplicate: Avoid too many indicators. Stick to 2-3 key ones that work well together, like pairing MACD with Bollinger Bands, to keep your analysis simple and focused.
- Follow Market News: Combine technical with fundamental analysis. Stay updated on stock market news and economic events that could affect your trades and validate your indicators.
- Adapt to Market Changes: Adjust your indicators based on market conditions. During volatile times, use tools like ATR or widen Bollinger Bands to manage risk better.
- Keep a Trading Journal: Track your trades, including entry/exit points and indicators used. Regularly review your journal to spot patterns and improve your strategy.
Ready to apply these best technical indicators for swing trading? Open free demat account now and start capturing swings!
Also Read: What is a Demat Account?
Best Indicator Combos for Swing Trading
- MA + RSI: Best moving average for swing trading + momentum filter.
- MACD + BB: Swing trading signals on squeezes.
Example: Nifty – MA up + RSI<30 = 10% swing.
Conclusion
Swing trading uses technical analysis, patterns, and market insights to capture price moves. By applying indicators like Moving Averages, RSI, and Fibonacci Retracement, and mastering patterns like Head and Shoulders, you can enhance your decisions and results. Keep it simple, adapt to market changes, and test your strategies. With practice, swing trading can be rewarding for swing traders at any level.
Read More Related Blogs
Frequently Asked Questions
Among the most effective indicators are Moving Averages, RSI, and MACD. Many traders use them together to confirm signals and reduce risks while making decisions.
The 1% rule involves risking only 1% of your entire trading capital per trade. It helps to protect traders from big losses and guarantee survival in the market even after having a few losing trades.
Yes, Volume Weighted Average Price (VWAP) is useful as it shows the average price of a stock based on both price and volume. Traders use it to know if the stock is trading above or below its fair value.
Yes, RSI is widely used in swing trading. It helps traders know if a stock is overbought or oversold. An RSI above 70 suggests a possible fall, while an RSI below 30 suggests a possible rise.
Swing trades are predicted by combining indicators and chart patterns. For example, moving averages show the trend, RSI shows momentum, and chart patterns show possible breakouts. Together, they improve accuracy in predictions.
Moving Averages show the trend of a stock. If the price is above the moving average, the stock is likely in an uptrend. If it is below, it may be in a downtrend. Crossovers give buy or sell signals.
Yes, using multiple indicators gives more reliable signals. For example, combining Moving Averages for trend and RSI for momentum works well. But avoid too many indicators, as it may cause confusion and delay decisions.
RSI, easy technical indicators for swing trading overbought/oversold.
RSI 14; MACD 12/26/9—daily timeframe.
MA trend, RSI entry, MACD confirm, cuts false swing trading signals.
Disclaimer: The information provided above is for educational purposes only. This article does not contain a recommendation to buy or sell any securities.