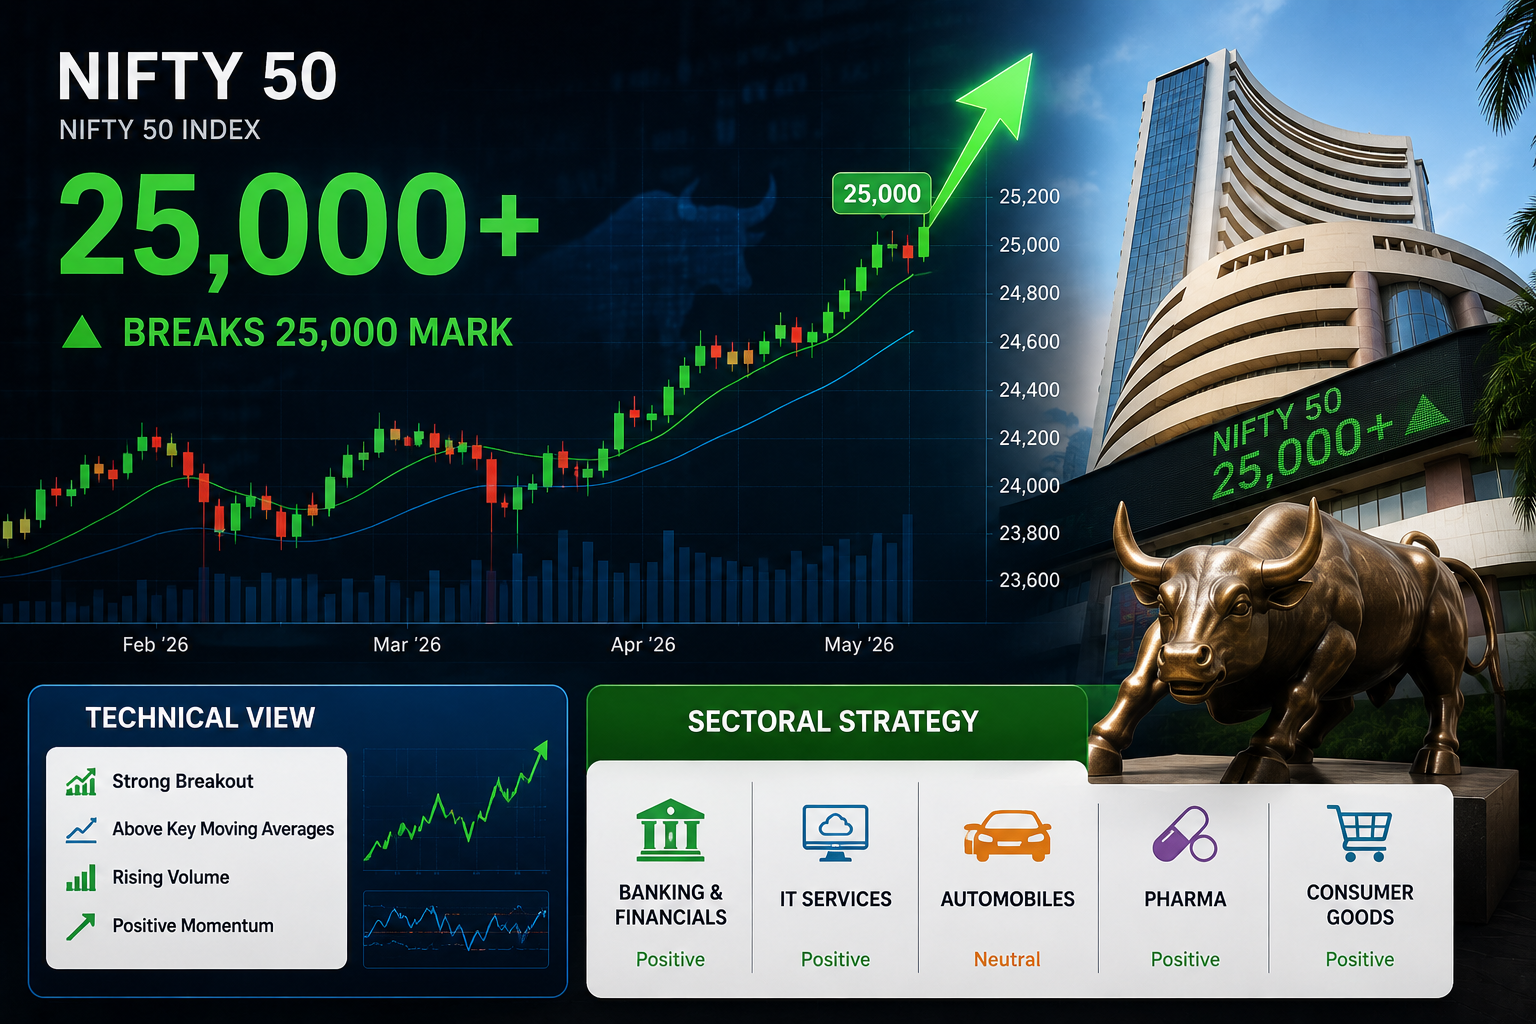
The NIFTY 50 index breached the psychologically significant 25,000 level during Thursday’s trading session, marking a substantial milestone for Indian equities. This breakthrough comes after sustained buying interest across domestic and foreign institutional investors, coupled with strong earnings momentum in key sectors.
For institutional investors and financial professionals, this juncture demands careful technical assessment to distinguish between sustainable bull run continuation and temporary euphoria. Understanding the technical architecture around these levels, sectoral contribution patterns, and institutional positioning becomes critical for informed capital allocation decisions in current market conditions.
Key Highlights
- NIFTY 50 closed at 25,085, representing a 0.65 percent daily gain on moderate volume expansion of approximately 118 million shares traded across NSE platforms
- Banking sector stocks contributed over 280 basis points to index gains, with HDFC Bank and ICICI Bank posting gains exceeding 2.4 percent on NII expansion optimism
- Foreign institutional investors recorded net purchases of approximately USD 186 million during the week, while domestic institutional investors maintained consistent accumulation across equity schemes
- IT sector demonstrated relative underperformance with only 0.3 percent gains despite rupee stability, suggesting sector-specific profit-taking after recent rallies
- Options data revealed PCR ratio at 1.08 with max pain zone around 25,200 level, indicating balanced positioning between call and put holders
Technical Analysis: Support and Resistance Levels Post 25,000
The breach of 25,000 represents completion of a consolidation pattern that formed over the preceding three weeks. Immediate resistance now establishes itself in the 25,200 to 25,300 band, where sellers historically emerged during the prior four trading sessions.
This resistance zone coincides with a 61.8 percent Fibonacci retracement level measured from the March 2024 highs and the current uptrend, suggesting technical traders have pre-positioned stop-loss orders in this region.
Critical support anchors at 24,800, approximately 200 points below current levels. This support zone aligns with the 50-day exponential moving average and represents the prior three-week consolidation base. Should volatility trigger a pullback beyond 24,800, the next structural support materializes at 24,600, corresponding to the 200-day simple moving average and several prior session lows.
Volume confirmation analysis presents a nuanced picture. While the daily breakout occurred on reasonable volume, cumulative volume for the week remains below the three-month average, suggesting that institutional accumulation proceeded selectively rather than aggressively. The relative strength index currently oscillates at 62 levels, technically neutral territory that neither confirms overbought conditions nor suggests imminent reversals.
Options Data Insights: Call Put Ratio and Max Pain Analysis
Current options positioning reveals a put-call ratio of 1.08, indicating marginally higher put open interest relative to calls. This configuration typically reflects institutional hedging rather than directional conviction, suggesting professional traders maintain protective bearish positions while maintaining long equity exposure.
Maximum pain analysis places equilibrium at the 25,200 level, precisely where substantial call open interest clusters. This technical characteristic implies that if expiration approaches with NIFTY settling near current levels, maximum losses would occur for call buyers. Consequently, this level serves simultaneously as a natural resistance point and as a zone where option writers actively defend against further appreciation through additional hedging activity.
Implied volatility metrics registered at 16.8 percent, marginally above the 90-day average of 15.2 percent. This elevation suggests that while market participants price in moderate uncertainty, the volatility environment remains remarkably calm relative to historical extremes. For options traders, this contained volatility profile limits premium collection strategies while constraining directional bets on sharp market movements.
Sectoral Performance Breakdown: Winners and Laggards
| Sector | Daily Performance | Key Drivers |
|---|---|---|
| Banking | +1.8% | NII expansion optimism, retail deposit growth |
| Automobiles | +2.1% | Strong two-wheeler, CV sales data |
| Financial Services | +1.2% | Insurance renewal premium growth |
| FMCG | +0.4% | Monsoon inventory expectations, distribution challenges |
| IT | +0.3% | Profit-taking after recent rallies |
| Pharmaceuticals | -0.8% | Generic price pressures, biosimilar competition |
Banking sector emerged as the primary rally driver, with the NIFTY Bank index appreciating 1.8 percent to touch 52,640 levels. Net interest income expectations for FY27 remain robust given the inverted yield curve persists and retail deposit mobilization accelerates. The sector’s current forward price-to-earnings multiple at 14.2x compares favorably against the broader NIFTY 50 valuation of 22.1x, suggesting relative attractiveness within this institutional portfolio.
Financial services stocks excluding banks contributed meaningfully as insurance sector indices gained 1.2 percent on renewal premium buoyancy and improved persistency ratios. FMCG sector demonstrated cautious resilience with only 0.4 percent appreciation despite monsoon-related inventory expectations, indicating distribution challenges persist for large-cap consumption plays.
Banking Stocks Drive the Rally: HDFC Bank, ICICI Bank Lead Gains
HDFC Bank appreciated 2.6 percent to reach fresh 52-week highs following positive commentary on credit growth trajectory and deposit accretion velocity. Analysts monitoring the banking sector estimate that net interest margins for HDFC Bank will stabilize at 4.1 percent levels given the current rate environment, supporting RoA expectations exceeding 1.8 percent by FY27.
ICICI Bank demonstrated comparable strength with 2.4 percent daily appreciation as asset quality metrics continued normalizing with GNPA ratios declining 15 basis points sequentially. Retail participation in financial markets has accelerated through digital channels, with young investors increasingly utilizing leading platforms to construct diversified portfolios.
Those seeking entry points into banking sector exposure may open demat account online through regulated brokers offering integrated trading and wealth management solutions, enabling systematic equity accumulation through SIP methodologies.
For active traders seeking leverage-based strategies or intraday positioning, the best stock trading and investing platform in India should provide real-time execution, advanced charting tools, and integrated options analytics. Banking sector volatility profiles support tactical positioning around earnings announcements and RBI policy calendars.
Foreign and Domestic Institutional Flows: Money Trail Analysis
Foreign institutional investor participation deserves careful attention as inflow sustainability remains critical for index appreciation sustainability. Current week net purchases of USD 186 million followed four consecutive weeks of modest accumulation, contrasting sharply with the USD 2.1 billion outflows witnessed during March’s geopolitical uncertainty period.
This resumption of FII buying reflects renewed confidence in domestic growth narratives and relative valuation advantage versus developed market alternatives.
Domestic institutional investors maintained consistent accumulation with insurance companies and mutual funds collectively purchasing approximately INR 1,890 crore in net terms. This DII activity provides meaningful ballast against potential volatility, as domestic flows typically persist longer than foreign flows during market corrections.
Year-to-date FII inflows to Indian equities reach approximately USD 8.4 billion, placing current year flows approximately 12 percent above corresponding 2025 period, suggesting improving foreign investor appetite for Indian exposures.
However, retail investor participation metrics warrant scrutiny. While demat account openings continue accelerating, incremental equity purchases by retail investors have moderated relative to mutual fund SIP flows, indicating that indirect participation through systematic plans exceeds direct market purchases.
Market Valuation Metrics: Is NIFTY Overvalued at 25,000?
NIFTY 50 forward price-to-earnings multiple currently resides at 22.1x, approximately 18 percent above the five-year historical average of 18.7x. However, this elevation reflects genuine earnings growth acceleration rather than pure multiple expansion.
RBI monetary policy accommodative stance combined with moderating goods inflation creates conditions supporting above-trend earnings growth for FY27, potentially justifying modest valuation premiums relative to historical averages.
Price-to-book multiples for NIFTY 50 constituents average 3.2x, marginally above the ten-year median of 3.0x, suggesting equity valuations remain within defensible parameters rather than extreme compression or expansion territories. Earnings revisions trajectory deserves particular attention, as consensus estimates for FY27 total earnings growth remain at 14-16 percent levels despite volatile macroeconomic environments globally.
Comparative valuation against Asian emerging markets reveals Indian equities trading at modest premiums to Korean and Taiwanese markets on earnings basis, reflecting investor recognition of domestic growth advantages and lower geopolitical risk profiles. However, valuations remain substantially below Japanese market multiples, suggesting capital allocation toward India reflects relative rather than absolute attractiveness.
Trading & Investment Guides
Leave a Reply