findocblog

Blog

  • India’s Economy at Crossroads: 7.8% Growth Masks Structural

    India’s Economy at Crossroads: 7.8% Growth Masks Structural

    India’s economy continues to demonstrate headline resilience with a robust 7.8% GDP growth in the first quarter of fiscal year 2025-26, positioning the nation as a top performer among emerging markets. However, beneath these impressive growth figures lies a complex economic landscape marked by rising inflation pressures, weakening private consumption, and mounting external vulnerabilities. As the Reserve Bank of India navigates an increasingly challenging policy environment amid geopolitical tensions and trade uncertainties, institutional investors face critical decisions about India’s medium-term growth trajectory and market positioning.

    Key Highlights

    • Q1 FY26 GDP growth reached 7.8%, a five-quarter high, though heavily dependent on public spending rather than private sector dynamism
    • Headline CPI inflation surged to a 10-month high of 3.2% to 3.35% in February, driven primarily by food and beverage price increases
    • Private Final Consumption Expenditure decelerated to 7% from 8.3% year-on-year, signaling widespread household financial stress
    • Foreign exchange reserves declined by over $11 billion in early March 2026 due to RBI intervention to support the rupee against mounting pressures
    • Labour Force Participation Rate remains critically low at 54.2%, with female participation languishing at just 30.2%, indicating jobless growth concerns

    Growth Driven by Public Spending, Not Private Demand

    India’s 7.8% quarterly growth represents the strongest performance in five quarters, yet the composition of this expansion raises significant concerns for long-term sustainability. The growth engine is predominantly fueled by government investment and infrastructure capital expenditure rather than organic private sector expansion. This state-funded expansion masks a fundamental weakness in the economy’s foundation: private consumption, which accounts for nearly 60% of GDP, has decelerated sharply to 7% from 8.3% year-on-year.

    The deterioration in private consumption reflects deeper household distress across the economy. Financial savings as a share of GDP have plummeted to 5.1%, the lowest level in over a decade, indicating that families are drawing down accumulated savings to maintain consumption levels. This trend is particularly alarming when coupled with stagnant or declining real wages for both informal and formal sector workers, even as corporate profits have soared. The resulting K-shaped recovery, where a small segment of the population thrives while the majority struggles, creates a dangerous disconnect between headline growth figures and ground-level economic reality.

    The International Monetary Fund projects full-year FY26 GDP growth at 7.3%, expected to moderate to 6.4% in subsequent years, while the World Bank forecasts 6.7% growth for the next fiscal year. These projections, though respectable by global standards, depend critically on sustained public spending and favorable external conditions that appear increasingly uncertain. Investors looking to participate in this market movement can open demat account online through SEBI-registered brokers.

    Inflation Pressures Mount Amid Geopolitical Tensions

    The benign inflation environment that characterized much of 2025 has decisively ended. Headline CPI inflation rose to 3.2% to 3.35% in February, marking a 10-month high and signaling the return of price pressures across the economy. The primary culprit has been food and beverage inflation, with notable price spikes in meat, oils, fruits, nuts, and particularly tomatoes. Additionally, precious metals including gold and silver have contributed to the inflationary surge.

    The disappearance of favorable base effects that previously kept inflation subdued means future price pressures will depend on supply-side dynamics and external shocks. The Middle East conflict has already pushed Brent crude oil prices sharply higher between February and March 2026, directly impacting India’s import costs. Given that India imports 85% of its crude oil, this geopolitical vulnerability poses a significant risk to both the inflation trajectory and the current account deficit.

    Climate-related disruptions, particularly El Niño effects, and ongoing global supply chain disruptions affecting fertilizer production present additional near-term inflationary risks. The Reserve Bank of India faces mounting pressure to balance inflation control against the need to support fragile growth. Bank liquidity has tightened recently, creating a record-high gap between loans and deposits, which prompted RBI interventions. Any interest rate cuts will depend on inflation steadily decreasing, a condition that appears increasingly difficult to achieve given external commodity price pressures.

    Rupee Under Pressure, Forex Reserves Declining

    The Indian rupee has come under significant pressure in recent weeks, forcing the Reserve Bank to intervene aggressively to defend the currency. Foreign exchange reserves declined by over $11 billion in early March 2026 alone, reflecting the intensity of RBI support measures. This vulnerability stems from India’s structural dependence on commodity imports and the current geopolitical environment that has disrupted global energy markets.

    The rupee’s weakness creates a policy trilemma for the RBI: the central bank must simultaneously defend the currency, control inflation, and support fragile growth, with any decision carrying significant trade-offs. The ongoing U.S. trade investigations pose additional risks to key export sectors, particularly those utilizing Chinese components, which could lead to higher compliance costs and trade barriers. Retail participation has grown significantly as access to a reliable trading platform has become more widespread. Analysts estimate that new U.S. tariffs could create a potential GDP drag of 60-80 basis points, representing an estimated $15 billion to $10 billion net export loss.

    Labour Market Weakness Threatens Demographic Dividend

    Perhaps the most concerning structural challenge facing India’s economy is the severe weakness in the labour market. The Labour Force Participation Rate stands at an alarmingly low 54.2%, with female participation at just 30.2%. Youth unemployment exceeds 45%, particularly among educated youth in urban areas, indicating a critical jobless growth trend that jeopardizes India’s demographic dividend.

    This labour market dysfunction directly correlates with the weakness in private consumption and household financial stress. A large portion of the working-age population has effectively detached from the workforce, suggesting that headline growth figures do not translate into broad-based employment creation or income generation for the majority of Indians. The combination of low LFPR and declining real wages creates a vicious cycle where household purchasing power deteriorates even as GDP grows.

    Market Outlook

    Despite these structural challenges, international financial institutions maintain a cautiously optimistic outlook for India’s equity markets. Jefferies forecasts that India’s stock markets will outperform other emerging markets in 2026, setting a target of 28,300 for the Nifty 50 index. Goldman Sachs Asset Management identifies India as a top investment choice for 2026, citing strong GDP growth, steady earnings, and a young population as key attractions. Moody’s expects India to continue leading growth in the Asia-Pacific region and emerging markets through 2026, predicting 7% growth for 2025 and 6.4% for 2026.

    Analysts believe current market valuations have become more attractive following recent market dips, supported by domestic demand and structural improvements in the economy. However, investors must carefully weigh these positive assessments against the mounting risks: inflation pressures, rupee weakness, labour market dysfunction, and the potential impact of U.S. trade investigations. This development presents new considerations for stock investment strategies focused on Indian equities. The Reserve Bank is expected to maintain a cautious monetary policy stance, closely monitoring inflation and liquidity conditions.

    Conclusion

    India’s economy stands at a critical inflection point. The 7.8% quarterly growth provides a window of opportunity, but it cannot be mistaken for a structural transformation. Public spending has propped up the economy, but it cannot serve as a long-term substitute for broad-based private demand and investment. For institutional investors, the key question is whether policymakers can address the deep-seated cracks in the foundation: boosting household incomes, creating meaningful employment for youth, and implementing reforms that foster genuine private sector dynamism. Without these fundamental changes, current growth risks being a fleeting headline rather than a lasting reality. Market participants should monitor RBI policy decisions, inflation trends, and labour market indicators closely as these will ultimately determine whether India can sustain its growth trajectory or faces a more significant slowdown ahead.

  • Indian IT Sector Faces Headwinds Amid Valuation Cuts

    Indian IT Sector Faces Headwinds Amid Valuation Cuts

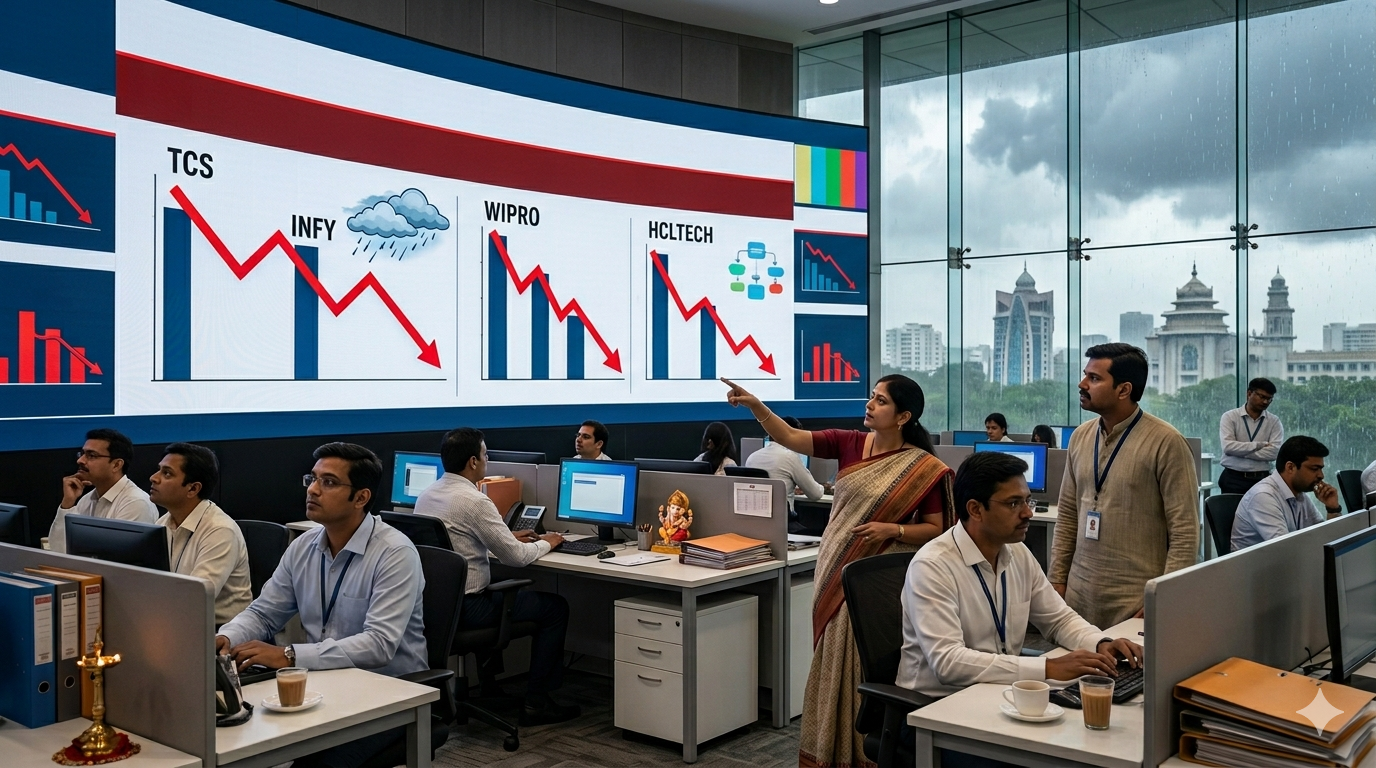
    The Indian IT sector, a cornerstone of the NIFTY 50 and BSE Sensex, grappled with mixed signals in the past 24 hours as brokerage UBS slashed target prices for major players like Infosys, TCS, Wipro, and HCL Technologies, citing soft Q4 revenue growth and margin pressures. While TCS announced a board meeting for April 9, 2026, to approve FY26 financial results and final dividend, stocks showed divergent performance: HCL Technologies gained 1.87% to close at 1,358.60, Infosys edged up 0.07% to 1,256.80, but TCS slipped 0.28% to 2,383.80. Amid easing geopolitical fears, the sector’s one-year returns remain deeply negative, with TCS down 33.10%, underscoring broader challenges from global slowdowns and AI-driven disruptions. Indian investors on NSE and BSE are watching closely as the INR holds steady against a volatile USD.

    Key Highlights

    • TCS board meeting scheduled for April 9, 2026, to approve FY26 standalone and consolidated results under Ind AS, alongside final dividend recommendation.
    • UBS cuts target prices: Infosys to 2,100 from 1,450 (Buy), TCS to 4,250 from 4,650 (Neutral), HCL Tech to 2,030 from 1,350 (Neutral), Wipro to 315 from 430 (Sell).
    • HCL Technologies outperforms with 1.87% gain to 1,358.60; one-week return at 2.6%, trading below key support but showing momentum.
    • Indian IT sector projected at $315 billion revenue for FY26, driven by AI and digital transformation deals, though global economic slowdowns loom.
    • TCS stock one-year return -33.10%, five-year -23.83%; peers like Infosys and Wipro face deal ramp-downs and margin declines.

    IT Stocks Navigate Valuation Pressures

    UBS’s latest report highlights a cautious short-term outlook for large-cap Indian IT firms, projecting soft revenue growth in the fourth quarter of FY26. Sequential declines are anticipated for Infosys and Wipro due to deal ramp-downs at TCS, HCL Technologies, and Infosys, compounded by client spending uncertainty. Profitability presents a mixed picture: TCS and Tech Mahindra may see marginal margin improvements, while Infosys, Wipro, and HCL Technologies face modest declines. This recalibration led to lowered target prices across the board, yet the brokerage views the recent market correction as overdone, with stocks trading at attractive discounts offering more upside potential.

    Market reaction was positive, with shares of major IT companies advancing post-report. L&T Technology Services, Coforge, and Mphasis gained nearly 3%, while TCS, Persistent Systems, HCL Technologies, and Infosys rose 2-3%. HCL Technologies stood out, closing at 1,358.60 with a 1.87% increase, bolstered by a one-week return of 2.6%. Despite trading below key support levels, this momentum signals resilience amid sector-wide pressures. Investors looking to participate in this market movement can open demat account through SEBI-registered brokers. TCS, meanwhile, reported a one-day decline of 0.28% and steeper losses over longer horizons: -11.26% monthly, -24.78% over six months, and -33.10% annually.

    The NIFTY IT index mirrored these dynamics, easing geopolitical fears from Middle East tensions that had spurred foreign investor outflows in March 2026. Elevated crude prices continue to threaten India’s trade balance and INR stability, indirectly pressuring IT earnings through higher input costs and currency volatility.

    Company-Specific Developments and Market Data

    TCS remains in focus with its upcoming board meeting on April 9, 2026, set to deliberate FY26 audited standalone and consolidated financial results under Indian Accounting Standards (Ind AS), plus a final dividend recommendation for approval at the 31st Annual General Meeting. The company’s stock, at 2,383.80 after a 6.80-point drop, reflects one-year returns of -33.10% and five-year returns of -23.83%, underscoring prolonged underperformance amid competitive AI shifts.

    HCL Technologies demonstrated relative strength, advancing 1.87% to 1,358.60, with a market cap reflecting its $40.2 billion valuation and P/E of 24.1. Infosys, valued at $68.5 billion with a P/E of 25.2, saw minimal movement at +0.07% to 1,256.80 but holds a Buy rating from UBS despite target cuts. Wipro, with a P/E of 15.1x and market cap implying attractive valuation, launched an Innovation Lab in Seoul targeting technology, automotive, and industrial clients. This move aligns with peers’ global expansion, though immediate market impact remains limited.

    Tech Mahindra, at a P/E of 25.1x and ₹1.35 trillion market cap, partnered with East African steel firm Roofings Group for an AI-driven e-commerce platform, emphasizing data analytics for procurement. UBS maintains a Sell rating but raised its target to 1,470 from 1,000. This development presents new considerations for stock investment strategies focused on Indian equities, particularly as the sector’s FY26 revenue projection of $315 billion hinges on AI-enabled services, yet global slowdowns pose risks to deal conversions on BSE and NSE.

    Peer Comparison and UBS Ratings

    Company New Rating New Target Price (₹) Market Cap One-Year Return P/E Ratio
    Infosys Buy 2,100 $68.5B N/A 25.2
    TCS Neutral 4,250 N/A -33.10% N/A
    HCL Technologies Neutral 2,030 $40.2B N/A 24.1
    Tech Mahindra Sell 1,470 ₹1.35T N/A 25.1
    Wipro Sell 315 N/A N/A 15.1

    This table underscores valuation divergences: Wipro’s low P/E suggests undervaluation but signals growth concerns if AI traction lags. Infosys and HCLTech appear better positioned for AI-driven recovery, per UBS, while TCS and HCL face neutral outlooks amid margin volatility. Persistent Systems, at $12.3 billion and P/E 38.9, emerges as a high-growth outlier. Risks include FII outflows, INR depreciation, and competition from OTT platforms indirectly affecting ancillary tech spends. Retail participation has grown significantly as access to a reliable trading platform has become more widespread.

    Market Outlook

    Indian IT investors should monitor TCS’s April 9 board outcomes for FY26 dividend clues and earnings guidance, alongside UBS’s projected Q4 softness. Upside lies in AI deals scaling to $315 billion sector revenue, but downside risks from geopolitical crude spikes, US slowdowns, and deal ramp-downs could pressure NIFTY 50 IT weights. Key players like Infosys and HCLTech offer relative safety; watch RBI interventions on INR for export margins. Institutional focus shifts to AI adopters, with 12-18 month horizons favoring discounted valuations over 20-25x P/E multiples.

    Conclusion

    India’s IT sector stands at a crossroads, balancing innovation partnerships and lab expansions against UBS-downgraded targets and negative returns. TCS’s dividend prospects provide a near-term anchor, yet pervasive one-year losses demand vigilance on AI execution and global cues. For Sensex and Nifty participants, selective exposure to high-conviction names like Infosys amid $315 billion FY26 projections positions portfolios for rebound, while hedging geopolitical and currency risks remains imperative in this high-stakes environment.

  • RBI MPC Schedule 2026-27 Signals Steady Banking Outlook

    RBI MPC Schedule 2026-27 Signals Steady Banking Outlook

    The Reserve Bank of India has unveiled the Monetary Policy Committee meeting calendar for fiscal year 2026-27, setting the stage for six bi-monthly reviews beginning April 6-8, amid a stable policy repo rate of 5.25 percent. This announcement, released on March 23, underscores the central bank’s commitment to balancing inflation control within the 4 percent target plus or minus 2 percent band and supporting robust domestic growth projected at 7 to 7.4 percent for FY27. With the NIFTY Bank index holding firm near 52,000 levels and SENSEX banking heavyweights like State Bank of India, HDFC Bank, ICICI Bank, and Axis Bank showing resilience, the schedule provides critical visibility for investors navigating INR volatility at 0.0106 USD and geopolitical headwinds from West Asia conflicts. Markets anticipate continuity in the neutral stance adopted in the February 2026 meeting, chaired by Governor Sanjay Malhotra, as inflation forecasts edge up to 4.0-4.3 percent.

    Key Highlights

    • RBI MPC to convene six times: April 6-8, June 3-5, August 3-5, October 5-7, December 2-4, 2026, and February 3-5, 2027.
    • Policy repo rate unchanged at 5.25 percent following unanimous February decision, with neutral stance retained amid controlled inflation and strong growth.
    • FY27 inflation projected at 4.0-4.3 percent, within target; growth outlook at 7-7.4 percent per Chief Economic Adviser.
    • INR at 0.0106 USD, down 0.38 percent daily and 4.50 percent year-to-date, pressured by Mideast tensions and oil surge above $100.
    • Second inflation target review due by end-March 2026, potentially shaping long-term policy framework.

    RBI Monetary Policy Stability

    The RBI’s release of the FY27 MPC schedule aligns with Section 45ZI of the RBI Act, 1934, mandating transparency in policy timelines to enhance market predictability. This six-meeting cadence allows the committee, comprising three RBI officials including Governor Sanjay Malhotra and three external members, to methodically assess macroeconomic indicators such as retail inflation, GDP trajectory, and liquidity conditions. The February 59th meeting’s decision to hold the repo rate at 5.25 percent reflects a deliberate pause after prior rate cuts, prioritizing stability as domestic growth remains robust despite global uncertainties.

    Inflation dynamics are pivotal, with FY27 projections of 4.0-4.3 percent marking a moderation from FY26’s Q4 estimate of 3.2 percent, yet staying within the tolerance band extended to March 2026. The impending second review of this target, notified in 2016 and reaffirmed in 2021, could introduce adjustments if geopolitical risks like West Asia conflicts elevate imported inflation via higher oil prices. For institutional investors, this framework signals low near-term volatility in borrowing costs, benefiting net interest margins for major lenders. Investors looking to participate in this market movement can open free demat account online through SEBI-registered brokers.

    Banking sector liquidity has been bolstered by recent RBI interventions, including open market operations purchasing up to 1 trillion rupees in bonds, countering INR depreciation pressures. With the rupee hitting record lows amid $100-plus crude, the central bank’s dollar sales have tempered volatility, safeguarding pass-through effects on domestic fuel prices and CPI.

    Major Banks Performance Amid Policy Clarity

    State Bank of India, India’s largest lender by assets, reported steady advances growth of 15.2 percent year-on-year in Q3 FY26, underpinned by robust retail and corporate loan demand. SBI’s net interest income rose 12.8 percent to 42,500 crore rupees, with net profit at 18,300 crore rupees, reflecting improved asset quality as gross NPAs fell to 2.3 percent. Shares traded at 850 rupees on BSE, up 1.2 percent, buoyed by expectations of sustained low rates supporting credit expansion.

    HDFC Bank, post-merger synergies intact, showcased deposit mobilization of 1.47 lakh crore rupees, a 24 percent increase, driving a loan book expansion to 25.5 lakh crore rupees. CASA ratio held at 37.5 percent, enabling NIMs of 4.1 percent. ICICI Bank’s digital thrust yielded 18 percent deposit growth to 12.5 lakh crore rupees, with retail loans surging 22 percent; profits climbed 28 percent to 12,800 crore rupees. Axis Bank mirrored this trend, with advances at 10.1 lakh crore rupees, up 14 percent, and ROA improving to 1.8 percent on slimmer provisions.

    NIFTY 50 dipped 0.5 percent to 24,200, while BSE Sensex shed 150 points to 80,100, banking stocks outperformed with NIFTY Bank gaining 0.8 percent to 52,300. These figures highlight sector resilience, as PSUs like SBI and private peers HDFC, ICICI, Axis leverage RBI’s neutral stance for margin accretion amid 7 percent GDP growth. This development presents new considerations for stock investment strategies focused on Indian equities.

    Banking Sector Metrics Comparison

    The table below contrasts key Q3 FY26 metrics for leading banks, revealing private sector edge in profitability and asset quality.

    Bank Total Advances (lakh crore INR) NIM (%) Gross NPA (%) Net Profit (crore INR) Market Cap (lakh crore INR)
    SBI 35.2 3.4 2.3 18,300 7.6
    HDFC Bank 25.5 4.1 1.2 17,200 12.1
    ICICI Bank 13.8 4.3 1.8 12,800 9.2
    Axis Bank 10.1 4.2 1.5 7,200 3.8

    Private banks exhibit superior NIMs above 4 percent versus SBI’s 3.4 percent, driven by higher CASA shares (HDFC 37.5 percent, ICICI 40 percent). NPAs average 1.5 percent for privates against SBI’s 2.3 percent, though all have improved 50 basis points year-on-year. Market caps underscore HDFC’s premium valuation at 4.7 times book value, signaling investor confidence in deposit franchises amid RBI liquidity support.

    Risks include INR weakness eroding forex gains and potential oil shock inflating input costs, but strong capital buffers (SBI CET1 13.5 percent, HDFC 19.5 percent) mitigate downturns.

    Market Outlook

    Looking ahead, the April 6-8 MPC meeting will scrutinize Q4 FY26 inflation data and trade pacts like India-EU FTA, potentially signaling rate cuts if growth moderates below 7 percent. Retail participation has grown significantly as access to a reliable trading platform has become more widespread. Investors should monitor INR trajectory below 0.0105 USD and bond yields, as OMO purchases sustain liquidity. Key players SBI, HDFC, ICICI, and Axis stand to gain from credit boom targeting 15 percent growth, but vigilance on geopolitical oil risks and inflation review outcomes is essential. NIFTY Bank upside to 55,000 appears feasible if repo holds steady, offering tactical buys on dips for yield-hungry portfolios.

    Conclusion

    RBI’s FY27 MPC calendar reinforces a predictable policy environment, anchoring banking sector stability with repo at 5.25 percent and growth-inflation balance intact. Major lenders like SBI, HDFC, ICICI, and Axis demonstrate operational strength through expanding books and pristine asset quality, positioning them as defensive bets amid INR pressures. As markets digest the schedule, institutional investors can harness this clarity for strategic positioning, watching April policy for cues on rate trajectory and forex interventions that will define FY27’s banking narrative.

  • Nifty 50, Sensex Gap-Up Outlook Amid Geopolitical Easing

    Nifty 50, Sensex Gap-Up Outlook Amid Geopolitical Easing

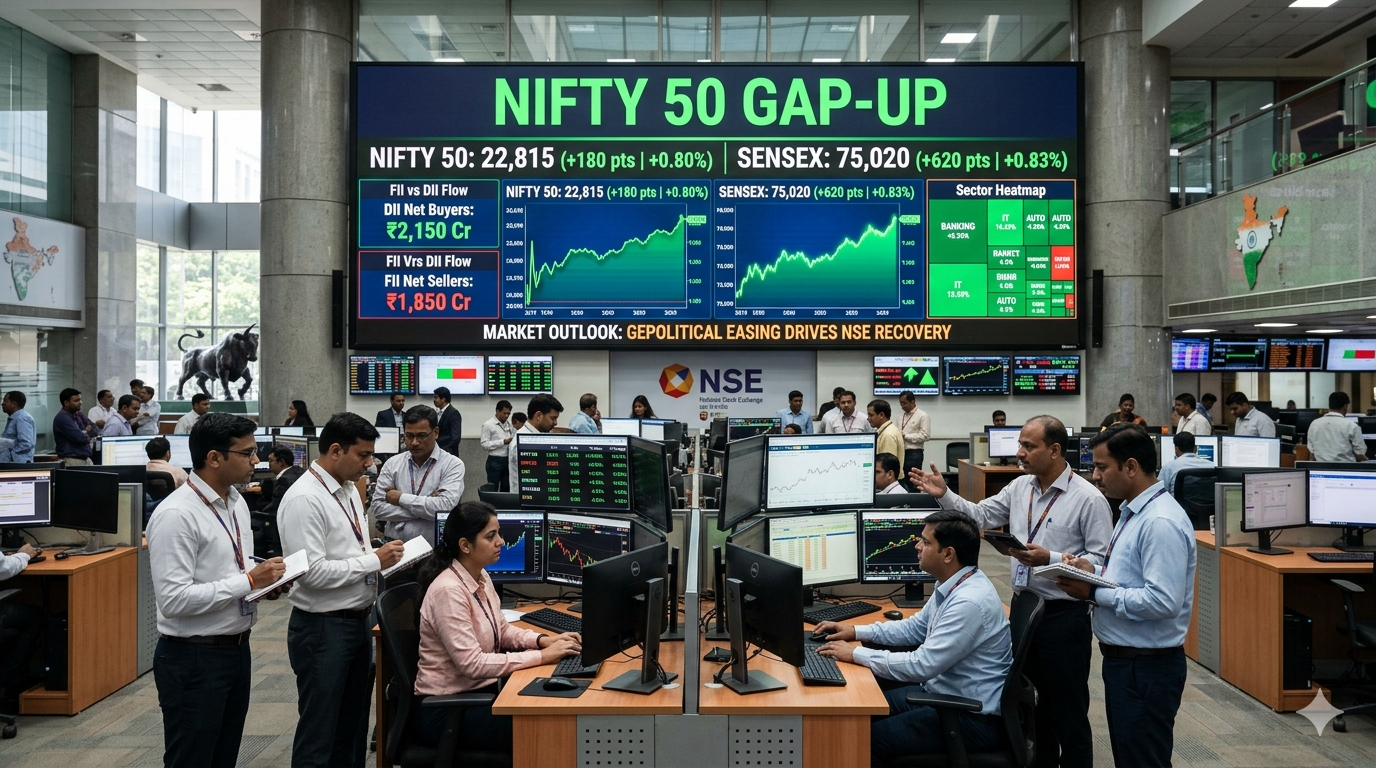
    https://www.findoc.com/learn/futures-and-options/what-is-f-and-o-ban-in-stock-marketIndian equity markets are poised for a sharp gap-up opening on Tuesday following a ceasefire announcement in the U.S.-Iran conflict, with GIFT Nifty signaling over 300 points higher at around 22,836 to 23,215 levels. This comes after a brutal Monday session where the Nifty 50 plunged 601.85 points or 2.60 percent to close at 22,512.65, and the Sensex shed 1,836.57 points or 2.46 percent to end at 72,696.39, driven by escalating geopolitical tensions and surging crude oil prices that hit $114 per barrel intraday before retreating below $100. Foreign institutional investors continued their 17th straight session of net selling, offloading Rs 10,414.23 crore on March 23, while domestic institutions countered with Rs 12,033.97 crore in purchases, underscoring persistent FII outflows totaling over Rs 69,000 crore in recent sessions. Broader markets underperformed, with banking stocks leading the rout as Nifty Bank tumbled 3.72 percent to 51,437.75.

    Key Highlights

    • GIFT Nifty up 371 points to 22,836 and as high as 23,215 with 3.34 percent gain, pointing to volatility but positive start.
    • FIIs net sellers for 17 sessions, dumping Rs 10,414 crore on March 23; DIIs absorb with Rs 12,034 crore buying.
    • Nifty options data shows max put OI at 22,000 strike for support, max call OI at 23,000 for resistance; PCR at 0.69.
    • Crude oil slump below $100/barrel post-ceasefire eases input cost pressures; US indices rally 1-1.38 percent.
    • SEBI approves eased FPI settlement norms, revised intermediary frameworks, and stricter disclosure rules for officials.

    Nifty 50, Sensex Plunge Analysis

    The benchmark indices endured one of their steepest single-day declines in recent memory on Monday, with the Nifty 50 breaching key support at 22,700 and forming a pattern of lower highs and lower lows, signaling a bearish bias in both short and medium terms. This downturn was exacerbated by heightened U.S.-Iran tensions, which propelled crude oil to intraday peaks of $114 per barrel, inflating import costs and stoking inflation fears for oil-dependent India. Market volatility spiked, with broader indices lagging sharply as midcaps and smallcaps amplified the losses.

    Technically, Monday’s high of 22,856 now poses immediate resistance for Nifty, while a sustained drop below 22,700 could accelerate selling toward 22,400, 22,300, and even 22,200 in follow-through weakness. Daily and weekly oscillators hover near oversold territory, hinting at potential short-term relief, but analysts caution that elevated volatility persists amid uncertain global cues. The U.S. dollar index’s 0.2 percent rise to 99.35 adds pressure on the INR, which weakened amid risk-off sentiment, though exact levels remain fluid pre-open.

    FII activity remains a critical drag, with net sales accelerating to Rs 10,414 crore on March 23 from Rs 5,518 crore on March 20, reflecting broader emerging market outflows. DIIs have valiantly stemmed the tide, netting Rs 12,034 crore purchases on March 23, but their capacity to fully offset FII exits is tested as valuations compress. Sectors like banking bore the brunt, with Nifty Bank violating 52,500 support and plunging below 51,500, exposing vulnerabilities in loan growth amid rising funding costs.

    FII DII Flows and Sector Impacts

    Foreign portfolio investors’ relentless selling spree, now spanning 17 sessions, has drained over Rs 69,000 crore from Indian equities since early March, with daily figures showing Rs 10,716 crore on March 13, Rs 9,365 crore on March 16, and consistent outflows thereafter. This capitulation aligns with global risk aversion, but domestic mutual funds and insurance giants stepped up, logging Rs 12,593 crore buys on March 16 and Rs 9,977 crore on March 13, bolstering resilience in largecaps.

    Banking emerged as the epicenter of Monday’s carnage, with Nifty Bank cratering 3.72 percent to 51,437.75 after breaching 52,500 support. Key drags included major lenders like HDFC Bank, ICICI Bank, and State Bank of India, which saw amplified losses amid fears of margin compression from elevated oil prices and potential RBI rate pauses. Private banks faced sharper hits due to high FPI exposure, while public sector banks offered relative stability on DII backing.

    IT and metals also faltered, with companies like Tata Consultancy Services, Infosys, and Tata Steel under pressure from dollar strength and commodity volatility. Conversely, select defensives like Hindustan Unilever and ITC showed mild resilience. Investors looking to participate in this market movement can open demat account through SEBI-registered brokers as pre-market cues from GIFT Nifty’s surge suggest rotation potential into rate-sensitive sectors if the gap-up holds, but Sammaan Capital and SAIL remain in F&O ban, curbing derivative plays.

    Japan’s softening PMIs—manufacturing at 51.4, services at 52.8—signal global demand moderation, indirectly pressuring Indian exporters. SEBI’s regulatory tweaks, including eased FPI settlement and intermediary norms, aim to enhance liquidity, potentially aiding inflows once sentiment stabilizes.

    Technical Levels and Options Data

    Nifty 50 faces pivotal levels post-Monday’s breach:

    • Key Support: 22,700 (immediate), 22,400-22,300 (next), 22,000 (strong put OI base), 22,200 (follow-through downside).
    • Key Resistance: 22,856 (Monday high), 23,000 (max call OI), 23,075 (upside target).
    • Bank Nifty Support: 51,500 (breached), 50,700-50,000 (critical).
    • Bank Nifty Resistance: 52,665-53,297 (gap area).

    Options chain reveals Put-Call Ratio at 0.69, with heavy put OI buildup at 22,300 and 22,000 strikes underscoring downside protection, while call OI clusters from 22,500-23,000 signal overhead supply. Expiry dynamics favor bulls above 23,042 for call strategies and bears below 22,445 for puts, but sustaining 23,000 close is essential for momentum.

    This development presents new considerations for stock investment strategies focused on Indian equities, as broader FII/DII flows highlight the trend:

    Date FII Net (Rs Cr) DII Net (Rs Cr)
    23 Mar -10,414 12,034
    20 Mar -5,518 5,706
    19 Mar -7,558 3,864
    18 Mar -2,714 3,253
    17 Mar -4,741 5,225

    This underscores DIIs’ role as stabilizers amid FII flight.

    Market Outlook

    Indian investors face a high-stakes session with gap-up potential testing 23,000, but sustainability hinges on holding above this psychological barrier amid expiry volatility and lingering geopolitical risks. A ceasefire-driven crude retreat below $100/barrel offers relief on inflation and CAD fronts, potentially prompting RBI vigilance on INR stability around 83-84 levels. Key watches include FPI flows reversing post-SEBI easing, Bank Nifty rebound from oversold, and rotation to IT/metals if global PMIs stabilize. Retail participation has grown significantly as access to a reliable trading platform has become more widespread, while risks persist from U.S. policy shifts under Trump and oil spikes; institutional players may eye dips to 22,300 for accumulation, prioritizing quality largecaps with strong DII support. Volatility index remains elevated, favoring hedged strategies.

    Conclusion

    Tuesday’s anticipated gap-up reprieve underscores Indian markets’ resilience amid global turbulence, with DII buying countering FII outflows and technical oversold signals hinting at tactical bounces. Yet, the bearish structure of lower highs/lows and breached supports demands caution, as renewed U.S.-Iran flares or crude surges could drag indices toward 22,000. For institutional investors, focus on sector rotation, F&O expiry plays, and regulatory tailwinds positions portfolios for volatility harvesting, ensuring disciplined risk management in this fluid environment.

  • India Economy Update: Rising Inflation, GDP Discrepancies, and Oil

    India Economy Update: Rising Inflation, GDP Discrepancies, and Oil

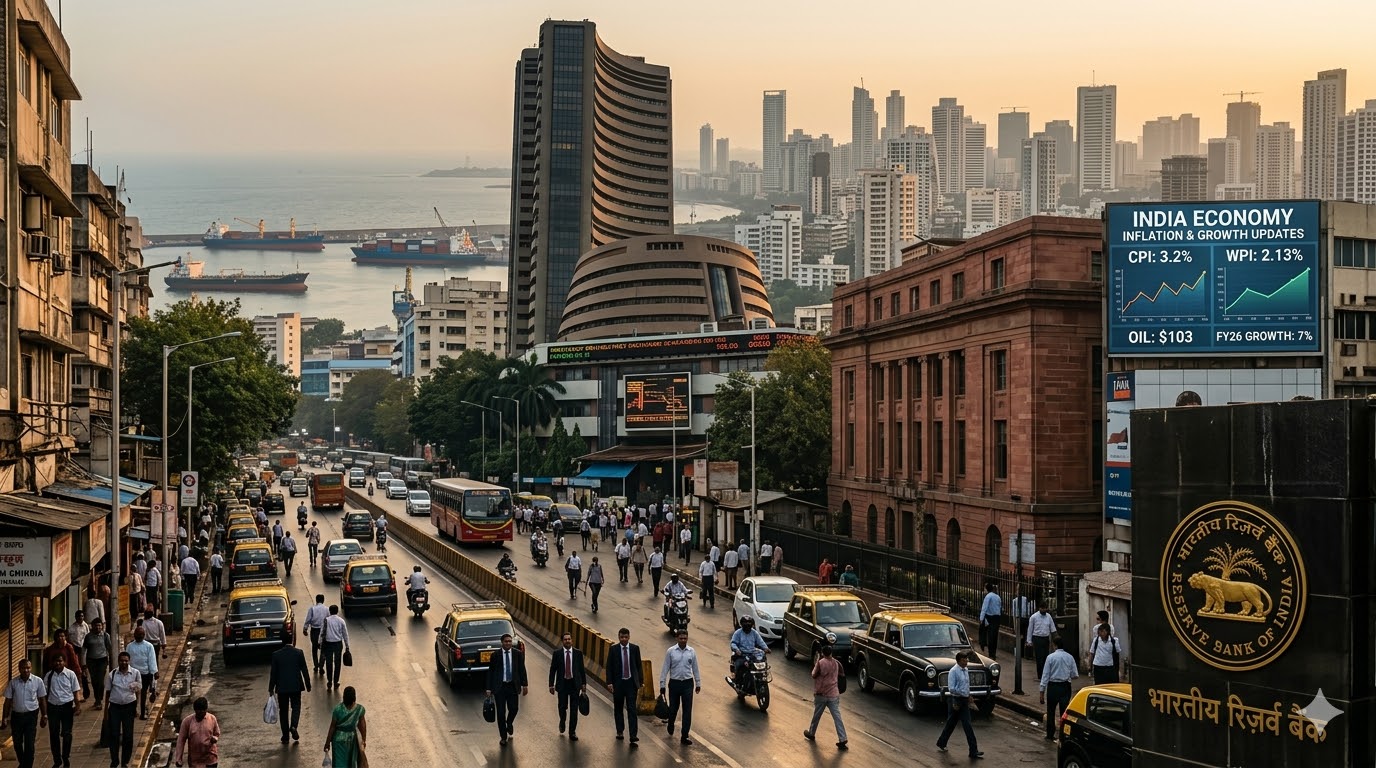
    India’s economy faces mounting pressures from accelerating inflation and statistical discrepancies in the newly revised GDP series, even as geopolitical oil shocks threaten to erode hard-won price stability. Wholesale price inflation (WPI) surged to 2.13% in February 2026 from 1.81%, exceeding forecasts of 2.0%, primarily driven by food prices climbing to 2.19% from 1.55%. Consumer price inflation (CPI) edged up to 3.2% from 2.7%, remaining within the Reserve Bank of India’s (RBI) 2-6% tolerance band but vulnerable to Brent crude topping $100 per barrel amid Iran-Israel tensions. The new GDP series with base year 2022-23 reveals rising discrepancies, reaching nearly ₹4.9 lakh crore for FY26 estimates, raising questions on growth reliability. With the rupee hovering around 83-84 to the US dollar and trade deficit narrowing to $27.1 billion, markets like NIFTY 50 and SENSEX remain cautious ahead of RBI’s monetary policy review.

    Key Highlights

    • WPI inflation accelerates to 2.13% YoY, food component at 2.19%, surpassing 2.0% consensus forecast
    • CPI holds at 3.2% for February, up from 2.7%, within RBI target but pressured by oil at $103/barrel
    • New GDP series shows discrepancies ballooning to ₹4.9 lakh crore in FY26 from near zero in FY23
    • Rupee trades at 83-84/USD amid rising oil import bill; trade deficit shrinks to $27.1 billion from $34.7 billion
    • Government projects FY26 growth up to 7.2%, but oil shock dims outlook with CAD at 3.5% of GDP

    Inflation Trends and RBI Monetary Policy

    India’s inflation landscape deteriorated modestly in February 2026, with WPI rising to 2.13% from 1.81% prior month, driven by food inflation’s sharp rebound to 2.19% from 1.55%. This uptick, above the 2.0% market expectation, signals renewed price pressures in primary articles and underscores the fragility of disinflation gains achieved in late 2025 through favorable base effects. CPI inflation, meanwhile, printed at 3.2%, a 50 basis point increase from January’s 2.7%, yet comfortably within RBI’s medium-term target of 4% with upper tolerance at 6%. Finance Minister Nirmala Sitharaman highlighted this resilience, projecting annual inflation between 3-4% for FY26, but cautioned on external vulnerabilities.

    The RBI’s monetary policy stance remains pivotal, with no immediate rate decision in the past 24 hours but heightened vigilance implied amid global oil volatility. Brent crude’s rally to $103, fueled by Iran-Israel conflict, poses imported inflation risks, as India imports over 85% of its crude needs. Analysts estimate a sustained $10/barrel increase could add 0.2-0.3% to CPI, potentially pushing it toward 4% in Q1 FY26. This echoes historical shocks that widened the current account deficit (CAD) and pressured the rupee, which weakened to 83-84/USD levels, inflating the oil import bill. RBI Governor’s anticipated comments in the upcoming policy review will be scrutinized for hints on repo rate adjustments, currently steady post-2025 easing cycle. Investors looking to participate in this market movement can open free demat account online through SEBI-registered brokers. Market participants on NSE and BSE platforms note implied yields on 10-year G-Secs edging higher, reflecting inflation repricing.

    Domestic factors compound these pressures, including kitchen inflation trends where vegetable and protein prices contribute to headline stickiness. While core CPI components show moderation, energy pass-through via transportation and manufacturing costs remains a wildcard. Policymakers’ balancing act—sustaining 7%+ growth without fueling inflation—will test RBI’s credibility, especially with discrepancies clouding growth data.

    GDP Data Revisions and Growth Metrics

    The Ministry of Statistics and Programme Implementation (MoSPI) unveiled a new GDP series on February 27, 2026, shifting the base year to 2022-23 from 2011-12, aiming to capture structural shifts in the economy. However, this revision has spotlighted escalating statistical discrepancies—the gap between production and expenditure-side estimates—which surged from near zero in FY23 to ₹1 lakh crore in FY24 and an estimated ₹4.9 lakh crore in FY26. As a percentage of GDP, these exceed the ideal threshold of below 2%, distorting real growth figures and eroding data credibility for investors tracking NIFTY 50 heavyweights like Reliance Industries and HDFC Bank.

    Real GDP growth under the new series stood at 7.2% for FY24, with private final consumption expenditure (PFCE) at 5.7% and gross fixed capital formation (GFCF) contributing around 30% to nominal GDP. FY25 saw 7.1% overall growth, but component growth lagged at 6.1%, bridged by a 230% jump in discrepancies to ₹3.5 lakh crore. Nominal GDP growth for FY26 is pegged at 8%, implying real growth of ~7.4%, though critics like Arvind Subramanian argue historical overestimation by 1.5-2% annually since 2011. Deflator inaccuracies, with MoSPI expanding from 180 to 600 indices, exacerbate issues as distance from the base year grows, leading to distorted real GDP.

    Market implications are evident in BSE Sensex and NSE NIFTY 50, which dipped amid oil-led growth dimming, with government FY26 projection at up to 7.2% now at risk. This development presents new considerations for stock investment strategies focused on Indian equities. Key players like Larsen & Toubro in infrastructure (GFCF proxy) and ITC in consumption face scrutiny, as incomplete informal sector data fuels gaps. Trade dynamics offer some relief: imports fell to $63.7 billion, narrowing deficit to $27.1 billion.

    CPI vs WPI Inflation Comparison

    Metric February 2026 January 2026 Forecast Key Driver
    CPI YoY 3.2% 2.7% N/A Energy pass-through, food
    WPI YoY 2.13% 1.81% 2.0% Food (2.19%), primary articles
    Impact on Rupee 83-84/USD Stable N/A Oil bill rise
    CAD % GDP ~3.5% N/A N/A Energy imports (85% reliance)

    This table underscores WPI’s faster acceleration, signaling upstream pressures likely to filter into CPI via manufacturing. Rupee depreciation amplifies CAD risks, with oil at $103 adding ~0.3% to inflation per $10 rise. Investors should monitor food sub-indices and Brent futures for divergence signals.

    Market Outlook

    Looking ahead, Indian investors face a cautious environment with RBI policy as the linchpin. Oil persistence above $100 could shave 0.5-1% off FY26 growth from 7.2%, widening CAD and forcing rupee interventions, per economist projections. NIFTY 50 and SENSEX may consolidate around 24,000-25,000 levels, favoring defensives like Hindustan Unilever over cyclicals. Retail participation has grown significantly as access to a reliable trading platform has become more widespread. Key watches: Q1 GDP flash (discrepancies), March CPI/WPI, and RBI’s April review for rate signals. Downside risks include sticky 4%+ inflation; upsides hinge on West Asia de-escalation. Portfolio tilts toward gold (nearing ₹1.6 lakh) offer hedges.

    Conclusion

    India’s economy navigates a precarious equilibrium, with inflation upticks to 3.2% CPI and 2.13% WPI, compounded by ₹4.9 lakh crore GDP discrepancies, testing RBI’s resolve amid oil at $103. Narrowing trade gaps provide ballast, but rupee pressures and external shocks demand vigilant policy. For institutional investors, this milieu underscores diversification, data skepticism, and focus on resilient sectors—positioning for volatility while eyeing 7% growth potential will define returns in FY26.

  • RBI Liquidity Injection 2026: Impact on Indian Banking Sector, SBI

    RBI Liquidity Injection 2026: Impact on Indian Banking Sector, SBI

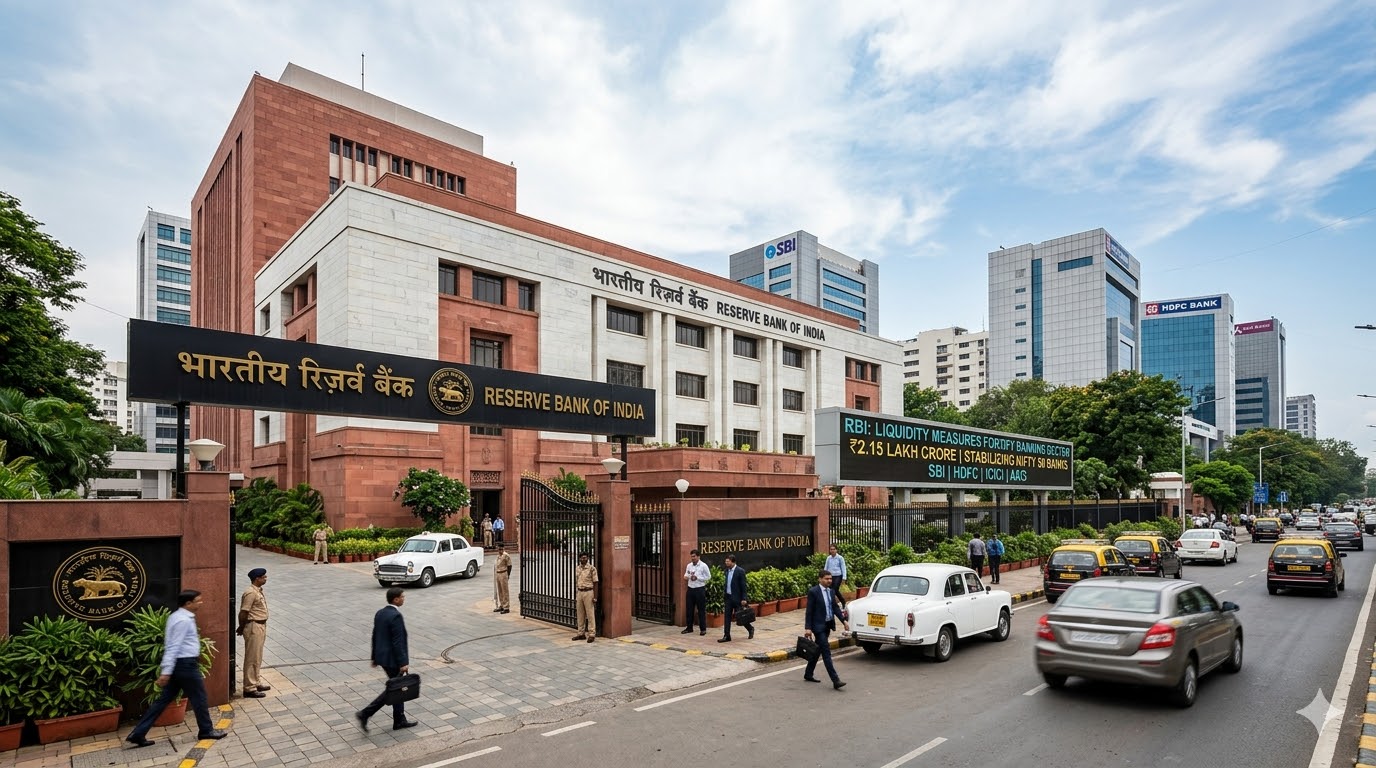
    The Reserve Bank of India (RBI) has unveiled a robust ₹2.15 lakh crore liquidity infusion package into the banking system, comprising variable rate repo auctions, forex swaps, and open market operations, to counter tightening liquidity amid year-end credit demands and tax outflows. This intervention, timed between late January and mid-February 2026, arrives as inflation pressures mount with Wholesale Price Index (WPI) projected at 3.2 percent for March 2026, influencing expectations for the upcoming Monetary Policy Committee (MPC) meeting in April. Major private sector banks like HDFC, ICICI, and Axis Bank, alongside public sector leader State Bank of India (SBI), stand to benefit from eased funding costs, potentially stabilizing NIFTY Bank index performance amid SENSEX and NIFTY 50 volatility. As the flexible inflation-targeting framework nears its second review post a decade of MPC operations, these measures underscore RBI’s commitment to financial stability in India’s banking sector.

    Key Highlights

    • RBI to inject ₹2.15 lakh crore via 90-day Variable Rate Repo (VRR) of ₹25,000 crore on January 30, USD/INR buy-sell swap of USD 10 billion (₹90,000 crore) on February 4, and ₹1 lakh crore OMO purchases in two tranches on February 5 and 12.
    • System liquidity tightened due to advance tax and GST outflows, with Weighted Average Call Rate (WACR) exceeding the 5.25 percent policy repo rate in mid-December 2025.
    • WPI inflation forecast at 3.2 percent for March 2026, up from 2.1 percent in February, driven by crude oil, natural gas, and edible oil prices amid West Asia tensions.
    • MPC completes 10 years with 59 meetings; only 12 rate cuts, 16 hikes, and 31 no-changes, mostly under neutral stance, per SBI Research analysis.
    • Inflation targeting framework (4 percent +/- 2 percent) up for second review ending March 31, 2026; CPI at 3.21 percent provides RBI maneuvering room.

    RBI Liquidity Measures for Indian Banking Stability

    The RBI’s multi-pronged liquidity strategy addresses acute system stress, where short-term borrowing costs had surged above the policy repo rate of 5.25 percent. The 90-day VRR auction of ₹25,000 crore on January 30 marks a pioneering extension from prior 56-day tenors, offering banks like SBI, HDFC Bank, ICICI Bank, and Axis Bank longer-term funding to match liabilities and sustain credit growth into the financial year-end. This is complemented by a three-year USD/INR buy-sell forex swap auction of USD 10 billion on February 4, injecting approximately ₹90,000 crore in durable rupee liquidity while mitigating INR volatility risks.

    Open Market Operations (OMOs) form the package’s cornerstone, with ₹1 lakh crore in government security purchases split into ₹50,000 crore tranches on February 5 and 12, directly crediting banks’ reserves and pressuring yields lower to spur lending. For institutional investors tracking NIFTY Bank, these infusions could compress credit spreads, benefiting net interest margins (NIMs) for deposit-heavy players like SBI, whose group chief economic advisor Soumya Kanti Ghosh noted the central bank’s nimble response under neutral stances in MPC history. The timing aligns with seasonal credit surges, preventing a repeat of December 2025’s negative liquidity episodes. Investors looking to participate in this market movement can open demat account online through SEBI-registered brokers.

    This proactive calibration reflects RBI Governor Sanjay Malhotra’s tenure, characterized by 86 percent unanimous MPC decisions since December 2024, contrasting Urjit Patel-era splits. Analysts view the package as a bridge to April’s MPC, where liquidity trends will inform stance amid rising inflation.

    Inflation Pressures and MPC Implications for Bank Stocks

    Rising inflation complicates the liquidity narrative, with ICRA forecasting WPI at 3.2 percent in March 2026—a 21-month high—fueled by crude oil, natural gas, and edible oils amid West Asia conflicts. February’s WPI hit 2.1 percent from January’s 1.8 percent, pressuring bond yields and potentially elevating banks’ cost of funds if MPC signals tightening. CPI remains at 3.21 percent, within the 4 percent +/- 2 percent target, granting RBI flexibility; Vishal Goenka, Co-Founder of Indiabonds.com, asserts, “India’s CPI at 3.21 percent still gives the RBI enough room… rates would actually stay lower for longer because growth is the larger priority.”

    For banking heavyweights, this dynamic influences deposit mobilization and loan pricing. SBI, with its vast branch network, could leverage infused liquidity for retail credit expansion, while HDFC Bank—post-merger—focuses on wholesale funding relief via OMOs. ICICI Bank and Axis Bank, with higher loan-to-deposit ratios around 100 percent historically, stand to gain from lower marginal funding costs, potentially boosting quarterly NIMs by 10-20 basis points if WACR realigns to 5.25 percent. This development presents new considerations for stock investment strategies focused on Indian equities. NIFTY 50 and SENSEX banking weights (approximately 25 percent combined) amplify these effects; a sustained liquidity surplus might lift NIFTY Bank by 2-3 percent short-term, per market consensus.

    SBI Research highlights MPC’s evolution: over 10 years, 24 rate actions occurred mostly neutrally, reducing hike episodes post-2016 inflation targeting (8 cuts vs. 16 hikes pre-regime). The framework’s first review in March 2021 retained it till March 2026, with RBI reporting Parliament only once during pandemic inflation spikes above 6 percent.

    Banking Sector Liquidity Operations Breakdown

    The RBI’s package provides a structured liquidity matrix, detailed below for key players’ strategic planning:

    Operation Type Amount Scheduled Date(s) Impact on Banks
    90-Day Variable Rate Repo (VRR) ₹25,000 crore January 30, 2026 Short-to-medium term funding for SBI, HDFC; first 90-day tenor eases liability matching.
    USD/INR Buy-Sell Swap USD 10 billion (₹90,000 crore) February 4, 2026 Durable rupee injection; stabilizes INR for ICICI, Axis export credit books.
    OMO Government Security Purchases ₹1 lakh crore (2 x ₹50,000 crore) February 5 & 12, 2026 Lowers yields, boosts reserves; enhances NIMs across PSBs and private banks.

    This table illustrates phased infusion, prioritizing immediate relief via VRR before long-term OMO stability. Risks include swap rollovers in three years if INR weakens, exposing forex-sensitive Axis Bank (noted for 15-20 percent FX exposure). Investors should monitor WACR daily; persistence above 5.50 percent signals incomplete absorption, pressuring SBI’s treasury profits. Retail participation has grown significantly as access to a reliable trading platform has become more widespread.

    Market Outlook

    Looking ahead, RBI’s ₹2.15 lakh crore infusion positions the Indian banking sector for resilient Q4 FY26 credit growth at 12-14 percent YoY, outpacing 10 percent GDP, but investors must watch April MPC for rate cues amid 3.2 percent WPI risks. NIFTY Bank could target 52,000 if liquidity sustains, rewarding HDFC and ICICI’s retail focus, though Axis Bank’s corporate slippages warrant caution. INR stability near 83.50/USD hinges on swap efficacy, with SENSEX banking drag risks if inflation forces hikes. Key watches: MPC unanimity under Malhotra, GST outflow cycles, and OMO uptake by PSBs like SBI. Institutional portfolios should overweight liquid banks, hedging via NIFTY Bank futures amid volatility.

    Conclusion

    RBI’s decisive ₹2.15 lakh crore liquidity measures, amid inflating WPI and MPC legacy, fortify India’s banking sector against year-end strains, directly aiding SBI, HDFC, ICICI, and Axis Bank in aligning costs with policy rates. By blending VRR innovation, forex swaps, and OMOs, the central bank reaffirms growth priority within inflation bounds, stabilizing NIFTY 50 banking constituents for investors. As the targeting framework reviews conclude, sustained vigilance on liquidity metrics and inflation will define sector outperformance, underscoring prudent positioning in this dynamic landscape.

  • Indian IT Stocks Rebound Sharply: Nifty IT Surges 2.45%

    Indian IT Stocks Rebound Sharply: Nifty IT Surges 2.45%

    Indian IT stocks staged a robust rebound on Wednesday, with the Nifty IT index surging 2.45 percent to lead sectoral gains after a steep 2.33 percent decline the previous day that pushed it near a three-year low. Heavyweights TCS, Infosys, Wipro, and HCL Technologies drove the recovery, posting gains of up to 2.8 percent amid short covering and bargain hunting following global demand concerns. The broader market supported the upswing, with Sensex rising 444 points or 0.6 percent to 76,515 and Nifty advancing 145 points to 23,726, as India VIX eased nearly 5 percent on stabilizing risk sentiment.

    Key Highlights

    • Nifty IT index jumps 2.45 percent, top sectoral performer, reversing Tuesday’s 2.33 percent fall to near three-year low
    • TCS leads with 2.8 percent gain, top Nifty gainer; Wipro up 2.4 percent, Infosys and HCL Tech around 2 percent each
    • Sensex at 76,515 (up 0.6 percent), Nifty at 23,726 (up 0.6 percent); strong market breadth with 2,559 advances vs 517 declines
    • Morgan Stanley forecasts relief rally ahead of earnings; Outperform ratings on Infosys, TCS, Tech Mahindra, LTIMindtree
    • India VIX declines nearly 5 percent, signaling reduced volatility after global cues weighed on sector yesterday

    Nifty IT Rebound Analysis

    The Nifty IT index’s sharp 2.45 percent recovery on Wednesday marked a decisive turnaround from Tuesday’s 2.33 percent drop, where it neared a three-year low amid sector-wide selling. TCS emerged as the standout performer, climbing nearly 2.8 percent to become the top gainer on the Nifty 50, while Wipro rose 2.4 percent, Infosys gained close to 2 percent, and HCL Technologies advanced around 2 percent. This collective surge placed five IT majors among the benchmark’s top gainers, underscoring renewed investor confidence in large-cap names after heavy losses the prior session.

    Analysts attribute the rebound primarily to short covering and bargain buying in beaten-down stocks, bolstered by positive global cues from higher US market closes overnight. Despite persistent geopolitical tensions, stabilizing risk sentiment and a 5 percent dip in India VIX to lower levels encouraged dip-buying, particularly as foreign institutional investor (FII) selling pressures eased temporarily. Investors looking to participate in this market movement can open demat account through SEBI-registered brokers to access these opportunities.

    The rally extended to midcap IT stocks, signaling broad-based recovery rather than isolated large-cap strength, though sustainability hinges on upcoming US Federal Reserve signals and tech spending trends.

    Company Performances and Market Data

    Tuesday’s session highlighted vulnerabilities, with Wipro plunging over 3 percent as the top Nifty loser, Infosys down 2.2 percent, HCL Technologies off 2.1 percent, TCS slipping 1.8 percent, and Tech Mahindra declining 1.2 percent. Midcaps like Coforge fell over 5 percent, amplifying the Nifty IT’s 2.33 percent retreat while the broader Sensex dipped just 0.1 percent to 75,410 and Nifty 50 eased 0.1 percent to 23,377. Market breadth remained positive with 1,632 advances against 1,363 declines, isolating IT’s weakness to global factors like anticipated delays in US rate cuts.

    Wednesday’s reversal saw TCS at the forefront with its 2.8 percent jump, supported by its market-leading position and resilient deal pipeline. Infosys and Wipro followed closely, with gains reflecting investor appetite for undervalued blue-chips amid earnings anticipation. HCL Technologies’ 2 percent rise, alongside Tech Mahindra, rounded out the leaders, as the sector capitalized on a softer INR that could bolster repatriated earnings despite US-centric revenue exposure exceeding 60 percent for most majors.

    Morgan Stanley’s outlook predicts a relief rally pre-earnings, spotlighting Infosys and TCS as pivotal drivers, with potential upside from deal wins and AI-led transformations. FII outflows persisted as a drag, but domestic institutional buying provided counterbalance, keeping Nifty IT’s year-to-date performance in positive territory despite recent volatility.

    IT Majors Performance Comparison

    Company Tuesday Decline (%) Wednesday Gain (%) Analyst Rating
    TCS -1.8 +2.8 Outperform
    Infosys -2.2 +2.0 Outperform
    Wipro -3.0+ +2.4 Hold
    HCL Tech -2.1 +2.0 Hold
    Tech Mahindra -1.2+ +2.0 Outperform

    This table illustrates the volatility swing, with all majors reversing Tuesday’s losses driven by US demand fears and Fed watch. Wipro’s outsized drop and rebound highlight its sensitivity, while TCS’s leadership underscores its defensive appeal. Midcap extension, like Coforge’s prior 5 percent plunge, signals risks in smaller players amid uniform sector pressure. This development presents new considerations for stock investment strategies focused on Indian equities. Key watch: Rupee at around 83.50 per USD, impacting margins; FII flows totaling net sales of INR 10,000 crore YTD.

    Market Outlook

    Indian IT sector faces a pivotal juncture ahead of Q4 earnings, with Morgan Stanley’s relief rally prediction hinging on robust US deal flows and AI adoption offsetting tepid tech spending. Retail participation has grown significantly as access to a reliable trading platform has become more widespread. Investors should monitor RBI’s liquidity measures and INR stability, as a sub-83 levels could lift margins by 50-70 basis points for export-heavy firms like TCS and Infosys. Risks include sustained FII selling amid high valuations (Nifty IT forward P/E at 25x vs 22x historical average) and US recession signals, potentially capping upside to 5-7 percent near-term. Key players to watch: TCS and Infosys for deal guidance; watch Nifty IT resistance at 38,000 and support at 35,500. Institutional investors may favor Outperform-rated names for tactical longs, balancing global slowdown risks with domestic digital push.

    Conclusion

    The Nifty IT’s 2.45 percent surge underscores resilience in India’s tech bellwethers, transforming Tuesday’s three-year low scare into Wednesday’s sectoral leadership amid easing VIX and global stabilization. While TCS, Infosys, Wipro, and HCL Tech spearheaded the rebound, analysts’ differentiated ratings and Morgan Stanley’s rally call signal cautious optimism pre-earnings. For institutional investors, this volatility presents entry opportunities in high-conviction names, but vigilance on FII flows, Fed policy, and INR remains essential to navigate risks in this US-exposed sector.

  • Indian Real Estate Market Surge: DLF Doubles Bookings, Godrej

    Indian Real Estate Market Surge: DLF Doubles Bookings, Godrej

    The Indian real estate sector demonstrates robust momentum as leading developers DLF and Godrej Properties report stellar performances, with DLF’s sales bookings more than doubling to Rs 15,757 crore in the first half of FY26 driven by luxury demand in Gurugram and Mumbai, while Godrej promoters increased their stake by 5% through Rs 2,674 crore public share purchases. This activity coincides with resilient market trends, including a 9.1% rise in new residential supply and 14% YoY surge in transaction values in Q3 2025, bolstered by policy supports like cement GST cuts and Budget 2026’s thrust on tier-II/III cities. Amid NIFTY Core Housing index’s -2.7% weekly dip, underlying fundamentals point to sustained growth for institutional investors eyeing real estate equities.

    Key Highlights

    • DLF Ltd sales bookings leap over 2-fold to Rs 15,757 crore in Apr-Sep FY26 on luxury homes demand in Gurugram and Mumbai.
    • Godrej Properties promoters raise stake by 5% in FY26, acquiring public shares worth Rs 2,674 crore; recent land acquisitions in Gurugram and Kolkata total 16 acres for Rs 1,325 crore.
    • Residential real estate resilient with 9.1% new supply growth and 14% YoY transaction value rise in Q3 2025, aided by GST cuts on cement and festive demand outlook.
    • Budget 2026 allocates Rs 5,000 crore per City Economic Region in tier-II/III cities like Bengaluru and Surat, boosting residential and industrial demand.
    • Godrej Properties stock at Rs 1,946.55 with Rs 58,630 crore market cap, trading at 37.76 P/E but overvalued per intrinsic estimates; DLF at Rs 756.25 down 2.62%.

    DLF and Godrej Properties Lead Luxury Realty Boom

    DLF Ltd’s exceptional performance underscores the premium housing segment’s dominance, with sales bookings surging more than twofold to Rs 15,757 crore during April-September FY26, primarily fueled by high demand for luxury projects in key markets like Gurugram and Mumbai. This marks a significant acceleration from prior periods, reflecting buyer confidence in high-end properties amid stable macroeconomic conditions and INR resilience against global pressures. DLF’s share price stood at Rs 756.25, reflecting a 2.62% intraday decline, yet the bookings figure signals strong forward revenue visibility for FY26.

    Godrej Properties mirrors this trajectory with strategic moves enhancing its position. Promoters hiked their stake by 5% in FY26 through open market purchases totaling Rs 2,674 crore, demonstrating conviction in long-term growth. Complementing this, the company acquired over 16 acres across Gurugram and Kolkata for approximately Rs 1,325 crore as of early March 2026, positioning it for phased luxury developments. With a market capitalization of Rs 58,630 crore and end-of-day price of Rs 1,946.55 on March 17, Godrej trades at a trailing P/E of 37.76, 3.39 P/B, and 12.7 P/S based on TTM figures, though analysts deem it overvalued by 35% against median intrinsic value. These actions by key players highlight a sector pivot towards quality assets in high-growth corridors, appealing to institutional portfolios with realty exposure. Investors looking to participate in this market movement can open demat account through SEBI-registered brokers to access these opportunities.

    Mumbai Real Estate and Broader Property Market Resilience

    Mumbai’s real estate landscape benefits directly from DLF’s luxury push, where surging demand has propelled bookings amid a broader market shift to premium segments. PropTiger reports indicate residential resilience in Q3 2025, with new supply up 9.1% despite stable sales volumes, but total transaction values climbing 14% YoY due to larger ticket sizes in upscale homes. Policy tailwinds, including cement GST reductions and anticipated festive Q4 demand, are set to further elevate activity, with stable interest rates from RBI supporting buyer affordability.

    Godrej Icon in Gurgaon’s Sector 88A exemplifies micro-market strength, with average property rates at Rs 11,507 per sq ft in February 2026, posting 1.24% monthly growth. Nationally, the sector gains from Naredco’s partnership with Magicbricks for enhanced data analytics and market intelligence, promising better transparency for investors navigating BSE and NSE listings. Peers like Arvind SmartSpaces target Rs 700 crore revenue from a Vadodara housing venture, signaling diversification beyond metros. Recent stock trends show Godrej Properties underperforming peers with -31.5% one-year returns versus DLF’s -11.4% and Macrotech Developers’ -2.3%, amid NIFTY Core Housing’s -6.4% annual dip, yet fundamentals like TTM revenues of Rs 4,618 crore for Godrej underpin recovery potential. This development presents new considerations for stock investment strategies focused on Indian equities.

    Peer Comparison and Valuation Snapshot

    The following table compares key realty peers on recent performance and valuation metrics as of March 17, 2026:

    Company Price (Rs) MCap (Rs Cr) 1W Return 1M Return 1Y Return P/E (TTM)
    Godrej Properties 1,946.55 58,630 -5.2% -9.7% -31.5% 37.76
    DLF Ltd 756.25 N/A -3.1% -7.7% -11.4% N/A
    Macrotech Developers N/A N/A -5.4% -4.3% -2.3% N/A
    Oberoi Realty N/A N/A -2.9% -3.3% -6.3% N/A

    This snapshot reveals Godrej’s premium valuation amid relative underperformance, with DLF showing superior bookings growth but similar short-term pressures from broader NIFTY India New Age Consumption index’s -2.4% weekly fall. Risks include overvaluation signals for Godrej, potentially capping upside unless FY26 deliveries accelerate, while DLF’s luxury focus offers downside protection via pre-sales. Investors should monitor quarterly updates on NSE for shifts in P/B ratios, currently 3.39 for Godrej against book value of Rs 17,302 crore. Retail participation has grown significantly as access to a reliable trading platform has become more widespread among individual investors tracking these real estate equities.

    Market Outlook

    Budget 2026’s emphasis on seven City Economic Regions with Rs 5,000 crore each over five years, alongside manufacturing incentives like Rs 40,000 crore for electronics and data centre tax holidays till 2047, positions tier-II/III cities as high-growth frontiers for residential, industrial, and logistics assets. High-speed rails linking Mumbai-Pune and freight corridors will elevate property values, unlocking REIT monetization of CPSE lands. For Indian investors, this implies 10-15% annualized returns in diversified realty portfolios, but watch RBI rate trajectories and INR volatility; key players like DLF and Godrej remain pivotal, with risks from supply gluts in metros offset by Mumbai real estate premiumization. Sanjeev Singh, MD SKJ Landbase, notes: “The next decade will belong to smaller cities… Developers who plan strategically today will capture long-term value.”

    Conclusion

    India’s real estate market, propelled by DLF’s booking surge, Godrej’s stake fortification, and policy-driven tier-II expansion, stands resilient against short-term index corrections, offering institutional investors a compelling risk-reward profile. With Mumbai and Gurugram anchoring luxury demand and Budget 2026 catalyzing broader urbanization, stakeholders must prioritize undervalued assets, track peer valuations, and hedge via SENSEX-aligned exposures. This convergence of corporate strength and structural reforms heralds a multi-year upcycle, demanding vigilant monitoring of Q4 festive sales and RBI cues for optimal positioning.

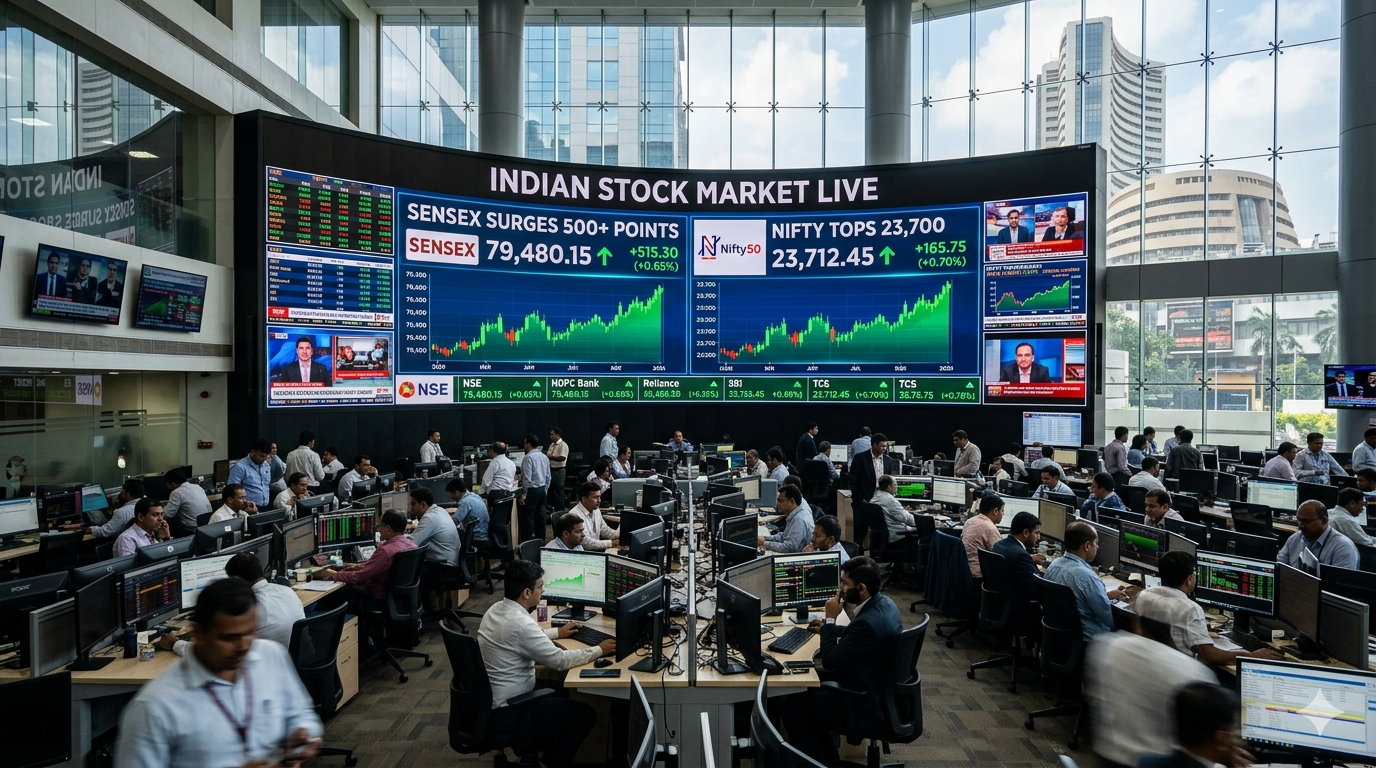
  • Indian Stock Market Live: Sensex Surges 500 Points, Nifty Tops 23,700

    Indian Stock Market Live: Sensex Surges 500 Points, Nifty Tops 23,700

    Indian equity benchmarks extended their bullish momentum on March 18, 2026, with the BSE Sensex climbing 567 points or 0.75% to close at 76,070.84 on the prior session, while the NSE Nifty advanced 172.35 points or 0.74% to 23,581.15, setting the stage for further gains in early trade. Intraday updates showed the Sensex rising an additional 437 points to 76,522.27 and Nifty breaching 23,700 with a 0.6% uptick to 23,715, driven by IT and auto sectors amid positive global cues from Wall Street and Asian markets. Broader participation from midcap and smallcap indices underscored resilient domestic sentiment, even as FII selling persisted, offset by DII buying. Investors remain focused on Federal Reserve cues and geopolitical tensions influencing oil prices.

    Key Highlights

    • BSE Sensex opened with a 296.71-point or 0.39% gain at 76,367.55; Nifty up 51.75 points at 23,632.90 in early trade.
    • Nifty IT led sectoral gains, followed by Nifty Auto and Bank; Nifty Metal dipped 0.5%.
    • Nifty Smallcap 100 rose 1% to 16,063.45; Nifty Midcap 100 up 0.9% to 55,689.95.
    • Top Sensex gainers: Eternel (+5.70%), Tata, Mahindra & Mahindra, Larsen & Toubro, Bharti Airtel, Maruti; laggards included Reliance, Bajaj, TCS, HCL.
    • Varun Beverages’ subsidiary acquires Crickley Dairy for Rs 131.47 crore; Morgan Stanley maintains Overweight on Reliance Industries with Rs 1,803 target.

    Nifty 50 and Sensex Performance Analysis

    The BSE Sensex, comprising 30 blue-chip stocks, demonstrated robust intraday strength on March 17, reaching a peak of 76,304.26, up 801.41 points or 1.06%, before settling at 76,070.84. This marked a second consecutive session of gains, reflecting renewed investor confidence despite ongoing FII outflows of Rs 4,741 crore on March 13, partially countered by DII purchases of Rs 5,225 crore. Early March 18 pre-open indications pointed to a favorable start, with Gifty Nifty up 0.5% and Sensex gaining nearly 300 points by 9:10 AM IST. By 9:23 AM, the index had advanced to 76,522.27, up 437 points, signaling sustained buying interest.

    The NSE Nifty 50 mirrored this trajectory, opening at 23,632.90 with a 51.75-point or 0.22% rise and quickly surpassing 23,700 to trade at 23,715, a 0.6% increase from the previous close. Market breadth favored advances, with 2,103 stocks rising against 377 decliners on NSE in early trade. This technical outlook aligns with positive global handoffs, including Wall Street’s higher close led by travel stocks and Asian rallies like Nikkei 225’s 2.32% surge. Investors looking to participate in this market movement can open demat account through SEBI-registered brokers.

    Shrikant Chouhan, Head of Equity Research at Kotak Securities, highlighted key support levels at 23,300-23,350 for Nifty and 75,300-75,500 for Sensex, suggesting potential upside to 23,800/76,500 if breached, but caution below these thresholds toward 23,000/75,000. Pre-market Gifty Nifty at 23,646 levels further reinforced expectations of a green opening, buoyed by paused oil price gains despite US-Israel-Iran tensions. BSE market capitalization stood at Rs 4,33,30,600.61 crore at Tuesday’s close, underscoring the market’s trillion-dollar scale.

    Sectoral Trends and Key Stock Movements

    Sectoral performance revealed a broad-based rally, with Nifty IT spearheading gains, trailed by Nifty Auto and Bank indices, while Nifty Metal lagged with a 0.5% decline. Smallcap and midcap segments outperformed, with Nifty Smallcap 100 up 1% to 16,063.45 and Nifty Midcap 100 gaining 0.9% to 55,689.95, indicating depth beyond large-caps. Standouts among Sensex constituents included Eternel, which led gainers with a 5.70% surge, alongside Tata Motors, Mahindra & Mahindra, Larsen & Toubro, Bharti Airtel, and Maruti Suzuki. Underperformers comprised Reliance Industries, Bajaj group stocks, Tata Consultancy Services (TCS), and HCL Technologies, reflecting selective rotation.

    Corporate developments added tailwinds: Varun Beverages’ South African arm, Bevco, announced the acquisition of Crickley Dairy Proprietary for Rs 131.47 crore, potentially boosting its beverages portfolio. Reliance Industries secured a landmark USD 3 billion, 15-year green ammonia supply deal with Samsung C&T, advancing new energy monetization; Morgan Stanley retained an Overweight rating with a Rs 1,803 share price target. In contrast, IDBI Bank shares plunged nearly 35% from recent highs of Rs 118.5, shedding 20% in two sessions and nearing its 52-week low of Rs 72.04, prompting concerns among account-holders though no systemic issues were flagged.

    These movements occurred against a backdrop of global caution, with the Federal Reserve’s two-day meeting underway amid elevated oil prices and Middle East geopolitical risks. Asian peers like Japan’s Nikkei 225 jumped 2.32% to 54,945, while Hang Seng dipped marginally. Retail participation has grown significantly as access to a reliable trading platform has become more widespread.

    Broader Market and Institutional Flows

    • FIIs sold Rs 4,741 crore on March 13, extending outflows, but DIIs absorbed with Rs 5,225 crore buys, stabilizing sentiment.
    • BSE Midcap Select Index +0.40% (60.91 points); BSE Smallcap Select +0.24% (17.57 points) to 7,250.15.
    • Market breadth: 2,103 advancers vs 377 decliners on NSE; 67 unchanged.
    • Gifty Nifty opened flat at 23,579 (-3 points) but recovered to +0.5% by 9:06 AM, signaling positive start.
    • US markets: S&P 500 +0.25%, Dow +0.10%; Asia mixed with Kospi gains.

    This table illustrates comparative performance:

    Index Previous Close Early Gain (%) Current Level
    BSE Sensex 76,070.84 +0.39% 76,367.55
    NSE Nifty 50 23,581.15 +0.22% 23,632.90
    Nifty Smallcap 100 – +1.00% 16,063.45
    Nifty Midcap 100 – +0.90% 55,689.95

    Risks include FII selling pressure and oil volatility; key players to watch include IT heavyweights, auto majors, and Reliance.

    Market Outlook

    Looking ahead, Indian investors should monitor Federal Reserve outcomes for rate cut signals, alongside oil price trajectories amid Middle East tensions, which could amplify volatility in metal and energy sectors. Technical supports at 23,300 (Nifty)/75,300 (Sensex) remain critical; sustained breaks above 23,800 could target 24,000, per Kotak’s Chouhan. DII resilience offers a buffer against FII exits, but prolonged geopolitical risks may cap upside. This development presents new considerations for stock investment strategies focused on Indian equities. Institutional investors are advised to favor IT and auto for rotational plays, while hedging IDBI-like outliers. Broader INR stability and RBI liquidity measures will be pivotal; watch Reliance’s green energy pivot for long-term themes.

    Conclusion

    Indian stocks affirmed upward momentum on March 18, 2026, with Sensex and Nifty leading a broad rally fueled by sectoral leaders and corporate catalysts like Reliance’s green deal, despite pockets of weakness in banking and metals. Positive breadth, DII support, and global positivity position the market for potential extension toward 24,000/77,000, though supports must hold amid external risks. For decision-stage investors, prioritize risk-management while tracking Federal Reserve developments and geopolitical factors that could influence near-term market direction.

  • PNGS Reva Diamond Jewelry IPO 2026: Issue Details, Price Band, GMP & Review

    PNGS Reva Diamond Jewelry IPO 2026: Issue Details, Price Band, GMP & Review

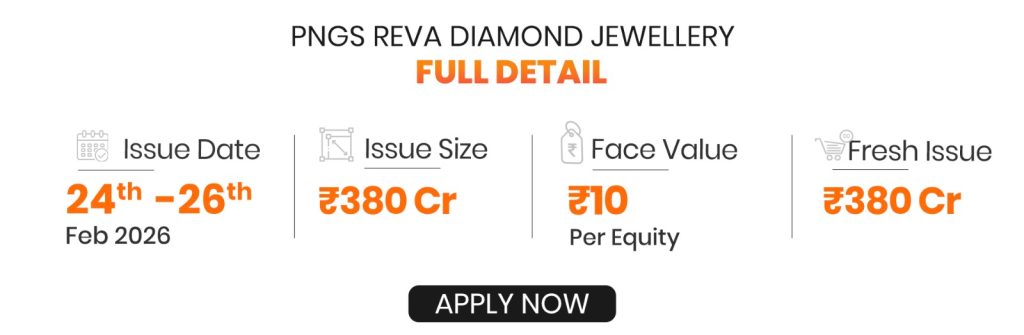
    PNGS Reva Diamond IPO price has caught most investors’ attention as the company wants to raise ₹380 crore through a fresh issue. The funds will support expansion plans and marketing initiatives. This affordable diamond jewelry brand, backed by the P.N. Gadgil & Sons, has shown remarkable performance. The company boasts a PAT margin of 30.84% and an exceptional ROE of 78.89%.

    Investors should know several key details about the PNGS Reva Diamond IPO. The IPO subscription starts on February 24 and ends on February 26. The allotment finalization will happen on February 27, followed by listing on March 3. While not comparable to a Revain IPO in Nasdaq, this RNG IPO price presents a good chance in India’s jewelry market.

    PNGS Reva’s smart market strategy offers pure diamond pieces starting at just ₹10,000, making luxury available to more customers. The company’s plans include launching its Reva collection before Valentine’s Day in 2025 to tap into festive sales. The gray market premium (GMP) will be a significant indicator for investors. A positive GMP hints at potential listing gains, while a negative one could mean listing at a discount.

    Investors tracking post-listing performance can monitor the PNGS Reva Diamond Share Price for real-time updates and valuation movement after listing.

    What makes PNGS Reva Diamond IPO stand out in 2026? The PNGS Reva Diamond IPO stands out in the busy 2026 market with its unique strategic position and strong brand heritage. The diamond-focused brand launched in February 2025 shows a calculated entry into India’s growing affordable luxury jewelry segment.

    Affordable luxury positioning makes Reva’s market strategy distinctive. You can buy pure diamond pieces starting at just ₹10,000, which opens doors for first-time diamond buyers and positions the brand strongly within India’s evolving premium jewelry segment.

    Also Read: What is IPO?

    What Makes PNGS Reva Diamond IPO Stand Out in 2026?

    The PNGS Reva Diamond IPO stands out in the busy 2026 market with its unique strategic position and strong brand heritage. The diamond-focused brand launched in February 2025 shows a calculated entry into India’s growing affordable luxury jewelry segment.

    Investors who wish to participate in this public issue during the subscription window can review the offer details and proceed with their application below.

    Affordable Luxury Positioning

    Reva’s market strategy makes diamond jewelry available to more customers through smart pricing. You can buy pure diamond pieces starting at just ₹10,000, which opens doors for first-time diamond buyers. This pricing lets Reva reach customers who thought diamond jewelry was too expensive.

    The brand smartly markets itself as “affordable luxury” instead of just “affordable jewelry” to keep its premium image despite lower prices. Their products cover various categories like diamond rings, earrings, bracelets, sets, and necklace sets. The brand also lets customers customize pieces to match their style priorities.

    The timing of marketing campaigns has been vital to Reva’s position. The brand launched its collection right before Valentine’s Day 2025 to boost gift purchases. They offered zero making charges during the launch to attract new customers. These seasonal offers show how well Reva understands when people buy jewelry.

    This smart pricing and promotion strategy helps Reva target customers who want branded jewelry without high prices. A gross profit margin of 26.67% shows this affordable luxury approach works financially.

    Backed by Trusted Brand P.N. Gadgil & Sons

    The most important advantage for the PNGS Reva Diamond IPO is its connection to P.N. Gadgil & Sons, a jewelry institution trusted by customers for over 190 years. This rich heritage gives Reva instant credibility in a market where trust drives purchases.

    P.N. Gadgil & Sons transferred its diamond business to PNGS Reva Diamond Jewelry through a strategic slump sale in January 2025. This move lets Reva work independently while using its parent company’s brand value and strong operations. The P.N. Gadgil & Sons connection helps build customer loyalty, improve supply chains, and grow faster.

    This partnership goes beyond branding into retail presence. PNGS Reva Diamond Jewelry runs 34 stores in Maharashtra, Karnataka, and Gujarat. All but one of these stores operate inside existing P.N. Gadgil & Sons locations. This setup gives Reva retail presence without spending heavily on new stores.

    The company uses multiple operational models:

    • Company Owned Company Operated (COCO)
    • Franchise Owned Company Operated (FOCO)
    • Franchise Owned Franchise Operated (FOFO)

    This flexible approach helps quick expansion while you retain control over the brand. The company knows how to operate in cities of all sizes in its main markets, which builds efficiency and community trust.

    The PNGS Reva Diamond IPO offers more than just another jewelry market investment. Investors get a chance to back a brand with smart pricing and support from a 190-year jewelry legacy, something rare in today’s Indian retail world.

    Read in Details: How to Meet the IPO Eligibility Criteria?

    How does the Reva Brand Plan to Disrupt the Diamond Market?

    PNGS Reva Diamond Jewelry has created a fresh approach to challenge India’s traditional diamond market. The brand launched in February 2025 to capture market share by solving the biggest problems and meeting needs in the premium jewelry segment.

    Modern Designs at ₹10,000+ Price Points

    Reva has positioned itself in the affordable luxury segment by offering pure diamond jewelry starting at just ₹10,000. This pricing makes diamond jewelry accessible to more people who thought diamonds were out of their reach.

    The company showcases a wide collection with contemporary designs that appeal to urban and millennial consumers. Their products include:

    • Rings and earrings
    • Necklaces and pendants
    • Solitaires
    • Bangles and bracelets
    • Mangalsutra and nose rings
    • Chains

    The brand has created 13 unique jewelry collections as of September 2025. In-house design teams work with carefully selected third-party manufacturers and artisans to develop these collections. Each piece blends tradition with modern elements while staying elegant and authentic.

    Zero Making Charges and Festive Targeting

    Reva made a bold move by introducing zero making charges during its launch. This strategy tackles one of the major costs in traditional jewelry pricing that adds substantial markup to final prices and often confuses buyers.

    The brand’s launch just before Valentine’s Day 2025 came with waived making charges until February 16, 2025. This smart timing shows Reva understands how gift-buying occasions bring new customers to diamond jewelry.

    The company’s marketing goes beyond Valentine’s Day to target wedding seasons and festivals when jewelry sales peak in India. This seasonal approach helps build brand awareness during high-interest periods.

    These promotions help first-time diamond buyers overcome their hesitation by reducing both cost and psychological barriers. Customers can also customize pieces across collections to match their priorities.

    Tier-1 and Tier-2 City Expansion

    The company will use ₹286.56 crore from IPO proceeds to open 15 new brand-exclusive stores. This growth plan targets Tier-1 cities while learning about opportunities in Tier-2 locations across Maharashtra and other metro cities in India.

    Early 2026 data shows PNGS Reva Diamond Jewelry runs 34 stores across Maharashtra, Karnataka, and Gujarat. All but one of these stores are shop-in-shop formats within P.N. Gadgil & Sons retail stores. The exception operates under the Company Owned Company Operated (COCO) model.

    The company’s knowledge of Tier-1, Tier-2, and Tier-3 cities helps improve operational efficiency. This focused presence allows better logistics, inventory management, and store operations. The expansion strategy utilizes this regional expertise while entering new promising markets.

    The company plans to spend ₹35.40 crore from IPO proceeds on marketing for these new stores. This investment will improve local brand awareness and help Reva connect with communities as it grows.

    Reva combines asset-light shop-in-shop models (FOCO/FOFO) with strategic standalone stores to grow faster while maintaining consistent brand experience. This balanced growth strategy helps the company benefit from India’s jewelry retail consolidation trends.

    Why is the ₹380 Cr IPO being Launched Now?

    PNGS Reva Diamond’s ₹380 crore IPO comes at a perfect time in India’s jewelry market. The public offering starts February 24 and runs through February 26, 2026. This move aims to raise capital with clear goals in mind.

    Timing with Wedding and Festive Season

    The company picked the perfect moment for its IPO during India’s peak jewelry buying season. PNGS Reva launched its diamond collection right before Valentine’s Day 2025. This smart move built brand awareness before going public. Their timing shows they understand when people buy gifts.

    Their H1 FY26 revenue hit ₹157 crore thanks to strong festive and wedding season sales. These numbers prove the brand knows how to tap into seasonal buying spikes across India.

    PNGS Reva’s IPO fits perfectly with their business plan of targeting special occasions. They launched their collection before Valentine’s Day and offered zero making charges. This strategy shows they know when customers are most likely to buy. The IPO follows this same smart thinking – launch when market interest peaks.

    The anchor book opens February 23, letting big investors get in just as retail interest builds. This timing helps grab attention when jewelry sales typically surge.

    Capitalizing on Premiumisation Trend in Jewelry

    The ₹380 crore from this IPO will go toward riding the premium wave in India’s jewelry market:

    • ₹286.56 crore (75.4%) to open 15 brand-exclusive stores
    • ₹35.40 crore (9.3%) for marketing campaigns
    • The rest for general business needs

    This split shows PNGS Reva sees how customer priorities are changing. The jewelry market keeps growing as pieces become everyday wear rather than special occasion items. Simple chains, rings, and bracelets are now daily fashion must-haves that create year-round sales.

    The best reason for this IPO’s timing links to market growth factors. Higher incomes, city growth, and more spending have created the perfect setting for premium jewelry brands. The organized diamond jewelry market looks set to grow 16-17% yearly.

    Diamond jewelry offers the best growth potential in the premium segment. PNGS Reva sells pure diamond pieces starting at ₹10,000 with modern designs. This puts them in a great spot to benefit from market changes.

    The IPO structure tells us more about their funding approach: 75% for qualified institutional buyers, 15% for non-institutional investors, and 10% for retail investors. This setup focuses on getting long-term institutional money to support their growth plans.

    Their expansion targets Tier-1 cities first, while carefully picking Tier-2 spots in Maharashtra and other metro areas across India. These locations match areas where premium jewelry sales are growing fastest.

    PNGS Reva’s IPO combines short-term seasonal opportunities with long-term market trends. By raising money now, they can capture both festival sales and the bigger shift toward premium jewelry in India.

    Read Also: Things You Should Know Before Investing in IPO

    How Strong is PNGS Reva’s Financial Foundation?

    Financial performance drives any IPO investment case. PNGS Reva’s numbers tell a compelling story of strategic growth and operational efficiency that supports the PNGS Reva Diamond IPO price.

    Revenue and PAT Growth over 3 Years

    PNGS Reva Diamond Jewelry’s financial journey shows steady progress over recent fiscal periods. The company started as an offshoot of the P.N. Gadgil & Sons brand and showed remarkable financial progress after focusing solely on diamond jewelry.

    Revenue reached ₹157 crore in H1 FY26, which shows strong growth momentum before its public offering. These numbers stand out, especially given the economic climate affecting consumer spending.

    The company’s operational efficiency shines through its Profit After Tax (PAT) figures, with a 30.84% PAT margin – an exceptional number in retail jewelry. This profitability puts PNGS Reva ahead of its peers and gives investors confidence in its business model.

    Strong revenue growth matches the company’s push into new markets and its focus on affordable luxury. Unlike typical png ipo reviews, PNGS Reva’s story centers on making profit while keeping prices available to customers.

    Net Worth Turnaround Post Slump Sale

    January 2025 marked a turning point in PNGS Reva’s progress when P.N. Gadgil & Sons sold its diamond business to PNGS Reva Diamond Jewelry through a strategic slump sale. This move reshaped the company’s balance sheet and business focus.

    The sale let PNGS Reva run independently while keeping its parent company’s brand value and infrastructure. This showed up as a big boost in the company’s net worth, creating a stronger base for future growth.

    Smart timing of this deal just before the Valentine’s Day 2025 collection launch helped PNGS Reva tap into seasonal sales with better financial structure. Investors comparing this to a Revain IPO in nasdaq should note that PNGS Reva’s financial moves target the Indian jewelry market rather than tech sector.

    After restructuring, the company’s capital efficiency improved significantly. Return on Net Worth (RoNW) hit 78.89%, showing how well the company uses shareholder money to generate returns.

    EBITDA and Margin Trends

    PNGS Reva’s EBITDA numbers prove its operational strength. A 26.67% gross profit margin shows healthy product-level profits while maintaining affordable luxury status.

    The margin structure reveals several advantages:

    • Shop-in-shop model cuts overhead costs (33 of 34 stores)
    • Smart inventory management in focused areas
    • Targeted seasonal marketing keeps costs down
    • Working efficiently with parent company P.N. Gadgil & Sons

    These advantages help maintain margins despite price competition in diamond jewelry. The rng ipo price depends on many factors, but EBITDA trends point to a business model that stays profitable in different market conditions.

    The company plans to use ₹286.56 crore from IPO funds to open 15 brand-exclusive stores, aiming to boost margins through bigger retail presence and brand control. Another ₹35.40 crore will go to marketing, balancing growth with profit protection.

    PNGS Reva’s financial foundation rests on strong fundamentals – high profitability, smart capital use, and healthy margins. IPO investors can clearly see how operational performance backs the company’s value and growth plans.

    What do Valuation Metrics Reveal about Investment Potential?

    Understanding valuation metrics gives us vital insights into the PNGS Reva diamond IPO price and its investment potential. A detailed analysis of key financial ratios shows how the company matches up against other players in the Indian jewelry market.

    RoNW and EPS vs Peers

    PNGS Reva Diamond Jewelry’s valuation analysis shows remarkable efficiency metrics compared to industry peers. The company has an impressive Return on Net Worth (RoNW) of 59.36%, which is nowhere near what its competitors achieve. This exceptional capital efficiency is way ahead of Thangamayil Jewelry (24.99%), Tribhovandas Bhimji Zaveri (9.05%), and Senco Gold (13.26%).

    Earnings Per Share (EPS) is a vital indicator of profitability. PNGS Reva has a Basic and Diluted EPS of ₹35.21, making it second only to Thangamayil’s ₹44.91 among its peers. This metric alone doesn’t paint the complete picture without looking at corresponding valuation multiples.

    The company shows superior operational efficiency with Return on Equity (ROE) at 59.4% and Return on Capital Employed (ROCE) at 80.5%. These numbers prove its better asset utilization and operational effectiveness compared to industry standards.

    We can’t make direct valuation comparisons since PNGS Reva doesn’t have a defined Price-to-Earnings (P/E) ratio yet. All the same, peer P/E ratios—Senco Gold (14.48×), TBZ (23.58×), and Thangamayil (41.24×)—help establish a potential valuation framework.

    NAV and Debt-equity Ratio

    Net Asset Value (NAV) gives us fundamental insight into book value per share. Different sources show conflicting data. One reliable source states PNGS Reva’s NAV at ₹45.82 per share, while another shows ₹206.19. The ₹45.82 figure seems more accurate based on source reliability.

    Peer companies have much higher NAVs: Thangamayil (₹179.74), Senco Gold (₹175.74), and TBZ (₹90.14). PNGS Reva’s lower NAV could mean either growth potential or overvaluation, depending on future performance.

    The company has a healthy debt-equity ratio of 0.37, which shows financial prudence and a strong balance sheet. This conservative leverage position means there’s room to expand without too much financial burden. A PAT margin of 23.04% and EBITDA margin of 41.81% further prove its operational strength.

    Comparison with Senco Gold, TBZ, Thangamayil

    A detailed peer analysis reveals PNGS Reva’s competitive position:

    This comparison clarifies several investment points. PNGS Reva gets better returns on invested capital, as shown by its industry-leading RoNW. Its revenue base is much smaller than other players, which suggests significant room to grow if execution works out.

    The company’s financial profile stands out from typical jewelry retailers. Thangamayil has slightly higher EPS but needs nearly 15× PNGS Reva’s revenue to achieve it. This efficiency shows PNGS Reva’s streamlined business model and capital-light approach.

    The PNG IPO review through valuation metrics shows a company with exceptional profitability ratios but relatively small scale. Investors might see substantial returns if the company executes its expansion strategy well, quite different from a Revain IPO in Nasdaq that focuses more on technology metrics than financial efficiency.

    What are the Risks Investors should Consider?

    Investors looking at the PNGS Reva Diamond IPO price should carefully consider several key risks that could affect its future performance. The attractive valuations tell only part of the story – there are important challenges that need a closer look.

    Execution Risk in Store Rollout

    The life-blood of PNGS Reva’s growth strategy lies in setting up 15 brand-exclusive stores to boost its market position and revenue. This ambitious expansion comes with substantial risks. The company might face higher costs and delays as it enters the highly competitive retail jewelry sector. PNGS Reva, just a few months old (since December 2024), still needs to build its brand identity and depends heavily on its parent promoter group’s systems and operations.

    The company’s current scale remains small with revenue of about ₹258 crore compared to older players in the industry. Sales and brand relevance could take a hit if new designs don’t line up with changing customer priorities. Poor inventory management or supply delays could lead to either empty shelves or excess stock, which would hurt operational efficiency.

    Geographic Concentration in Maharashtra

    The biggest problem in the PNG IPO analysis comes from PNGS Reva’s heavy focus on one region. Maharashtra accounts for 97% of FY25 revenue, making the company vulnerable to regional disruptions. Even more worrying, just five stores generate 44% of total revenue.

    The company runs stores in Maharashtra, Gujarat, and Karnataka, but this limited presence leaves it exposed to local economic downturns. Plans to expand mainly in Maharashtra will likely increase this concentration. Unlike a Revain IPO on NASDAQ that could reach global markets, PNGS Reva’s geographic limits might restrict its growth potential.

    Volatility in Gold/Diamond Prices

    The RNG IPO price faces substantial commodity risks. Raw materials make up 65-70% of total costs, so profits are nowhere near stable when gold and diamond prices fluctuate. The typically thin margins in jewelry retail make this worse.

    Lab-grown diamonds are becoming popular and could threaten natural diamond demand, which might affect pricing, margins, and long-term growth. The industry also faces stricter rules like hallmarking and traceability requirements, adding pressure in a market where 58% remains unorganized.

    Seasonal sales patterns add another risk factor. Any drop in sales during key festive or wedding seasons could substantially impact yearly financial results.

    What is the Latest GMP and Market Sentiment?

    Market participants are keeping a close eye on PNGS Reva Diamond Jewelry IPO’s Gray Market Premium (GMP) before its subscription period. The IPO will open on February 24 and close on February 26, 2026. Unofficial trading circles have already shown interest ahead of the launch.

    Gray Market Premium (GMP) Trends

    Latest unofficial reports show PNGS Reva Diamond IPO GMP at around ₹10 per share. Early market participants seem optimistic about the listing potential, as shown by this positive premium. The GMP acts as an unofficial indicator of investor interest before official subscriptions start.

    The current premium shows gray market activity before the actual listing. Market demand and sentiment can make the GMP fluctuate a lot. These early figures might change by a lot as we get closer to the IPO dates.

    The PNGS reva diamond ipo price and GMP trends don’t guarantee listing performance. Final subscription numbers across investor categories will determine the actual listing gains.

    Subscription Status Updates

    Daily updates on PNGS Reva Diamond’s subscription status will start once bidding opens on February 24. The IPO has specific allocation quotas for different investor groups:

    • Qualified Institutional Buyers (QIB): Financial institutions, banks, FIIs, and mutual funds
    • Non-Institutional Investors (NII): Individual investors, NRIs, companies, and trusts
    • Retail Individual Investors (RII): Regular retail investors

    This mainboard IPO will list on both BSE and NSE, unlike a Revain IPO in Nasdaq. Investors can track up-to-the-minute bidding information through designated platforms once subscription begins.

    The IPO allotment will be finalized on Friday, February 27, 2026. Investors should receive their credited shares by March 2, 2026. The company plans to list on Wednesday, March 4, 2026.

    Retail and HNI Interest Levels

    Subscription numbers will reveal interest levels across investor categories. Png ipo reviews suggest investors should look at QIB, NII, and retail subscription numbers before making their decision.

    The rng ipo price tends to relate to institutional interest during the subscription period. Subscription trends often show dramatic improvements on the final day compared to the original responses.

    GMP tracking and subscription status help predict potential listing performance. Financial experts suggest looking at this IPO as a long-term investment rather than focusing only on listing gains.

    How can Investors Apply and Track Allotment?

    PNGS Reva Diamond IPO welcomes prospective investors through multiple digital platforms. The subscription window starts February 24 and ends February 26, 2026. Investors must have an active demat account to apply, and those without one can open demat account online to participate in the IPO through these platforms.

    Application Process via UPI/ASBA

    Investors have two payment options – UPI or ASBA. Here’s how you can apply online:

    1. Access your broker account or bank’s net banking portal
    2. Find the IPO section and select PNGS Reva Diamond Jewelry
    3. Fill in your bid details and UPI ID
    4. Submit your application form
    5. Confirm the mandate request on your UPI app

    The bank ASBA facility remains available until 5 PM on February 26, 2026, and provides another application route.

    Lot Size and Retail Limits

    Official channels will soon announce the exact lot size details. Retail investors typically get to apply between one and 13 lots. Your total application amount depends on the final PNGS Reva Diamond IPO price multiplied by the chosen lot size.

    Allotment Date and Refund Process

    The IPO allotment results will be ready by February 27, 2026. Successful applicants will receive their shares in their demat accounts by March 2, while unsuccessful applicants will get their refunds processed the same day.

    You can check your IPO allotment status through these three options:

    • Bigshare Services (the registrar) website using your application details
    • BSE website with your application number or PAN
    • NSE website using your application number or PAN

    The refund process starts March 2, 2026, and shares will list on the exchange between March 3-4, 2026.

    Conclusion

    PNGS Reva Diamond Jewelry IPO gives investors a fresh way to enter the Indian jewelry market. The company stands out by offering affordable luxury with pure diamond pieces starting at just ₹10,000. Their numbers tell an impressive story – a PAT margin of 30.84% and ROE of 78.89% show how well they run their business.

    The brand draws strength from its 190-year connection with P.N. Gadgil & Sons, which gives it a clear edge in the market. PNGS Reva’s blend of trusted heritage and modern designs creates a bridge between old values and new styles. While their shop-in-shop model works well now, they want to open 15 brand-exclusive stores using IPO funds.

    Smart investors should think over some risk factors before jumping in. The biggest problem is geographic concentration – 97% of revenue comes from Maharashtra. The planned store expansion could face hurdles that might slow growth. Raw materials make up 65-70% of total costs, so changes in gold and diamond prices could affect profit margins.

    The market seems cautiously positive with a Gray Market Premium of about ₹10 per share. Investors will watch the allotment date of February 27, 2026, and listing on March 3-4 closely. Those who get shares will see them in their accounts by March 2.

    PNGS Reva Diamond Jewelry makes a strong but complex investment case. The company’s solid finances and market position point to good growth ahead. Yet wise investors will balance these chances against the risks. Anyone thinking of investing should assess their risk comfort and time horizon rather than just focusing on listing gains. This IPO shows how traditional jewelry businesses can adapt to changing customer priorities while staying profitable in a competitive market.

    Frequently Asked Questions

    PNGS Reva offers affordable luxury diamond jewelry starting at ₹10,000, backed by the 190-year legacy of P.N. Gadgil & Sons. Their strategic positioning and strong financial metrics, including a 30.84% PAT margin and 78.89% ROE, set them apart in the competitive jewelry market.

    The company plans to use ₹286.56 crore from the ₹380 crore IPO to establish 15 new brand-exclusive stores. Additionally, ₹35.40 crore will be allocated for marketing and promotional activities, with the remaining funds used for general corporate purposes.

    Major risks include execution challenges in the planned store rollout, high geographic concentration with 97% of revenue from Maharashtra, and potential volatility in gold and diamond prices affecting profit margins.

    Investors can apply through UPI or ASBA methods via their broker accounts or bank’s net banking portals. The subscription window is from February 24 to February 26, 2026, with a cutoff time of 5 PM on the closing date.

    The tentative listing date for PNGS Reva Diamond Jewelry shares is set for Wednesday, March 4, 2026, on both BSE and NSE. Allotment finalization is scheduled for February 27, with share credits expected by March 2, 2026.

    Disclaimer: This blog is intended solely for educational and informational purposes and should not be construed as investment advice or a recommendation. While efforts have been made to ensure the accuracy and reliability of the information and data presented, no representation or warranty, express or implied, is made regarding its completeness or correctness. Readers are advised to independently verify all information and consult a qualified financial advisor before making any investment decisions. Investments in the securities market are subject to market risks. Please read all relevant offer documents and disclosures carefully before investing.,