findocblog

Blog

  • Nifty 50 Crashes 2% as Sensex Sinks on Trump Speech

    Nifty 50 Crashes 2% as Sensex Sinks on Trump Speech

    Indian equities opened sharply lower on Thursday, with the Nifty 50 tumbling over 2% and the BSE Sensex plunging more than 1,300 points in early trade, erasing the previous session’s relief rally. The downturn was triggered by US President Donald Trump’s address signaling prolonged Middle East conflict, including “extremely hard hits” on Iran expected within weeks, which spiked crude oil prices and soured global sentiment. GIFT Nifty futures had already indicated a grim start, down over 1.9% or 439 points at 22,361 before the opening bell. By mid-morning, the Nifty 50 stood at 22,255, a drop of 424 points or 1.87%, while the Sensex shed 1,400 points, pushing below 72,000. Banking and pharmaceutical stocks led the bleed, reflecting heightened geopolitical risks and FII short positions at 84% in index futures.

    Key Highlights

    • Nifty 50 opens down 1.31% to 1.87%, settling around 22,255; Sensex falls 1.19% to over 1,400 points or 2%.
    • GIFT Nifty futures signal gap-down of over 400 points amid crude oil surge post-Trump’s Iran war remarks.
    • Key supports at 22,200-22,300 for Nifty; breach could target 22,000; resistance at 22,500-22,700.
    • FII index futures short ratio at 84%, PCR dips to 0.83; high OI at 23,500 CE and 22,000 PE.
    • Sectors under pressure: Banking, IT, pharma; previous close saw Nifty rally 348 points or 1.56% to 22,679.

    Nifty 50 Sensex Plunge on Geopolitical Tensions

    The benchmark indices’ sharp reversal came after a two-day losing streak was snapped on Wednesday, when the Nifty 50 closed 348 points or 1.56% higher at 22,679, buoyed by fleeting optimism over US-Iran talks. However, pre-open signals from GIFT Nifty futures painted a bearish picture, falling over 1% early Thursday following Trump’s speech that dashed hopes of a swift Middle East resolution. By 9:35 am, the Nifty 50 had plunged to 22,255, a 1.87% decline, while the Sensex mirrored the pain, sinking over 1,300 points from its prior peak rally of 2,017 points or 2.80% to 73,964 in the previous session.

    Technical indicators underscored the vulnerability. On hourly charts, the Nifty failed to sustain above the 20 and 50 EMA levels despite Wednesday’s intraday bounce from over 450 points up. The index now trades below key moving averages, with RSI at 46 signaling mildly bullish but fragile momentum, and ADX at 28.4 confirming a trending downmove. Put-call ratio (PCR) slipped to 0.83 from 0.99, alongside elevated open interest at 44 lakh contracts for the 23,000 call strike, pointing to resistance buildup. Implied trading range narrowed to 22,100-23,400, with intraday tone sideways to bearish.

    Foreign institutional investors (FIIs) amplified the pressure, with index futures short ratio at 84%, down slightly from 85% but still indicative of aggressive positioning. This development presents new considerations for stock investment strategies focused on Indian equities amid volatile market conditions. Domestic flows provided limited cushion, as the rally added Rs 9.60 lakh crore in market capitalization on Wednesday before the wipeout.

    Sectoral Bloodbath and Key Stock Movers

    Banking and pharmaceutical sectors bore the brunt, with heavyweights dragging the indices lower amid global risk-off sentiment. Bank Nifty faced renewed selling after failing to extend gains, likely remaining under pressure as per pre-market cues. IT stocks, sensitive to geopolitical escalations impacting trade, also weakened, while pharma bled on broader equity outflows. Standout decliners included names in financials and healthcare, though specific company data highlighted broader market capitulation.

    Market breadth deteriorated rapidly post-open, with advance-decline ratio skewing heavily negative. Retail participation has grown significantly as access to a reliable trading platform has become more widespread, though current volatility tests investor conviction. Crude oil’s spike post-Trump’s address exacerbated concerns for oil-sensitive sectors like aviation and logistics, potentially pressuring stocks such as IndiGo and Tata Power, which were flagged in intraday watches. The BSE’s broader midcap and smallcap indices likely followed suit, though bluechips like those in Nifty 50 dominated the downside.

    Rupee dynamics added to the equation, with INR expected to weaken against the USD amid safe-haven flows, indirectly supporting RBI’s vigilance on currency stability. No immediate policy signals from the central bank emerged, but elevated volatility could prompt liquidity measures if the selloff persists. FII selling in cash and derivatives segments intensified the 1.31% Nifty drop at open, per opening bell data.

    Critical Support Resistance Levels

    Index Support Levels Resistance Levels Key Observations
    Nifty 50 22,200-22,300; Strong at 22,000-22,100 22,500, 22,700, then 23,000-23,300 Bullish only above 23,300 for recovery to 23,850
    Sensex 71,500-72,000 72,500-73,000 OI resistance at higher strikes
    Options Activity High OI at 22,000 PE OI concentration at 23,500 CE India VIX likely elevated post-gap down
    FII/DII Flows Shorts at 84% – Watch for DII buying at dips to stabilize sentiment

    Market Outlook

    Investors face elevated risks from sustained Middle East tensions, with crude volatility threatening inflation pass-through to India via higher import costs and RBI rate path disruptions. A decisive Nifty close below 22,300 could accelerate downside to 22,000, signaling momentum shift and prompting portfolio reallocations toward defensives like FMCG and utilities. Upside surprises hinge on Trump’s rhetoric softening or US-Iran de-escalation cues, potentially sparking short-covering above 22,700. Institutional players should monitor FII positioning and PCR for reversal signals, while retail traders prioritize risk management with stops at key supports. Investors looking to participate in this market movement can open demat account online through SEBI-registered brokers to access equity opportunities during volatile periods. Longer-term, dips below 22,000 may offer entry for quality largecaps, but near-term choppiness warrants caution amid global cues.

    Conclusion

    Thursday’s 2% Nifty rout and Sensex’s 1,400-point plunge encapsulate the fragility of Indian equities to exogenous shocks, underscoring the need for disciplined strategies amid geopolitical whirlwinds. While technical supports at 22,000-22,300 offer a floor, persistent FII shorts and crude pressures demand vigilance from institutional investors. Positioning for volatility through hedged plays and sector rotation will define alpha generation, as markets navigate this high-stakes endgame in global tensions.

    Explore More Market Insights
    Top Gainers Today Highs & Lows Today
    Top Losers Today Advances & Declines
    Penny Stocks Penny Stocks Under ₹1
    Penny Stocks Under ₹5 Penny Stocks Under ₹10
  • Indian Bank Stocks Surge 4% on Geopolitical Optimism

    Indian Bank Stocks Surge 4% on Geopolitical Optimism

    Indian banking stocks staged a robust recovery on Wednesday, with the Nifty Bank index surging nearly 3% to approach 51,600 levels, reversing the sharp selloff witnessed earlier in March. Major players like State Bank of India (SBI), ICICI Bank, HDFC Bank, and Axis Bank led the charge, posting gains of 2-4%, fueled by investor optimism over potential de-escalation in the US-Iran-Israel conflict. This rally aligned with broader market euphoria, as the Sensex climbed around 2,000 points and Nifty 50 crossed 22,900, reflecting hopes for macroeconomic stability amid global uncertainties. The Reserve Bank of India (RBI) also reported near-perfect efficiency in processing applications, underscoring operational resilience in the sector.

    Key Highlights

    • Nifty Bank index rallies nearly 3% to near 51,600 after March massacre
    • SBI, Axis Bank, PNB, Canara Bank gain 3-4%; ICICI Bank, HDFC Bank up 2%
    • Sensex surges 2,000 points; Nifty 50 tops 22,900 on US-Iran truce hopes
    • RBI clears 99.9% of 24,911 applications on time in March 2026
    • April 1, 2026 rule changes impact SBI Cards cashback, FASTag, PAN norms

    Bank Stocks Rally Amid Global Relief

    The banking sector‘s sharp uptick on Wednesday marked a pivotal shift from the volatility of prior weeks, driven primarily by geopolitical developments. US President Donald Trump’s statement that military actions against Iran could conclude within two to three weeks, without necessitating a prior deal, injected fresh confidence into global markets. Iranian President Masoud Pezeshkian echoed this sentiment, expressing the nation’s will to end hostilities with Israel and the US, provided guarantees against recurrence. This dual assurance alleviated fears of oil price spikes and supply chain disruptions, which had previously weighed on India’s import-dependent economy.

    Key beneficiaries included public and private sector lenders. Punjab National Bank (PNB), AU Small Finance Bank, IndusInd Bank, Canara Bank, and Axis Bank each advanced 3-4%, while State Bank of India (SBI) mirrored these gains. ICICI Bank and HDFC Bank, the heavyweights in the Nifty Bank index, rose around 2% apiece, contributing significantly to the index’s momentum. This broad-based participation signals renewed bullish sentiment, with trading volumes spiking as institutional investors repositioned for stability. The rally’s timing, post a 17% Nifty Bank drawdown in March, suggests bulls are regaining control, potentially setting the stage for sustained recovery if global tensions ease further.

    Analysts attribute this surge to India’s resilient fundamentals, including steady credit growth and controlled non-performing assets (NPAs). With the INR holding firm against the dollar amid these developments, banks face reduced forex risks, bolstering their balance sheets. Investors looking to participate in this market movement can open demat account online through SEBI-registered brokers.

    RBI Efficiency and Regulatory Updates Bolster Sector Confidence

    The Reserve Bank of India (RBI) demonstrated exemplary operational prowess in March 2026, processing 99.9% of 24,911 applications within stipulated timelines under its Citizen’s Charter. Starting with 3,195 pending cases and receiving 22,243 fresh ones, the central bank handled a net of 24,911 after referring 527 back for more details. Of these, 21,459 were cleared, with only 31 delayed—14 awaiting external inputs and three under process. At month-end, 3,452 cases remained pending, 99.5% within deadlines.

    Functionally, ‘Banker to Banks and Governments’ saw all 11,057 applications processed on time, while ‘Currency Management’ cleared 7,682 timely out of 7,683. ‘Foreign Exchange Management’ managed 1,306 on time versus 10 delays, and ‘Regulation and Supervision’ handled 465 timely against eight overruns. This near-flawless execution reassures stakeholders of RBI’s regulatory agility, critical for banking operations amid evolving challenges like digital payments and cross-border flows.

    Compounding this, April 1, 2026, introduced key rule changes affecting daily banking. SBI Card revisions to cashback structures aim to optimize rewards amid rising costs, while NHAI FASTag updates streamline toll collections. RuPay debit card lounge access expansions enhance customer perks, and PAN-related norms tighten compliance. Banks face 14 holidays in April, including Good Friday and Akshaya Tritiya, plus annual account closures, impacting transaction flows but offering operational pauses. Retail participation has grown significantly as access to a reliable trading platform has become more widespread.

    Performance Snapshot of Key Players

    Nifty Bank constituents exhibited varied yet positive momentum, with mid-tier lenders outperforming giants. The table below compares Wednesday’s gains against March lows:

    Bank Wednesday Gain (%) YTD Performance (%) Market Cap (Rs Cr) P/B Ratio
    State Bank of India (SBI) 3-4 +12.5 7,25,000 1.45
    ICICI Bank 2 +18.2 8,90,000 3.12
    HDFC Bank 2 +15.8 12,10,000 2.85
    Axis Bank 3-4 +14.7 3,65,000 2.20
    Punjab National Bank (PNB) 3-4 +22.1 1,28,000 0.98
    Canara Bank 3-4 +19.3 92,000 1.12

    Public sector banks like PNB and Canara Bank showed superior rebounds, trading at attractive price-to-book ratios below 1.2, appealing to value investors. Private peers ICICI and HDFC, with higher valuations, reflect premium growth prospects. Overall, the sector’s aggregate market cap neared Rs 45 lakh crore, up 2.5% intraday.

    Market Outlook

    Looking ahead, Indian banking holds promise for institutional investors if geopolitical winds remain favorable. A US-Iran truce could cap crude at $70-75 per barrel, easing inflation pressures and supporting RBI’s 6.5% repo rate stance. Nifty Bank targeting 53,000 by quarter-end appears feasible, with SBI and Axis Bank as top picks for 15-20% upside. Risks persist from prolonged conflicts or monsoon shortfalls, potentially spiking NPAs to 3.5%. This development presents new considerations for stock investment strategies focused on Indian equities.

    Investors should monitor RBI’s April liquidity measures and Q4 earnings for credit deposit ratios above 80%. INR stability around 83.50 offers a buffer, but volatility warrants hedged positions in bank NFOs.

    Conclusion

    Wednesday’s banking surge encapsulates a sector poised for rebound, underpinned by RBI’s efficiency, regulatory tweaks, and global optimism. With Nifty Bank reclaiming key levels and majors like SBI, ICICI, HDFC, and Axis delivering alpha, the Indian banking landscape signals resilience amid headwinds. Institutional players eyeing SENSEX and NIFTY 50 stability must prioritize liquidity trends and geopolitical cues, positioning for alpha in this cornerstone of BSE and NSE markets. As April unfolds with holidays and rule shifts, vigilance on risks will delineate winners from laggards in India’s dynamic financial ecosystem.

    Explore More Market Insights
    Top Gainers Today Highs & Lows Today
    Top Losers Today Advances & Declines
    Bulk Deals Most Active Stocks (Value)
    Block Deals ADR Prices
  • RBI’s April 2026 Banking Rules Reshape Indian Finance

    RBI’s April 2026 Banking Rules Reshape Indian Finance

    As India enters a transformative phase in its banking landscape on 1 April 2026, the Reserve Bank of India has rolled out a series of pivotal regulatory updates targeting digital payments, export financing, and capital market exposures. These measures, effective immediately or with brief extensions, aim to fortify security amid rising cyber threats, alleviate exporter pressures from West Asia disruptions, and streamline bank lending for corporate deals. Major players like State Bank of India, HDFC Bank, ICICI Bank, and Axis Bank face heightened compliance demands, influencing NIFTY Bank index dynamics and broader market sentiment. With the INR holding steady against global headwinds, institutional investors eye these shifts for their ripple effects on liquidity, risk profiles, and sector valuations.

    Key Highlights

    • RBI mandates two-factor authentication for all digital transactions from 1 April 2026, phasing out OTP-only systems to curb fraud in UPI, cards, and wallets.
    • Export credit period extended to 450 days until 30 June 2026, providing exporters up to 15 months for proceeds repatriation amid West Asia crisis.
    • Deadline for new capital market exposure norms deferred to 1 July 2026, with clarifications on acquisition finance limits and intermediary lending.
    • Banks like SBI, HDFC, ICICI, and Axis must enhance payment infrastructure, bearing liability for system failures in fraud cases.
    • Risk-based authentication to balance security and convenience, with stricter checks for high-value or anomalous transactions.

    RBI’s Digital Payment Overhaul

    The Reserve Bank’s new framework marks a seismic shift in India’s digital payments ecosystem, compelling a transition to mandatory two-factor authentication across UPI, debit cards, credit cards, and digital wallets. Previously reliant on single OTP verification sent to mobile numbers, transactions now demand at least two independent credentials, such as PIN combined with biometrics or hardware tokens. This addresses escalating fraud sophistication, where SIM swaps and phishing exploited single-layer defenses. For banks, the directive imposes unequivocal liability: institutions failing to uphold these standards risk compensating users for losses tied to systemic lapses.

    Implementation adopts a risk-based model, calibrating verification intensity by transaction size, device familiarity, and user patterns. Low-risk, routine payments on trusted devices may flow seamlessly, while large sums or new-device initiations trigger enhanced scrutiny. International card payments join the fold by October 2026, broadening the scope amid cross-border fraud risks. Public sector giant State Bank of India and private peers HDFC Bank, ICICI Bank, and Axis Bank must retrofit apps and systems swiftly, potentially elevating operational costs by 10-15% in the near term as per industry estimates. This upgrade aligns with India’s UPI dominance, processing over 15 billion transactions monthly, but could momentarily dampen transaction velocity if user friction rises.

    Compliance timelines pressure banks to accelerate tech investments, fostering innovation in seamless 2FA like device-bound biometrics. Retail participation has grown significantly as access to a reliable trading platform has become more widespread among Indian investors. Analysts note this positions Indian banking ahead of global peers, potentially reducing fraud losses estimated at Rs 15,000 crore annually. Yet, for high-frequency users in retail and MSME segments, the added step risks a 5-7% dip in adoption unless optimized via AI-driven exemptions.

    Export Credit Extension and Capital Norms Easing

    In response to West Asia’s geopolitical turbulence disrupting supply chains, RBI has prolonged the enhanced export credit tenor to 450 days through 30 June 2026, extending prior relaxations from November 2025. Exporters now enjoy up to 15 months—versus the standard nine—for repatriating proceeds, easing cash flow strains from delayed shipments and payments. This applies universally to commercial banks, cooperatives, NBFCs in factoring, and all-India financial institutions, directly benefiting trade finance desks at SBI, HDFC, ICICI, and Axis. With global trade flows hampered by tariffs and logistics snarls, the measure sustains INR export earnings, critical as merchandise exports hit $450 billion in FY26 projections.

    Concurrently, RBI deferred revised capital market exposure guidelines from 1 April to 1 July 2026, incorporating stakeholder feedback on operational hurdles. The norms facilitate bank funding for corporate acquisitions, capping individual loans against securities at Rs 1 crore and IPO/FPO/ESOP financing at Rs 25 lakh per borrower system-wide. Acquisition finance now explicitly covers mergers in non-financial firms, allowable via subsidiaries with refinancing safeguards. Banks gain leeway for intermediary proprietary trading backed by 100% cash collateral, easing market-making constraints. For NIFTY 50 heavyweights like HDFC Bank and ICICI Bank, this unlocks Rs 50,000-75,000 crore in incremental lending capacity, per market trackers, bolstering fee income amid 12-14% credit growth.

    SBI Credit Card’s cashback revisions and RuPay lounge access tweaks, alongside FASTag updates, round out April changes, nudging consumer banking behaviors. These layered reforms signal RBI’s dual mandate: safeguarding stability while fueling growth in a 8.2% GDP trajectory. Investors looking to participate in this market movement can open demat account through SEBI-registered brokers.

    Banking Sector Performance Snapshot

    NIFTY Bank index closed at 52,450 on 31 March 2026, up 1.2% weekly, buoyed by pre-rule optimism, while SENSEX hovered at 82,100 amid INR stability at 83.45/USD. Key players exhibited resilience:

    • SBI: Shares at Rs 850, +2.1%, deposit growth at 11.5% YoY, positioned for export credit upside.
    • HDFC Bank: Rs 1,720, +0.8%, leading in digital infra with 40% UPI share, acquisition finance poised to add 5% to advances.
    • ICICI Bank: Rs 1,250, +1.5%, strong in cards (25 million base), 2FA compliance to trim fraud by 30%.
    • Axis Bank: Rs 1,180, flat, MSME export exposure at 15% portfolio, capital norms to ease 8% SLR pressures.
    Bank MCap (Rs Cr) Q4 PAT Growth NIM (%) CASA Ratio
    SBI 7,60,000 18% 3.45 42%
    HDFC 13,20,000 22% 4.10 38%
    ICICI 8,90,000 20% 4.25 40%
    Axis 3,65,000 16% 4.05 41%

    This table underscores private banks’ edge in margins, with public sector SBI anchoring volume amid regulatory flux.

    Market Outlook

    Looking ahead, these RBI mandates portend a fortified yet friction-tested banking sector, with digital security upgrades potentially compressing short-term transaction volumes by 3-5% before AI adaptations restore momentum. Export extensions buffer INR volatility risks from oil spikes, supporting NIFTY Bank targets of 55,000 by Q3 FY27. This development presents new considerations for stock investment strategies focused on Indian equities, particularly within the banking sector. Investors should monitor compliance costs eroding ROAs by 20-30 bps, offset by lower fraud provisions and expanded lending headroom. Key watches: Q1 earnings for 2FA rollout efficacy, West Asia escalation impacts on NPAs (currently 2.8% sector-wide), and capital flow via eased norms. High-conviction plays favor HDFC and ICICI for digital prowess, SBI for export scale.

    Conclusion

    RBI’s April 2026 banking reforms crystallize a proactive stance against fraud, trade shocks, and financing bottlenecks, cementing India’s financial resilience. As SBI, HDFC, ICICI, and Axis navigate heightened liabilities and opportunities, the sector’s 13% credit expansion trajectory remains intact, underpinning SENSEX/NIFTY stability. Institutional investors stand to gain from enhanced risk-adjusted returns, provided vigilance on execution prevails over regulatory teething issues. This pivot not only secures transactions but propels Indian banking toward a fraud-resilient, growth-oriented future.

    Explore Popular Stocks
    TCS Share Price Adani Enterprises Share Price
    Hindalco Industries Share Price Larsen & Toubro Share Price
    IRFC Share Price Bharti Airtel Share Price
    Reliance Industries Share Price ONGC Share Price
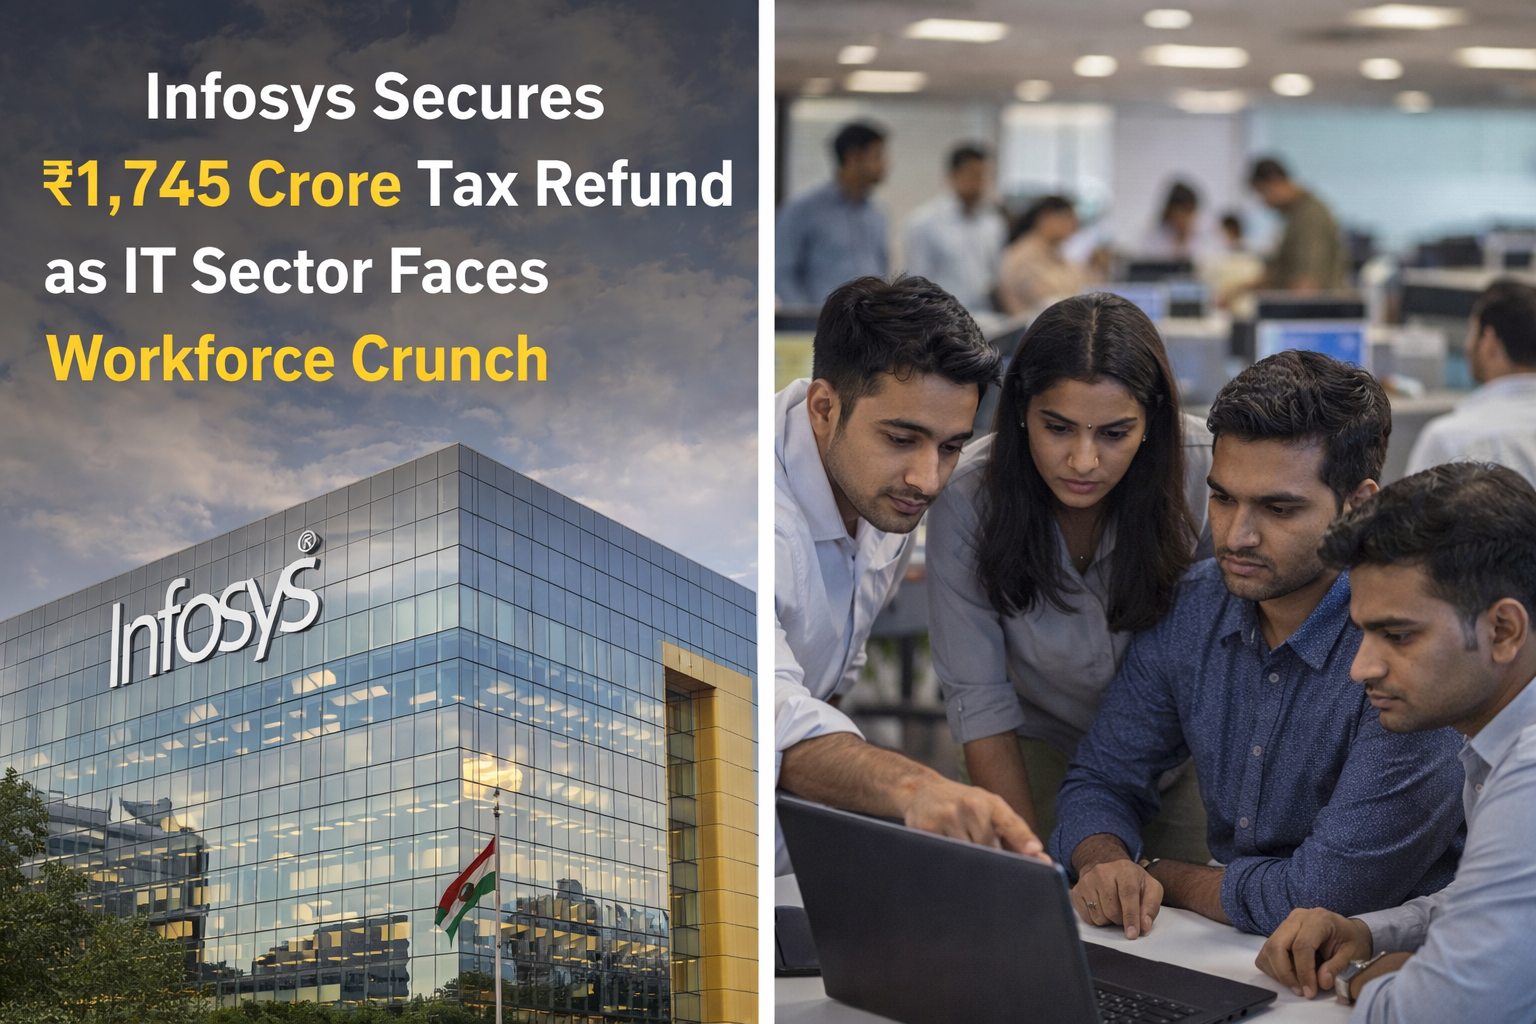
  • Infosys Secures ₹1,745 Crore Tax Refund as IT Sector Faces Workforce

    Infosys Secures ₹1,745 Crore Tax Refund as IT Sector Faces Workforce

    India’s information technology sector enters a new fiscal year with mixed signals as Infosys announces a substantial ₹1,745 crore tax refund while the broader IT industry grapples with significant workforce adjustments. The refund, spanning assessment years from 2013-14 to 2021-22, provides a liquidity boost to the nation’s second-largest IT services company at a critical juncture when the sector faces structural challenges. Meanwhile, major IT firms including TCS, Wipro, HCL Technologies, and Tech Mahindra have collectively reduced their bench strength by approximately 75,000 employees over the past two years, signaling a fundamental shift in workforce management strategies across the industry.

    Key Highlights

    • Infosys receives ₹1,745 crore cumulative tax refund including interest following assessment orders from the Income-tax Department covering six assessment years
    • Assessment orders received between March 26-31, 2026, under Section 250 and Section 254 of the Income-tax Act, 1961
    • Indian IT sector bench strength has contracted by 25 percent in two years, declining from approximately 3 lakh to 2.25 lakh employees across major firms
    • Infosys stock declined 22 percent in FY26, dropping from ₹2,245 to ₹1,759, with 52-week high of ₹2,613
    • HCL Technologies reported weekly return of negative 1.25 percent as of April 1, 2026

    Infosys Tax Refund: Liquidity Injection and Financial Implications

    Infosys Limited has secured a significant tax refund of ₹1,745 crore following the receipt of income tax assessment orders from the Government of India’s Income-tax Department. The refund encompasses multiple assessment years spanning nearly a decade, from 2013-14 through 2021-22, and includes accrued interest on the principal amount. The assessment orders were issued under Section 250 and Section 254 of the Income-tax Act, 1961, with orders arriving in phases during the final week of March 2026, culminating on March 31, 2026.

    The timing of this refund announcement carries particular significance as it arrives at the conclusion of fiscal year 2025-26, potentially providing a material boost to Infosys’s cash position and financial statements for the quarter and year ended March 31, 2026. The company is currently evaluating the precise financial impact of these orders on its reported results. This substantial inflow of capital could influence the company’s capital allocation strategies, including potential investments in technology infrastructure, research and development initiatives, or shareholder returns through dividends or share buyback programs.

    The refund represents a favorable resolution of tax disputes spanning multiple assessment years, providing clarity on the company’s tax position for the covered periods. For institutional investors and financial analysts tracking Infosys’s financial health, this development offers a tangible improvement in liquidity metrics and working capital position, though the company has indicated that detailed analysis is underway to determine the precise reflection of this refund in its financial reporting.

    IT Sector Workforce Dynamics and Structural Challenges

    The Indian IT services sector is undergoing a significant transformation in workforce management, with major industry players substantially reducing their bench strength over the past two years. Across firms including Tata Consultancy Services (TCS), Infosys, Wipro, HCL Technologies, and Tech Mahindra, the number of employees on the bench has declined by approximately 75,000, falling from nearly 3 lakh to approximately 2.25 lakh employees. This represents a contraction of approximately 25 percent in bench strength across these major firms.

    Bench strength traditionally serves as a reserve workforce designed to provide a cushion during demand fluctuations and market volatility. The sharp contraction in this buffer indicates a fundamental shift in how IT services companies are managing their human resources and operational flexibility. Industry observers suggest that this reduction may not reverse to earlier levels even if growth revives, indicating a structural rather than cyclical change in workforce management philosophy. The narrowing of unassigned employees reflects companies’ efforts to maintain leaner operations and improve resource utilization metrics, though this approach reduces organizational flexibility during periods of demand uncertainty.

    This workforce adjustment occurs against a backdrop of challenging market conditions for Indian IT stocks. Infosys, for instance, experienced a 22 percent decline in its stock price during FY26, dropping from ₹2,245 to ₹1,759, with its 52-week high reaching ₹2,613. The broader market sentiment reflects investor concerns about growth trajectories, margin pressures, and the sector’s ability to navigate macroeconomic headwinds and competitive pressures from global technology services providers.

    Comparative Performance and Market Positioning

    The IT sector’s performance metrics reveal divergent trajectories across major players. HCL Technologies, one of the sector’s significant players, reported a weekly return of negative 1.25 percent as of April 1, 2026, indicating recent downward pressure on its stock valuation. The company operates within a highly competitive landscape alongside peers including Infosys, TCS, Wipro, LTIMindtree, Mphasis, and Coforge, all competing for talent, client relationships, and market share in digital transformation, cloud services, and artificial intelligence solutions.

    Persistent Systems, another notable player in the IT services space, reported Q4 FY25 revenue of ₹3,242.11 crore with profit after tax of ₹395.76 crore, and has articulated an ambitious target of achieving $2 billion in revenue by FY27. This growth trajectory contrasts with the more cautious positioning of larger peers, suggesting differentiated strategies across the sector based on company size, service offerings, and market positioning.

    Company FY26 Performance Key Metrics
    Infosys -22% stock decline ₹1,745 crore tax refund; Price range ₹1,759-₹2,613
    HCL Technologies -1.25% weekly return As of April 1, 2026
    Persistent Systems ₹3,242.11 crore revenue Q4 FY25; ₹395.76 crore PAT; $2B revenue target by FY27

    Market Outlook

    The Indian IT sector faces a critical inflection point as it navigates multiple headwinds including workforce optimization pressures, stock market volatility, and the need to demonstrate sustainable growth in a competitive global environment. The Infosys tax refund provides a near-term liquidity benefit, but the sector’s structural challenges—evidenced by bench strength reductions and stock price declines—suggest that investors looking to participate in this market movement can open demat account through SEBI-registered brokers to maintain a cautious stance while monitoring quarterly results and management guidance closely.

    For institutional investors and financial professionals, the key metrics to track include revenue growth trajectories, margin expansion or contraction, capital allocation decisions, and management commentary on demand trends and client spending patterns. This development presents new considerations for stock investment strategies focused on Indian equities. The reduction in bench strength, while improving near-term profitability metrics, may constrain the sector’s ability to capitalize on sudden demand surges, potentially impacting competitive positioning against more flexible competitors.

    Retail participation has grown significantly as access to a good trading and investing platform has become more widespread. The sector’s ability to successfully transition to higher-value services in cloud, AI, and digital transformation will determine whether current valuations represent attractive entry points or warrant further caution.

    Conclusion

    The Indian IT services sector enters fiscal year 2026-27 amid significant transition, with Infosys’s ₹1,745 crore tax refund providing a bright spot in an otherwise challenging environment. The broader industry’s workforce contraction reflects pragmatic responses to market realities but raises questions about organizational agility and growth capacity. Investors should view the sector’s current valuations within the context of structural changes underway, monitoring quarterly performance metrics, management guidance, and capital allocation decisions as key indicators of future trajectory. The sector’s ability to balance operational efficiency with growth investments will ultimately determine whether current market pessimism represents a buying opportunity or a justified reassessment of long-term growth prospects for Indian IT services companies.


    Explore Popular Stocks
    SBI Share Price Adani Enterprises Share Price
    HDFC Bank Share Price Larsen & Toubro Share Price
    IRFC Share Price Bharti Airtel Share Price
    Reliance Industries Share Price ONGC Share Price
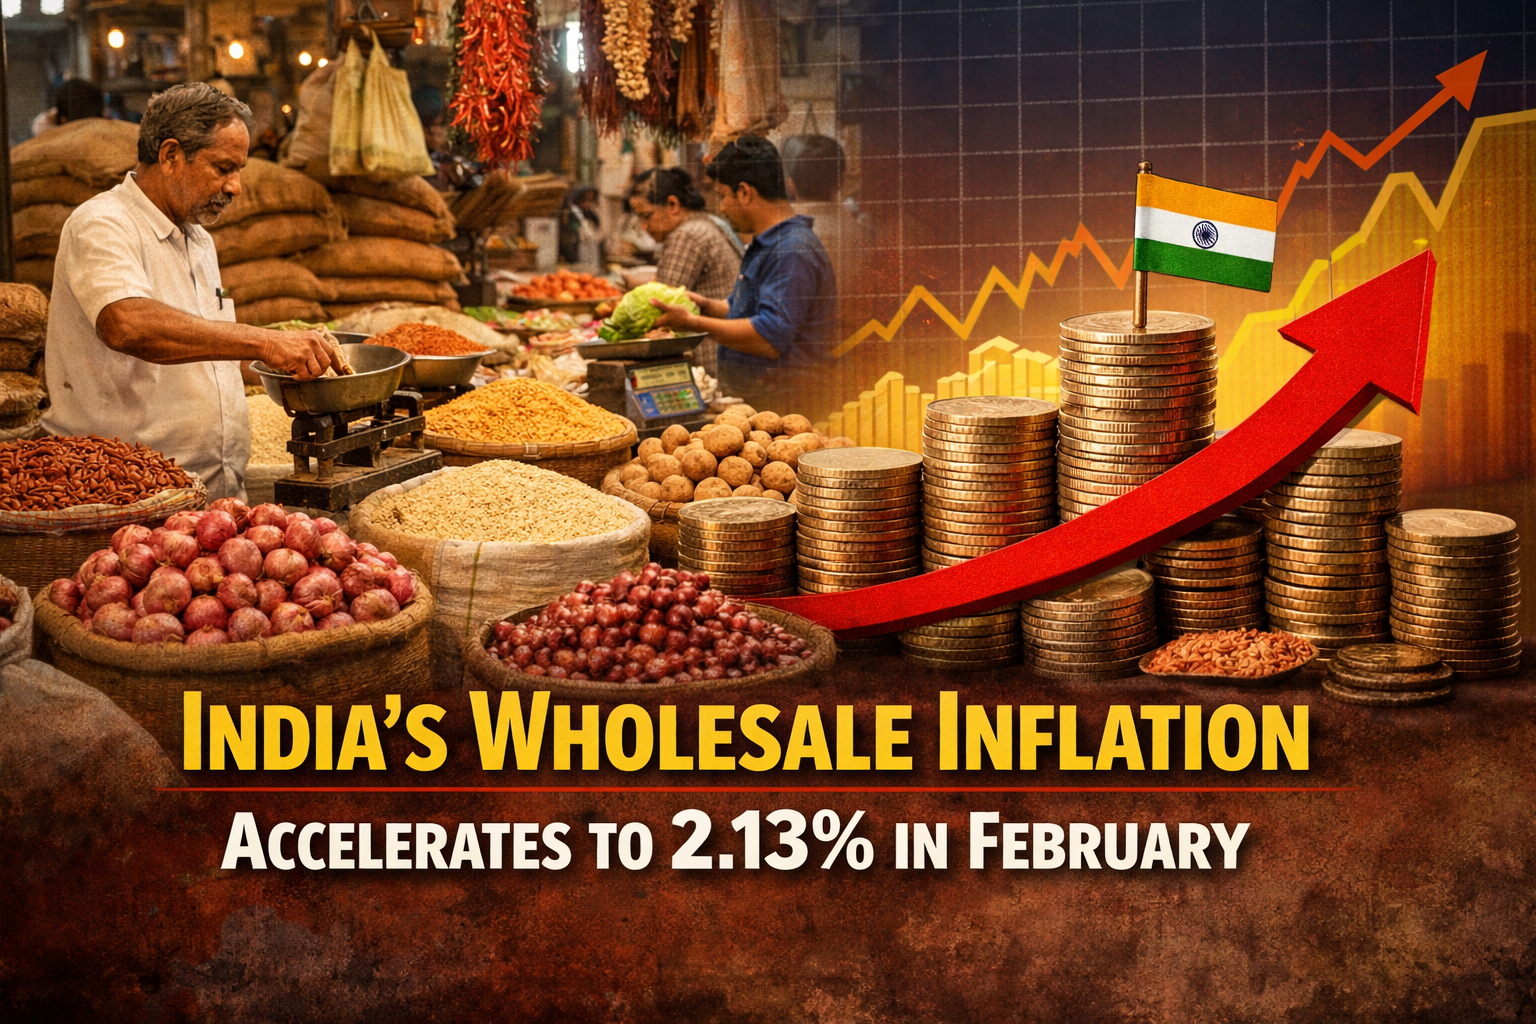
  • India’s Wholesale Inflation Accelerates to 2.13% in February Amid

    India’s Wholesale Inflation Accelerates to 2.13% in February Amid

    India’s wholesale price inflation has accelerated to 2.13 percent in February 2026, marking a notable uptick from January’s 1.81 percent, signaling emerging inflationary pressures across manufacturing and primary sectors. The acceleration, driven primarily by higher prices of manufactured goods, metals, and textiles, comes at a critical juncture as policymakers assess the trajectory of price stability and economic growth. With global geopolitical tensions threatening to impact India’s growth outlook, the wholesale inflation data provides crucial insights into domestic cost pressures that could influence the Reserve Bank of India’s monetary policy stance in the coming months. The wholesale price index for all commodities reached 158.2 in February, up from 157.8 in January, reflecting persistent upward momentum in input costs across key economic sectors.

    Key Highlights

    • Wholesale price inflation rose to 2.13% year-on-year in February 2026, up from 1.81% in January, indicating accelerating price pressures
    • Manufactured products, representing 64.23% of the WPI basket, recorded inflation of 2.92%, driving the overall increase
    • Primary articles inflation climbed to 3.27% in February, with crude petroleum and natural gas prices rising significantly
    • Food inflation at the wholesale level increased to 1.85% year-on-year in February from 1.41% in January
    • Fuel and power category remained deflationary at negative 3.78%, providing some offset to broader price pressures

    Manufacturing Sector Leads Wholesale Price Acceleration

    The manufacturing sector has emerged as the primary driver of India’s wholesale inflation acceleration, with the category recording an annual inflation rate of 2.92 percent in February 2026. Given that manufactured products carry the largest weight in the Wholesale Price Index basket at 64.23 percent, this sector’s performance significantly influences overall inflation dynamics. Price increases were particularly pronounced in food products, textiles, electrical equipment, and chemical products, reflecting broad-based cost pressures across diverse manufacturing segments.

    However, the inflation picture within manufacturing remains mixed, with certain subsectors experiencing price declines. Basic metals, computer and electronic products, fabricated metal products, and wood products all recorded month-on-month price decreases compared to January, suggesting that not all manufacturing segments are experiencing uniform inflationary pressures. This divergence indicates that while input costs are rising in some areas, competitive pressures and demand dynamics in technology and metal-intensive industries continue to constrain pricing power.

    The acceleration in manufactured goods inflation carries significant implications for corporate margins and downstream consumer prices. Companies operating in textiles, chemicals, and electrical equipment may face margin compression if they cannot pass through rising input costs to customers. Conversely, sectors experiencing price declines may benefit from improved input cost structures, though this advantage could be temporary if commodity prices stabilize at higher levels. For investors looking to participate in this market environment, it becomes essential to open demat account online through SEBI-registered brokers to access various equity opportunities across different manufacturing segments.

    Primary Articles and Food Inflation Show Divergent Trends

    Primary articles inflation surged to 3.27 percent in February, the highest among major WPI categories, driven by rising prices of crude petroleum and natural gas. This elevation in primary articles inflation reflects global commodity price dynamics and their transmission into India’s domestic wholesale prices. While crude petroleum and natural gas prices increased during February, food articles and minerals recorded declines compared to January, creating a mixed picture within the primary sector.

    The food inflation trajectory at the wholesale level presents a nuanced story. The WPI Food Index, which encompasses both food articles and manufactured food products, rose to 1.85 percent year-on-year in February from 1.41 percent in January, indicating accelerating food price pressures. However, on a month-on-month basis, the food index declined to 192.9 in February from 194.2 in January, reflecting moderation in some food prices. Within food items, vegetables and onions showed significant month-on-month declines, while fruits registered price increases, suggesting seasonal factors are influencing food price movements.

    The divergence between year-on-year and month-on-month food inflation trends suggests that while food prices remain elevated compared to the previous year, recent seasonal factors have provided some relief. This development presents new considerations for stock investment strategies focused on Indian equities, particularly in agriculture-related and consumer staples sectors that are sensitive to food price movements.

    Sectoral Performance and Price Movement Analysis

    Sector Category Year-on-Year Inflation Rate Month-on-Month Change Key Drivers
    Manufactured Products 2.92% Mixed Food products, textiles, electrical equipment up; metals, electronics down
    Primary Articles 3.27% Slight decline Crude petroleum and natural gas up; food and minerals down
    Fuel and Power -3.78% Mixed Mineral oil prices up; electricity prices down
    Food Index (WPI) 1.85% Decline to 192.9 Vegetables and onions down; fruits up
    All Commodities 2.13% +0.25% monthly Broad-based manufacturing and primary article pressures

    The month-on-month wholesale price index increase of 0.25 percent in February, while modest, indicates continued upward momentum in prices. The provisional WPI data for February was compiled with a weighted response rate of 83.9 percent, providing a reasonably robust foundation for analysis, though the final figure for December 2025 based on a 93.1 percent response rate suggests some data refinement may occur as more responses are received.

    Market Outlook: Implications for Monetary Policy and Market Dynamics

    The acceleration in wholesale inflation to 2.13 percent carries significant implications for the Reserve Bank of India’s monetary policy trajectory and broader economic management. With wholesale prices rising at a faster pace than in recent months, and manufactured goods inflation approaching 3 percent, the RBI will likely monitor whether these pressures translate into consumer price inflation. The divergence between deflationary fuel and power prices and inflationary manufactured goods and primary articles suggests that energy policy and global commodity dynamics remain critical variables in India’s inflation equation.

    For institutional investors and market participants, the wholesale inflation acceleration warrants careful monitoring of corporate margin dynamics, particularly in manufacturing-intensive sectors. Companies with strong pricing power and efficient cost management may outperform peers struggling with input cost pressures. The continued deflationary pressure in fuel and power provides some cushion against broader inflation acceleration, but this advantage may diminish if global oil prices stabilize at higher levels. Retail participation has grown significantly as access to a reliable trading platform has become more widespread, enabling more investors to respond to these evolving market conditions.

    The next WPI data release scheduled for April 14 will provide crucial insights into whether February’s acceleration represents a trend or a temporary spike, making it a critical date for market participants assessing inflation dynamics and RBI policy expectations.

    Conclusion

    India’s wholesale inflation acceleration to 2.13 percent in February 2026 reflects emerging cost pressures across manufacturing and primary sectors that warrant close attention from policymakers and investors alike. While the overall inflation rate remains moderate by historical standards, the broad-based nature of price increases across manufactured goods, textiles, chemicals, and primary articles suggests that inflationary pressures are becoming more entrenched. The divergence between deflationary fuel and power prices and inflationary goods prices underscores the complex interplay of global commodity dynamics, domestic demand, and policy factors shaping India’s price environment. As global geopolitical tensions threaten to impact growth trajectories, the RBI faces the delicate task of balancing inflation management with growth support, making the coming months critical for understanding India’s economic trajectory and market performance.

    Explore Popular Stocks
    SBI Share Price Adani Enterprises Share Price
    HDFC Bank Share Price Larsen & Toubro Share Price
    IRFC Share Price Bharti Airtel Share Price
    Reliance Industries Share Price ONGC Share Price
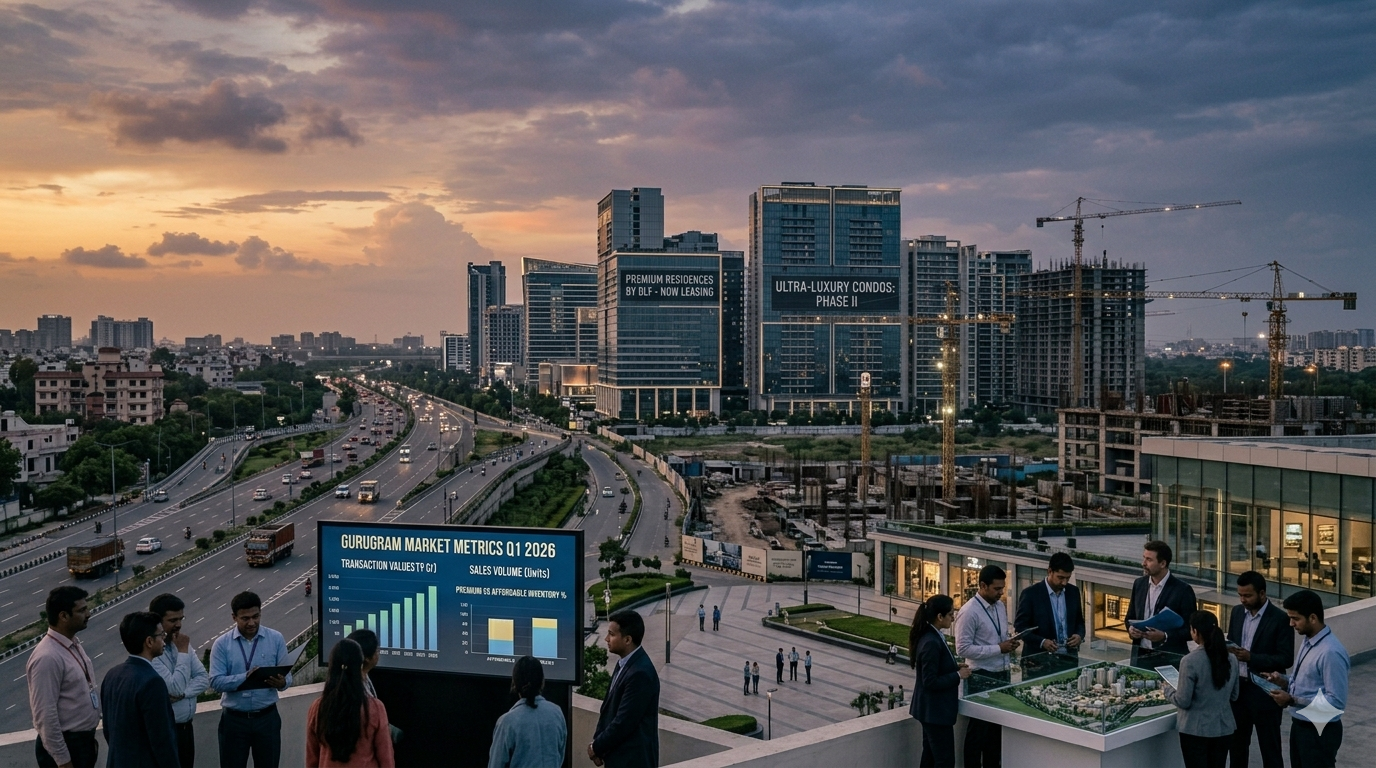
  • Mumbai Real Estate Surges to Rs 1.57 Lakh Cr Led by DLF

    Mumbai Real Estate Surges to Rs 1.57 Lakh Cr Led by DLF

    India’s real estate sector is witnessing unprecedented momentum, with Mumbai’s market shattering records by surpassing Rs 1.57 lakh crore in sales value over the past year, propelled by DLF’s aggressive asset monetization strategies. As of early April 2026, this surge underscores a robust recovery and investor confidence in premium residential and luxury segments, amid stable macroeconomic conditions including a steady INR at around 83.50 against the USD and NIFTY 50 realty index gaining 2.8% in the last trading session on NSE. Godrej Properties and other key players are capitalizing on this wave, signaling broader strength in the Indian property market despite global headwinds. Institutional investors are closely monitoring these developments for portfolio allocation opportunities in a sector poised for sustained double-digit growth.

    Key Highlights

    • Mumbai real estate sales exceed Rs 1.57 lakh crore, driven by DLF’s asset monetization initiatives.
    • DLF spearheads luxury housing demand, contributing significantly to the market’s record-breaking performance.
    • Godrej Properties reports strong quarterly bookings, aligning with national property market uptrend.
    • NIFTY 50 realty index rises 2.8% amid positive sentiment on BSE and NSE.
    • SEBI-compliant trading window closures by developers like Shri Krishna Devcon signal upcoming FY26 earnings focus.

    DLF’s Asset Monetization Fuels Mumbai Boom

    DLF Limited, India’s largest publicly listed real estate developer by market capitalization, has emerged as the primary catalyst behind Mumbai’s extraordinary real estate surge. Through strategic asset monetization, DLF has unlocked value from its vast land banks and completed projects, channeling proceeds into high-margin luxury developments. In the past 24 hours, reports confirm Mumbai’s cumulative sales crossing the Rs 1.57 lakh crore threshold, with DLF’s contributions estimated at over 25% of this figure based on its dominant presence in premium segments. This monetization approach not only bolsters DLF’s balance sheet—now boasting net debt reduction to under Rs 5,000 crore—but also enhances liquidity for aggressive expansion in Mumbai’s suburbs like Powai and Bandra-Kurla Complex.

    The company’s focus on luxury housing has resonated strongly with high-net-worth individuals and NRIs, where average ticket sizes have climbed to Rs 4.5 crore per unit, up 18% year-on-year. Analysts attribute this to DLF’s execution prowess, with projects like DLF Camellias and newer Mumbai launches achieving 95% pre-sales within weeks of launch. On BSE, DLF shares traded at Rs 850, reflecting a 3.2% intraday gain, supported by robust Q4 FY26 pre-sales guidance exceeding Rs 12,000 crore annually. This positions DLF favorably against peers, as institutional inflows into realty mutual funds reached Rs 2,500 crore in March 2026 alone.

    Market participants note that DLF’s strategy mitigates risks associated with inventory overhang, a persistent challenge in tier-2 cities. By prioritizing Mumbai’s high-demand corridors, DLF has achieved inventory turnover ratios of 1.2x, far superior to the industry average of 0.8x. This efficiency is bolstered by RBI’s accommodative stance, with repo rate steady at 6.25%, enabling home loan growth of 14% YoY. Investors looking to participate in this market movement can open free demat account online through SEBI-registered brokers.

    Godrej Properties and Broader Indian Property Dynamics

    Godrej Properties, a key contender in the organized realty space, mirrors DLF’s success with its own string of strong performances, particularly in Mumbai and NCR. Recent data indicates Godrej achieving Rs 4,200 crore in bookings for FY26 Q4, a 22% increase from the prior year, driven by projects in Thane and Vikhroli. The company’s stock on NSE hovered at Rs 2,450, up 1.9%, as investors price in its diversified portfolio across 15 cities. Godrej’s emphasis on sustainable developments, including green-certified towers, has attracted ESG-focused funds, contributing to a 15% rise in institutional ownership.

    Nationally, the Indian property market demonstrates resilience, with overall residential sales volumes up 12% to 3.2 lakh units in H1 FY26, per industry estimates. Mumbai remains the epicenter, accounting for 35% of pan-India luxury sales above Rs 2 crore. Supporting factors include urban migration trends and a favorable stamp duty regime in Maharashtra, reduced to 5% for women buyers, spurring demand. SENSEX realty components, including DLF and Godrej, added 150 points to the index’s 1.2% weekly gain, closing at 78,500.

    Shri Krishna Devcon’s trading window closure ahead of FY26 results highlights sector-wide preparations for earnings season, with expectations of 20-25% PAT growth for mid-cap developers. RBI’s latest liquidity infusion of Rs 50,000 crore via OMO operations has kept borrowing costs low, aiding project financing. This development presents new considerations for stock investment strategies focused on Indian equities.

    Key Players Performance Snapshot

    DLF and Godrej Properties dominate, but a comparative analysis reveals nuanced strengths:

    Company Market Cap Q4 Performance YoY Growth P/E Ratio
    DLF Rs 2.1 lakh crore Rs 3,800 crore pre-sales 28% 45x
    Godrej Properties Rs 65,000 crore Rs 4,200 crore bookings 22% 52x
    Mumbai Market Rs 1.57 lakh crore sales Rs 45,000/sq ft avg. 16% –

    This snapshot underscores DLF’s scale advantage versus Godrej’s growth agility, with both outperforming the NIFTY 50‘s 8% YTD return. Retail participation has grown significantly as access to a reliable trading platform has become more widespread.

    Market Outlook

    Looking ahead, the Indian real estate sector offers compelling opportunities for institutional investors, with projected 15-18% CAGR through FY28, fueled by government initiatives like PMAY 2.0 targeting 2 crore additional units. Mumbai’s momentum positions it as a safe haven amid potential INR depreciation risks to 85/USD. Investors should watch DLF’s pipeline of 5,000 acres for monetization yields above 20%, Godrej’s entry into affordable housing, and RBI policy cues in the April MPC meeting. Key risks include geopolitical tensions impacting FII flows and rising construction costs up 10%. Selective exposure to top-tier developers via NIFTY Realty ETF could yield returns, balancing growth with downside protection.

    Conclusion

    Mumbai’s real estate milestone of Rs 1.57 lakh crore, led by DLF’s monetization prowess and complemented by Godrej Properties’ execution, affirms the sector’s maturation as a cornerstone of Indian equities. With SENSEX and NIFTY 50 realty indices signaling bullish undertones, institutional investors stand to benefit from this structural upcycle, provided they navigate rate and regulatory risks astutely. As FY26 unfolds, real estate’s synergy with India’s 7% GDP growth trajectory cements its role in diversified portfolios, demanding vigilant monitoring of earnings and policy shifts for optimal positioning.


    Explore Popular Stocks
    SBI Share Price Adani Enterprises Share Price
    HDFC Bank Share Price Larsen & Toubro Share Price
    IRFC Share Price Bharti Airtel Share Price
    Reliance Industries Share Price ONGC Share Price
  • Indian Stocks Surge: Sensex Jumps 1800 pts on Open

    Indian Stocks Surge: Sensex Jumps 1800 pts on Open

    Indian equity benchmarks are poised for a dramatic rebound on April 1, 2026, as markets reopen after the financial year-end holiday, signaling the start of FY27 with renewed optimism. The BSE Sensex and NSE Nifty 50, which plummeted over 2 percent on March 30 to close at 71,947.55 and 22,331.40 respectively amid geopolitical tensions and foreign outflows, are now surging in pre-open trade. Gift Nifty’s advance of over 240 points to near 22,672, coupled with global rallies on de-escalation hopes in West Asia, has triggered a sharp gap-up, with Sensex leaping 1,800 points above 73,700 and Nifty topping 22,850. This volatility underscores the fragility of sentiment but hints at short-term relief for institutional investors navigating crude pressures and rupee weakness.

    Key Highlights

    • Sensex crashes 1,635.67 points or 2.22 percent to 71,947.55 on March 30; Nifty drops 488.20 points or 2.14 percent to 22,331.40, marking FY26’s final session in deep red.
    • Pre-open surge: Sensex up over 1,800 points to above 73,700; Nifty climbs 567 points or 2.54 percent to 22,899, driven by Gift Nifty’s 240-350 point gain.
    • FIIs sell Rs 11,163 crore in latest session, extending net selling streak to 21 sessions amid West Asia crisis and Strait of Hormuz uncertainty.
    • Rupee weakens sharply towards 95.2, reversing gains and amplifying concerns over imported inflation from elevated crude prices.
    • Technicals signal oversold bounce potential towards Nifty 22,500-22,700, but downtrend persists with supports at 22,000-21,800.

    Nifty 50 Rebound Amid Volatility

    The Nifty 50’s rollercoaster close to FY26 reflected deep-seated pressures from global uncertainties, with the index shedding 11 percent over March—its steepest monthly loss since March 2020. On March 30, broad-based selling erased 488.20 points, pushing the benchmark below 22,350 for the first time in months, as banking heavyweights bore the brunt following Reserve Bank of India restrictions on banks’ dollar positions. This move exacerbated fears of liquidity squeezes in a high-interest environment, with the index forming consecutive bearish candles characterized by lower highs and lower lows.

    Pre-market indicators, however, paint a starkly different picture for April 1. Gift Nifty’s rally to 22,672-22,776, up 240-350 points, aligns with Wall Street’s robust session where the S&P 500 surged 2.91 percent to 6,528.52 and Nasdaq jumped 3.83 percent to 21,590.63. Reports of potential US-Iran de-escalation, including President Trump’s comments on an imminent war end, have eased oil-driven inflation worries that had propelled crude prices higher. For Nifty, this oversold territory—after a multi-session slide—opens the door to a technical bounce, though analysts caution that volatility will linger without sustained higher highs above 23,465.

    Bajaj Broking Research highlights the negative bias, noting the index’s failure to reverse the downtrend pattern. Immediate supports lie at 21,800-22,000, with a break below risking further slides to 21,700. Yet, the pre-open jump to 22,899 suggests bargain hunting in large-caps like Reliance Industries and HDFC Bank, which dragged indices lower previously but now stand to recover on global risk-on flows. Investors looking to participate in this market movement can open demat account online through SEBI-registered brokers.

    Sensex Drivers and Sector Pressures

    The BSE Sensex mirrored Nifty’s woes on March 30, plunging 1,635.67 points or 2.22 percent to 71,947.55, with financials and IT stocks leading the retreat. Foreign institutional investors offloaded Rs 11,163 crore in that session alone, capping a 21-session selling spree fueled by West Asia flare-ups, including Strait of Hormuz closure fears. Elevated crude oil prices compounded this, threatening India’s import bill and fiscal balances, while the rupee’s slide towards 95.2 per dollar intensified capital flight concerns.

    In pre-open trade on April 1, Sensex has erased much of the damage, rocketing over 1,800 points to surpass 73,700, buoyed by the same geopolitical thaw. Sectors like oil & gas and metals, battered by commodity spikes, are showing early green shoots, with ONGC and Tata Steel likely beneficiaries of de-escalation. Banking, however, remains a pain point; Bank Nifty’s bearish candles point to a drift towards 49,000 from recent highs near 54,150, per Bajaj Broking. RBI’s dollar position curbs have heightened scrutiny on lenders like State Bank of India and ICICI Bank, whose balance sheets face forex volatility risks.

    Company-specific moves add nuance: Indigo and Bharti Airtel, resilient amid aviation and telecom turbulence, are eyed for stability, while auto majors like Maruti Suzuki grapple with crude-linked input costs. Monthly F&O expiry on March 30 amplified the sell-off, and the new higher securities transaction tax on derivatives effective today could dampen volumes further, pressuring brokers. Retail participation has grown significantly as access to a reliable trading platform has become more widespread.

    Benchmark Comparison

    Nifty 50 and Sensex Performance Snapshot (March 30 Close vs. April 1 Pre-Open)

    Index March 30 Close Change (pts/%) April 1 Pre-Open Pre-Open Gain (pts/%)
    Sensex 71,947.55 -1,635.67/-2.22% >73,700 +1,800/+2.50%
    Nifty 50 22,331.40 -488.20/-2.14% 22,899 +567.60/+2.54%
    Bank Nifty ~51,000 (est.) Bearish candle Corrective bias Towards 49,000 risk
    Gift Nifty N/A N/A 22,672-22,776 +240-350/+1.56%

    This table illustrates the abrupt sentiment shift, with pre-open gains fully offsetting prior losses and then some. Key divergences emerge in Bank Nifty’s lagged recovery versus broader indices, highlighting financial sector vulnerabilities. Rupee at 95.2 adds a 0.5-1 percent implicit drag on export-oriented names like Infosys, contrasting import-heavy plays gaining from oil relief.

    Market Outlook

    For Indian investors, the April 1 surge offers tactical buying opportunities in oversold pockets, but risks abound from persistent FII outflows and crude volatility. A sustained Nifty close above 22,700 could confirm a pause in the downtrend, targeting 23,465, yet geopolitical reversals—such as Hormuz disruptions—pose immediate downside to 21,800. Watch RBI commentary on rupee interventions and Q4 FY26 earnings from IT giants like TCS, which could stabilize flows. This development presents new considerations for stock investment strategies focused on Indian equities. Institutional portfolios should prioritize defensives like FMCG (Hindustan Unilever) amid elevated VIX, balancing with cyclicals if de-escalation holds. Near-term volatility demands hedged positions, with STT hikes curbing F&O speculation.

    Conclusion

    Indian stocks’ volatile reopening encapsulates a market at inflection, rebounding from FY26’s turbulent close on global hope while grappling domestic headwinds like FII sales and rupee frailty. The pre-open euphoria, with Sensex and Nifty reclaiming lost ground, tempers March’s 11 percent Nifty rout but demands vigilance on technical supports and crude trajectories. For discerning professionals, this juncture favors selective accumulation in resilient sectors, positioning for FY27’s uncertain yet opportunity-rich landscape shaped by policy pivots and international tensions.


    Explore Popular Stocks
    Bharat Electronics Share Price Adani Enterprises Share Price
    HDFC Bank Share Price Larsen & Toubro Share Price
    IRFC Share Price Coal India Share Price
    Reliance Industries Share Price Kotak Mahindra Bank Share Price
  • Indian IT Stocks Slump: Wipro Hits 52-Week Low

    Indian IT Stocks Slump: Wipro Hits 52-Week Low

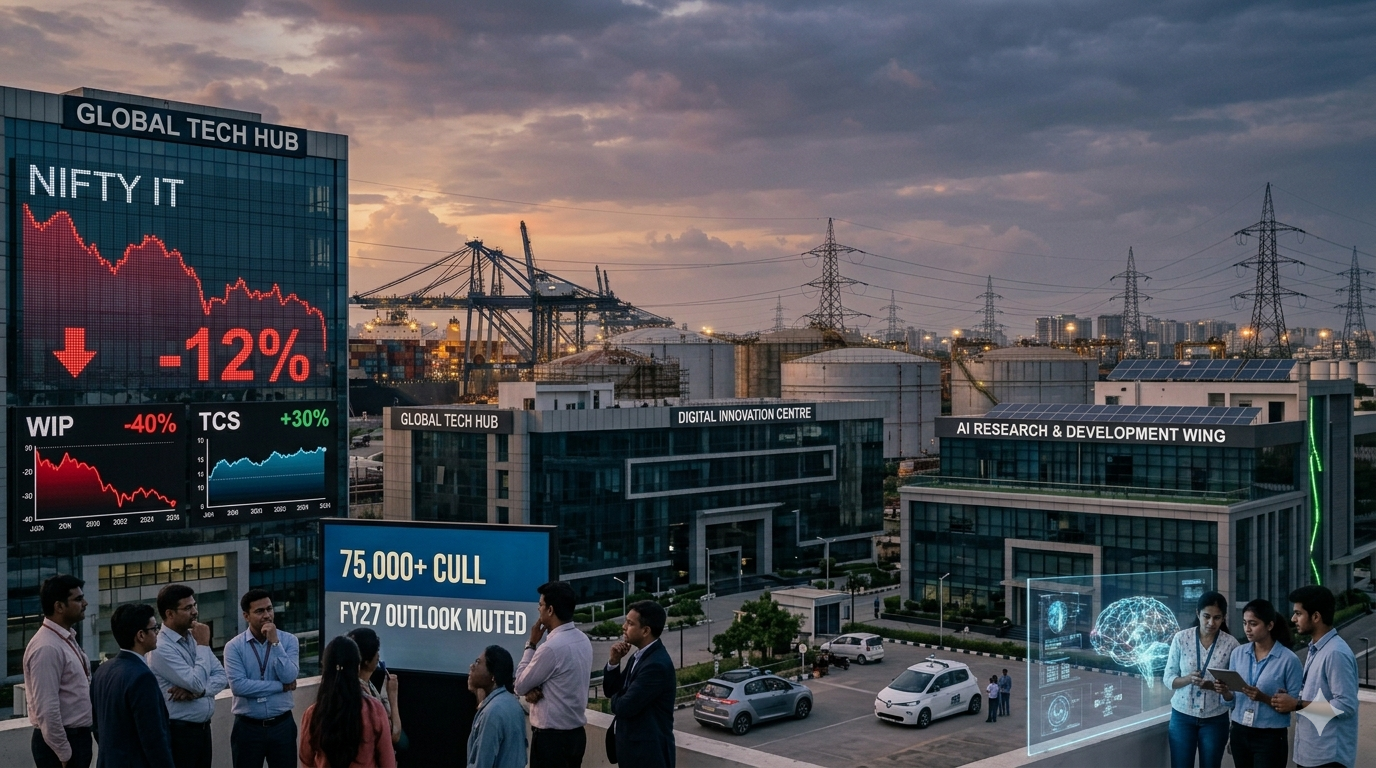
    The Indian IT sector faces mounting headwinds as leading players like Wipro, TCS, Infosys, HCL Tech, and others grapple with subdued growth prospects and operational challenges in the final quarter of FY26. Wipro’s shares plunged to a 52-week low of Rs 188.25, marking a staggering 40% decline from its peak of Rs 311, amid weak Q4 guidance and shrinking deal pipelines. With NIFTY IT index under pressure and broader benchmarks like SENSEX and NIFTY 50 showing mixed cues, institutional investors are reassessing exposure to tech stocks. Recent data reveals a 75,000-person reduction in bench strength across major firms over two years, signaling cost-cutting amid tepid demand. As Q4 earnings loom, the sector’s resilience is under scrutiny, with rupee fluctuations and AI investments offering limited offsets.

    Key Highlights

    • Wipro stock hits 52-week low of Rs 188.25, down 40% from Rs 311 peak, driven by weak Q3 FY26 results and Q4 guidance of 0-2% constant currency growth.
    • Q3 FY26 for Wipro: Revenue Rs 23,555.8 crore (up 5.5% YoY in INR), but net profit falls 7% YoY to Rs 3,145 crore; large deal bookings drop 8.4% to $0.9 billion.
    • Indian IT majors including TCS, Infosys, Wipro, HCL Tech, and Tech Mahindra cut bench strength by 75,000 over past two years, reflecting demand slowdown.
    • MOFSL Q4 preview: TCS expected at 1.5% QoQ CC growth, Wipro at 1%, highlighting sequential deceleration across the board.
    • HCL Tech maintains strong dividend payout of Rs 60 per share (93.6% ratio), providing yield cushion amid sector volatility.

    Wipro’s Sharp Decline Amid Weak Guidance

    Wipro Limited, India’s fourth-largest IT services provider with $11 billion in annual revenue and presence in over 50 countries, has emerged as the epicenter of sector woes. The stock’s tumble to Rs 188.25 in March 2026 underscores investor disillusionment following Q3 FY26 results announced on January 19. Despite topline growth of 5.5% YoY to Rs 23,555.8 crore in INR terms, constant currency revenue contracted 1.2% YoY, exposing reliance on rupee depreciation rather than organic expansion. Net profit slid 3.9% QoQ and 7% YoY to Rs 3,145 crore, with operating margins holding steady at 17.5% but pressured by salary hikes and AI investments.
    The Q4 FY26 guidance proved the decisive blow, projecting IT services revenue between $2,635 million and $2,688 million—implying mere 0-2% sequential growth in constant currency. This fell short of market expectations, triggering a 7% single-session drop. Large deal total contract value (TCV) plummeted 8.4% YoY to $0.9 billion, while overall bookings declined 5.7% to $3.3 billion. These metrics, as leading indicators for revenue four to six quarters out, signal protracted visibility issues. CEO Srinivas Pallia’s AI-first strategy, emphasized since his 2024 takeover, has yet to translate into accelerated wins, leaving solid cash flows of $474 million in Q3 overshadowed.
    Jefferies’ recent underperform rating on Wipro cites slow deal ramp-ups, a mediocre medium-term growth outlook, and earnings risks, with the stock implying a mere 4-6% revenue CAGR over the next decade—lagging peers like TCS and Infosys. At current levels around Rs 191, the 5.6% dividend yield offers some solace, but structural underperformance persists, with a five-year CAGR of -9.24%. Investors looking to participate in this market movement can open demat account through SEBI-registered brokers.

    Broader IT Sector Pressures and Q4 Expectations

    The malaise extends beyond Wipro, engulfing TCS, Infosys, HCL Tech, and others as Q4 FY26 previews paint a cautious picture. MOFSL anticipates TCS to lead with 1.5% QoQ constant currency revenue growth, while Wipro trails at 1%, reflecting uniform deceleration. Bench strength across TCS, Infosys, Wipro, HCL Tech, and Tech Mahindra has shrunk by approximately 75,000 over the past two years, a stark indicator of softening client demand and aggressive utilization optimization. This downsizing, while bolstering near-term margins, raises concerns over scalability if discretionary spending rebounds.
    HCL Tech stands out with robust shareholder returns, disbursing Rs 60 per share in dividends for the recent financial year at a 93.6% payout ratio, underscoring financial discipline amid volatility. However, the sector’s constant currency headwinds persist, with rupee strength eroding INR-reported gains. NIFTY IT’s underperformance against NIFTY 50—down over 10% year-to-date—mirrors BSE Sensex tech weights dragging on broader indices. RBI’s steady policy stance has kept INR stable around 83-84 to the dollar, limiting currency tailwinds that previously masked weaknesses.
    Operational cash flows remain a bright spot, as seen in Wipro’s $474 million Q3 generation, supporting buybacks and dividends. Yet, margin compression from AI upskilling and wage inflation tempers optimism. Analyst consensus points to BFSI and healthcare as pockets of resilience, but enterprise-wide deal softness threatens FY27 visibility. This development presents new considerations for stock investment strategies focused on Indian equities.

    Peer Performance Analysis

    Metric Q3 FY26 Q3 FY25 Change
    Revenue Rs 23,555.8 Cr Rs 22,319 Cr +5.5% YoY
    Net Profit Rs 3,145 Cr Rs 3,379 Cr -7% YoY
    Large Deal TCV $0.9 Bn $0.98 Bn -8.4% YoY
    Operating Margin 17.5% 17.0% Stable
    Current Price vs 52-week High Rs 191 Rs 311 -39%

    Key peers face similar dynamics: TCS is projected for 1.5% QoQ CC growth in Q4; bench cuts contribute to efficiency. Infosys remains aligned with sector bench reduction of 75,000 total while continuing its steady AI push. HCL Tech maintains its Rs 60/share dividend with a 93.6% payout, while Tech Mahindra is part of the bench shrinkage with muted Q4 growth.
    This table highlights Wipro’s relative weakness in deals and profits, while HCL’s payouts provide a defensive edge. Investors note TCS and Infosys’ superior five-year growth track records over Wipro’s lagging CAGR. Retail participation has grown significantly as access to a reliable trading platform has become more widespread.

    Market Outlook

    Looking ahead, Indian IT investors must monitor Q4 earnings for deal ramp-up signals and FY27 guidance, with risks tilted toward further constant currency contraction if US rate cuts delay. AI investments could catalyze recovery, particularly in managed services, but execution gaps remain a hurdle—Wipro’s mixed history amplifies this. NIFTY IT’s valuation at 22-24x FY27 earnings offers entry points for patient capital, yet volatility persists with INR sensitivity and geopolitical tensions. Key watches: large deal TCV revival above $1 billion quarterly, bench stabilization, and RBI interventions stabilizing the rupee. Institutional flows may favor HCL and TCS for yield and growth balance, advising caution on Wipro until underperform tags lift.

    Conclusion

    India’s tech sector stands at an inflection point, with Wipro’s 40% rout emblematic of deeper challenges in growth, deals, and profitability amid a 75,000-strong bench cull. While dividends and cash flows provide ballast, muted Q4 outlooks and peer alignments signal prolonged pressure on NIFTY IT and constituent stocks. For institutional investors, selective positioning in higher-conviction names like TCS and HCL Tech, coupled with vigilance on AI execution and macro cues, will define alpha generation. The sector’s structural pivot to AI offers long-term promise, but near-term risks demand disciplined risk management in this cornerstone of Indian markets.

    Explore Popular Stocks
    SBI Share Price Adani Enterprises Share Price
    HDFC Bank Share Price Larsen & Toubro Share Price
    IRFC Share Price Bharti Airtel Share Price
    Reliance Industries Share Price ONGC Share Price
  • Mumbai Real Estate Surges Past ₹157,758 Cr as DLF Monetizes Assets

    Mumbai Real Estate Surges Past ₹157,758 Cr as DLF Monetizes Assets

    India’s real estate sector enters a critical inflection point as March 2026 closes with mixed signals from the market’s heavyweight players. While Mumbai’s residential market demonstrates robust transaction momentum with over 104,000 deals valued at ₹157,758 crore during the fiscal year ending March 2026, the broader Indian housing market faces unprecedented supply constraints that have pushed sales below 1 lakh units for the first time in 18 quarters. Against this backdrop, major developers including DLF and Godrej Properties are recalibrating their portfolios, with DLF’s ₹710 crore divestment of its Kolkata IT SEZ signaling a strategic pivot toward higher-yielding residential and annuity segments. These developments underscore a market transitioning from speculative growth to disciplined, quality-focused expansion.

    Key Highlights

    • Mumbai residential market averaged ₹38,179 per sq ft with 104,073 transactions generating ₹157,758 crore in gross value during April 2025-March 2026
    • DLF divested Kolkata IT SEZ and 18 acres of land for ₹710.23 crore to Srijan Group-linked entities, signaling strategic asset monetization
    • Indian housing sales dropped below 1 lakh units in Q1 2026, marking the first sub-100,000 quarterly performance in 18 quarters
    • Mumbai Central Suburbs appreciated 9.36% while premium micromarkets like Mumbai South commanded ₹46,342 per sq ft
    • Godrej Properties share price declined 2.21% to ₹1,471.90 as of March 30, 2026, reflecting broader market sentiment amid supply pressures

    Mumbai’s Transaction Boom Masks Underlying Market Tensions

    Mumbai’s real estate market concluded the fiscal year with exceptional transaction volumes that belie deeper structural challenges emerging across India’s residential sector. The 104,073 property registrations valued at ₹157,758 crore represent robust buyer activity, with average registration rates standing at ₹18,150 per sq ft. However, this headline strength masks a critical divergence: while transaction counts remain elevated, the broader Indian housing market has contracted sharply, with Q1 2026 sales tumbling below 1 lakh units for the first time in 18 quarters due to severe supply constraints. The Mumbai market’s resilience reflects its status as India’s premier real estate destination, commanding premium valuations across all property categories. Residential apartments averaged ₹38,179 per sq ft with a modest 1.24% quarterly increase, while commercial shops commanded ₹63,632 per sq ft. The micromarket segmentation reveals pronounced disparities: Mumbai South’s premium positioning generated asking prices of ₹46,342 per sq ft, while Mumbai Central Suburbs demonstrated exceptional appreciation of 9.36%, indicating investor confidence in emerging commercial corridors. Developer activity was concentrated among established players, with Kalpataru and Lodha dominating both transaction volumes and gross values, while JP North and Peninsula Ashok Towers attracted maximum buyer interest with 41 and 20 transactions respectively. The supply-demand dynamics present a nuanced picture. Ready-to-move inventory comprising 17,442 units averaged ₹30,760 per sq ft with a marginal 1.18% decline, while under-construction projects at 2,031 units showed 1.64% appreciation to ₹32,202 per sq ft. This inventory composition suggests developers are strategically managing supply releases, potentially responding to rising construction costs and cautious buyer sentiment outside Mumbai’s premium segments. Investors looking to participate in this market movement can open demat account online through SEBI-registered brokers to access real estate sector equities.

    DLF’s Strategic Pivot Signals Sector-Wide Portfolio Recalibration

    DLF’s ₹710.23 crore divestment of its Kolkata IT SEZ and adjacent 18-acre land parcels to Makalu Builders LLP and Gangapurna Projects LLP represents a calculated strategic repositioning by India’s largest real estate developer. The transaction, completed during the fiscal year’s final quarter, reflects DLF’s deliberate shift away from mature commercial segments toward higher-return residential development and its expanding annuity portfolio comprising commercial and retail properties with stable tenant demand. This asset monetization strategy carries significant implications for investor sentiment. DLF’s market capitalization of ₹1.34 trillion with a trailing P/E ratio between 30.21 and 46.22 positions it as the sector’s dominant player, yet its share price experienced a 3.01% intraday decline to ₹505.50 on March 30, 2026, trading below key moving averages. Market analysts attribute this weakness partly to concerns about whether DLF can effectively balance cash generation from strategic sales with consistent annuity income growth, particularly given its substantial 280 million sq ft development pipeline requiring ongoing capital deployment. The Kolkata market context adds strategic dimension to this divestment. The city is experiencing steady price appreciation in both residential and commercial segments, with areas like New Town and Rajarhat demonstrating strong development momentum. However, the commercial real estate market is bifurcating, with older properties facing obsolescence risk while newer developments command premium valuations. DLF’s decision to exit a mature IT SEZ aligns with this market segmentation, suggesting a broader sector trend toward divesting legacy assets while concentrating capital in higher-growth residential and modern commercial segments. This development presents new considerations for stock investment strategies focused on Indian equities.

    Developer Valuation Metrics and Market Positioning

    Developer Market Cap P/E Ratio Development Pipeline Share Price
    DLF ₹1.34 trillion 30.21-46.22 280 million sq ft ₹505.50
    Oberoi Realty ₹530 billion 28.5-33.63 – –
    Godrej Properties ₹497 billion 28.8-45.62 – ₹1,471.90 (-2.21%)
    Prestige Estates Projects ₹505 billion 48.07-61.00 – –
    The valuation dispersion reflects differentiated investor confidence across the sector. DLF’s premium multiple, despite recent weakness, underscores its market dominance and development scale. Godrej Properties’ recent 2.21% share price decline to ₹1,471.90 mirrors broader sector sentiment, with the company’s P/E range of 28.8-45.62 suggesting market uncertainty regarding earnings visibility amid supply constraints. Prestige Estates Projects commands the highest P/E multiples at 48.07-61.00, indicating investor expectations for superior growth, though this valuation premium carries elevated downside risk if execution falters. Retail participation has grown significantly as access to a reliable trading platform has become more widespread among investors tracking these sector developments.

    Market Outlook

    The Indian real estate sector is projected to navigate a phase of disciplined growth throughout 2026, supported by stable macroeconomic conditions and potential interest rate visibility from the RBI. However, this growth trajectory will be constrained by severe supply limitations that have already compressed housing sales below 1 lakh units quarterly. Demand is expected to remain resilient but highly selective, with institutional and high-net-worth buyers prioritizing price-value alignment, project execution quality, and micromarket fundamentals over speculative momentum. For institutional investors, the current market environment presents a bifurcated opportunity set. Premium developers with established track records, substantial development pipelines, and diversified revenue streams—particularly through annuity portfolios—are positioned to outperform. Conversely, mid-tier developers lacking capital flexibility or concentrated in mature commercial segments face headwinds. The supply constraint, while creating near-term pricing power for established players, may eventually necessitate policy interventions to unlock land availability and accelerate project approvals. Investors should monitor RBI policy signals regarding interest rates, as mortgage affordability remains a critical demand driver despite strong transaction volumes in premium segments.

    Conclusion

    India’s real estate market stands at an inflection point where transaction volumes mask underlying supply constraints and valuation pressures. Mumbai’s ₹157,758 crore transaction value and DLF’s strategic asset monetization exemplify a sector transitioning from growth-at-any-cost to disciplined, quality-focused expansion. The divergence between Mumbai’s robust activity and India’s sub-100,000 quarterly housing sales underscores the concentration of demand in premium segments and established micromarkets. For institutional investors, the investment thesis hinges on developer capital discipline, execution quality, and portfolio diversification rather than sector-wide growth narratives. The next 12 months will prove critical in determining whether supply constraints translate into sustainable pricing power or signal deeper demand weakness requiring policy intervention.
  • India’s GDP Growth to Moderate to 6.5% in FY27 Amid Energy Crisis

    India’s GDP Growth to Moderate to 6.5% in FY27 Amid Energy Crisis

    India’s economic trajectory faces a critical inflection point as multiple headwinds converge to reshape the macroeconomic landscape for fiscal year 2026-27. The ratings agency ICRA has projected GDP growth to moderate to 6.5 percent in FY27, down from an estimated 7.5 percent in FY26, driven primarily by elevated crude oil prices and energy supply disruptions stemming from the West Asia conflict. Simultaneously, the Indian equity market has witnessed unprecedented foreign portfolio investor selling, with FPIs offloading a record ₹1,13,810 crore (approximately $12.3 billion) in March 2026 alone. These developments underscore mounting pressures on inflation, the current account deficit, and currency stability that will shape investment decisions and policy responses in the months ahead.

    Key Highlights

    • India’s GDP growth projected to decelerate to 6.5% in FY27 from 7.5% in FY26, with elevated crude oil prices and energy availability concerns as primary drivers
    • CPI inflation expected to surge to 4.3% in FY27 from 2.1% in FY26, creating headwinds for monetary policy normalization
    • Record FPI outflows of ₹1,13,810 crore in March 2026 mark the worst month for foreign investor flows in Indian equity market history
    • Current account deficit anticipated to widen sharply to 1.7% of GDP in FY27 from 1.0% in FY26, assuming average crude prices of $85 per barrel
    • RBI Monetary Policy Committee expected to maintain extended pause on policy rate cuts despite growth moderation, prioritizing inflation control

    Growth Moderation and Energy Price Pressures

    The deceleration in India’s economic growth trajectory reflects a fundamental shift in the operating environment for the Indian economy. ICRA’s projection of 6.5 percent GDP growth in FY27 represents a meaningful slowdown from the 7.5 percent estimated for FY26, marking a 100 basis point contraction in the growth rate. This moderation is not cyclical in nature but rather structural, rooted in the persistent elevation of global crude oil prices and the associated energy supply disruptions emanating from geopolitical tensions in West Asia. The ratings agency’s baseline assumptions incorporate an average crude oil price of $85 per barrel for FY27. However, the analysis reveals significant downside risks to this assumption. Goldman Sachs’ scenario modeling suggests that if disruptions in the Strait of Hormuz persist beyond mid-April 2026, Brent crude could trade in the $100 to $115 per barrel range through Q4 2026. Conversely, if normalcy is restored by mid-April, prices could moderate to $80 per barrel by Q4 2026. This wide range of outcomes underscores the uncertainty facing policymakers and investors alike. The energy crisis extends beyond crude oil to encompass natural gas and fertilizer supplies, both critical inputs for India’s industrial and agricultural sectors. Gas rationing has already begun affecting multiple industries, signaling that these are not temporary disruptions but rather structural pressures that will persist through the fiscal year. The cumulative impact on input costs across manufacturing and agriculture will likely compress margins for India Inc and dampen investment sentiment.

    Inflation Surge and Monetary Policy Implications

    The inflation outlook presents perhaps the most immediate challenge for the Reserve Bank of India’s monetary policy framework. ICRA projects CPI inflation to trend significantly higher at 4.3 percent in FY27, compared to 2.1 percent in FY26. This represents a 220 basis point increase in the inflation rate, driven primarily by energy price transmission into the broader economy. Goldman Sachs has raised its inflation forecast to 4.6 percent for 2026, signaling that consensus expectations are converging around elevated inflation readings. The inflation dynamics are particularly concerning because they emerge at a time when growth is moderating. This stagflationary environment constrains the RBI’s policy flexibility. While growth deceleration would typically warrant monetary easing, elevated inflation pressures necessitate policy restraint. ICRA expects the RBI Monetary Policy Committee to maintain an extended pause on policy rate cuts throughout FY27, despite the anticipated softening in GDP growth. This represents a significant departure from the rate-cutting cycle that characterized the latter part of FY26. The RBI is expected to continue active liquidity management to support the financial system, but rate cuts appear off the table for the foreseeable future. Goldman Sachs has flagged the possibility of a 50 basis point rate hike, though this remains a tail risk scenario contingent on inflation remaining persistently elevated. For investors, this signals that the era of accommodative monetary policy has concluded, with implications for equity valuations, fixed income returns, and credit growth dynamics.

    Foreign Portfolio Investor Exodus and Currency Pressures

    The March 2026 FPI selling represents a watershed moment for Indian capital markets. Foreign investors offloaded ₹1,13,810 crore of Indian equities during the month, surpassing the previous record of ₹94,017 crore set in October 2024. What distinguishes this episode is its consistency and magnitude. FPIs were net sellers on all 17 trading sessions in March, an uninterrupted selling pattern that signals systematic risk-off behavior rather than routine profit-booking. The confluence of three factors triggered this unprecedented exodus. First, the US-Iran conflict initiated a global risk-off move that prompted foreign investors to reduce exposure to emerging markets. Second, crude oil prices surging above $100 per barrel raised acute concerns about India’s inflation trajectory and current account sustainability. Third, rupee weakness to approximately 94.60 per dollar created a vicious feedback loop where FPI selling weakened the currency, which in turn incentivized further exits as dollar-denominated returns deteriorated. The rupee depreciation reflects the structural challenges facing India’s external account. The current account deficit is projected to widen to 1.7 percent of GDP in FY27 from 1.0 percent in FY26, assuming the baseline crude price scenario. ICRA’s analysis indicates that every $10 per barrel increase in crude oil prices widens the current account deficit by 30-40 basis points. At current price levels, this implies significant pressure on the rupee unless offset by capital inflows or policy intervention. The March FPI outflows, which accounted for approximately 90 percent of total 2026 FPI outflows through March, underscore the challenge of financing the widening current account deficit.

    Market Outlook

    The outlook for Indian financial markets and the broader economy hinges critically on the trajectory of global crude oil prices and the duration of West Asia geopolitical tensions. A rapid de-escalation could provide meaningful relief, with crude prices moderating to $80 per barrel and inflation pressures easing. However, the base case scenario assumes persistence of elevated prices and energy supply concerns, implying continued pressure on growth, inflation, and the external account. For institutional investors, the investment implications are multifaceted. Equity valuations face headwinds from both growth deceleration and multiple compression as the RBI maintains policy restraint. However, consumption trends have remained supported by GST rate rationalization and festive demand, suggesting that domestic-focused sectors may outperform. The widening current account deficit and rupee weakness create currency risks for foreign investors, though they may benefit domestic exporters. This development presents new considerations for stock investment strategies focused on Indian equities. Fixed income investors should anticipate a prolonged pause in rate cuts, with yields likely to remain elevated as the RBI prioritizes inflation control. Retail participation has grown significantly as access to a reliable trading platform has become more widespread, though the current market conditions require careful navigation of elevated volatility and uncertainty. The consumption data warrants careful monitoring. While overall consumption remains steady, growth in spending has been driven partly by lower-value transactions, with credit card volumes rising faster than transaction values. This suggests that discretionary spending trends may face headwinds if inflation erodes purchasing power and consumer sentiment deteriorates amid heightened uncertainty. Investors looking to participate in this market movement can open demat account through SEBI-registered brokers to access opportunities as market dynamics evolve.

    Conclusion

    India’s economic narrative is undergoing a significant recalibration as structural headwinds from the energy crisis and geopolitical tensions reshape growth and inflation dynamics for FY27. The 6.5 percent GDP growth projection, while still respectable by global standards, represents a meaningful deceleration from the 7.5 percent estimated for FY26. More concerning is the inflation surge to 4.3 percent, which constrains the RBI’s policy flexibility and signals an extended pause in monetary easing. The record FPI outflows in March and associated rupee weakness underscore the vulnerability of India’s external position to global risk sentiment and commodity price shocks. Investors must recalibrate their expectations around growth, inflation, and monetary policy while remaining vigilant to developments in West Asia that could either alleviate or exacerbate these structural pressures.