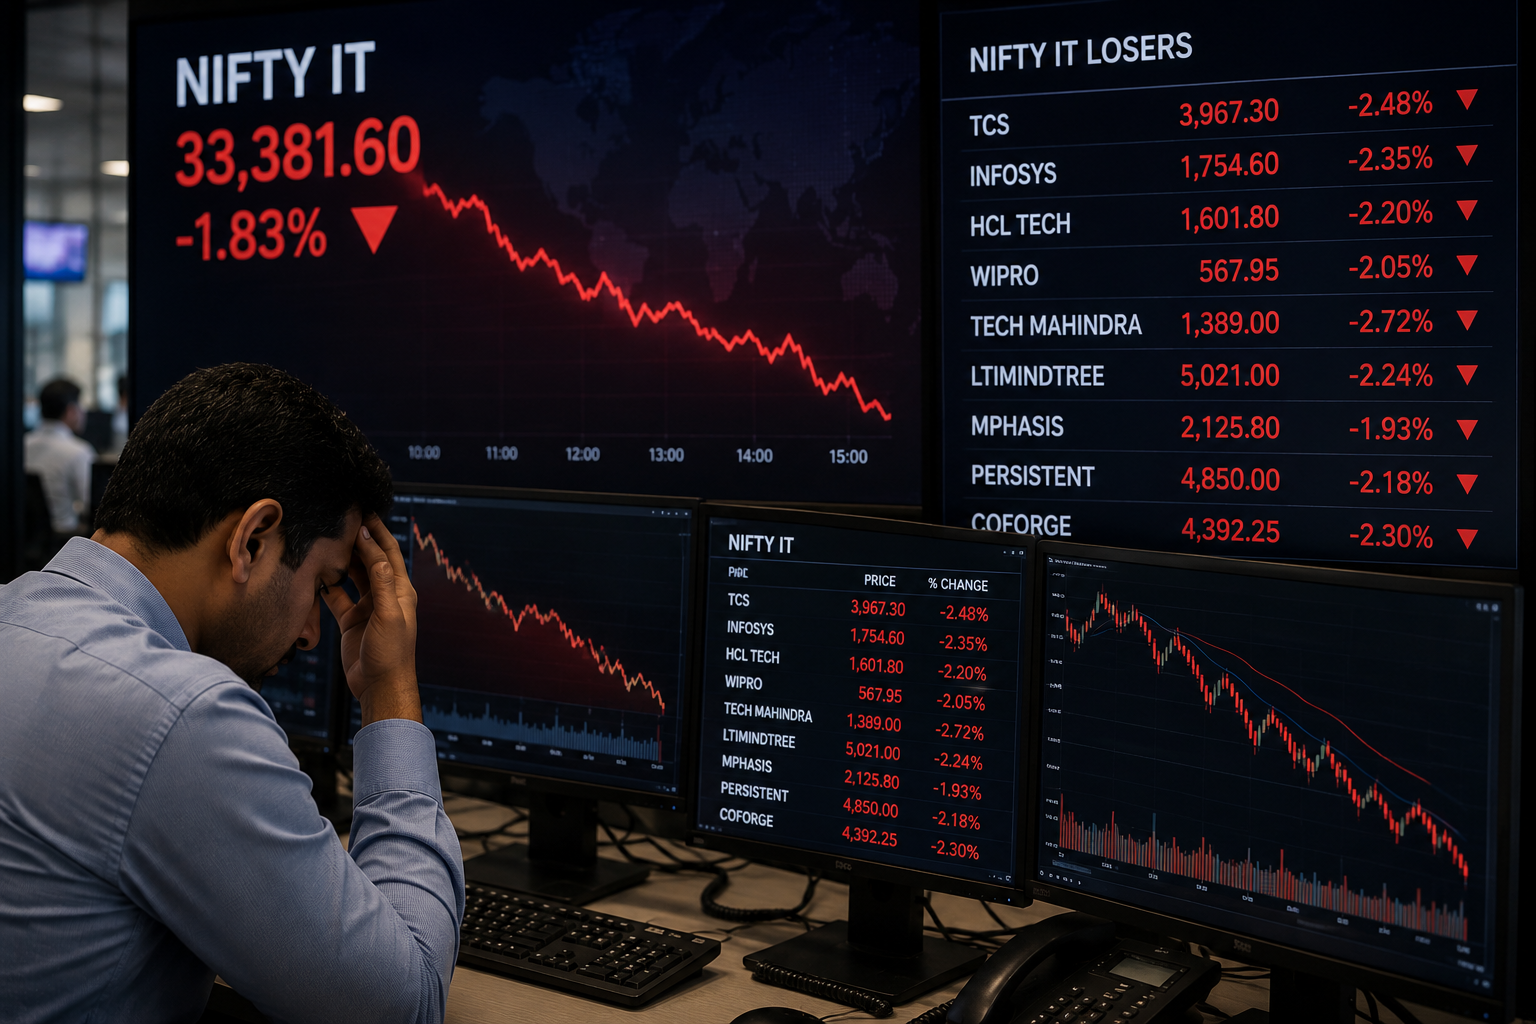
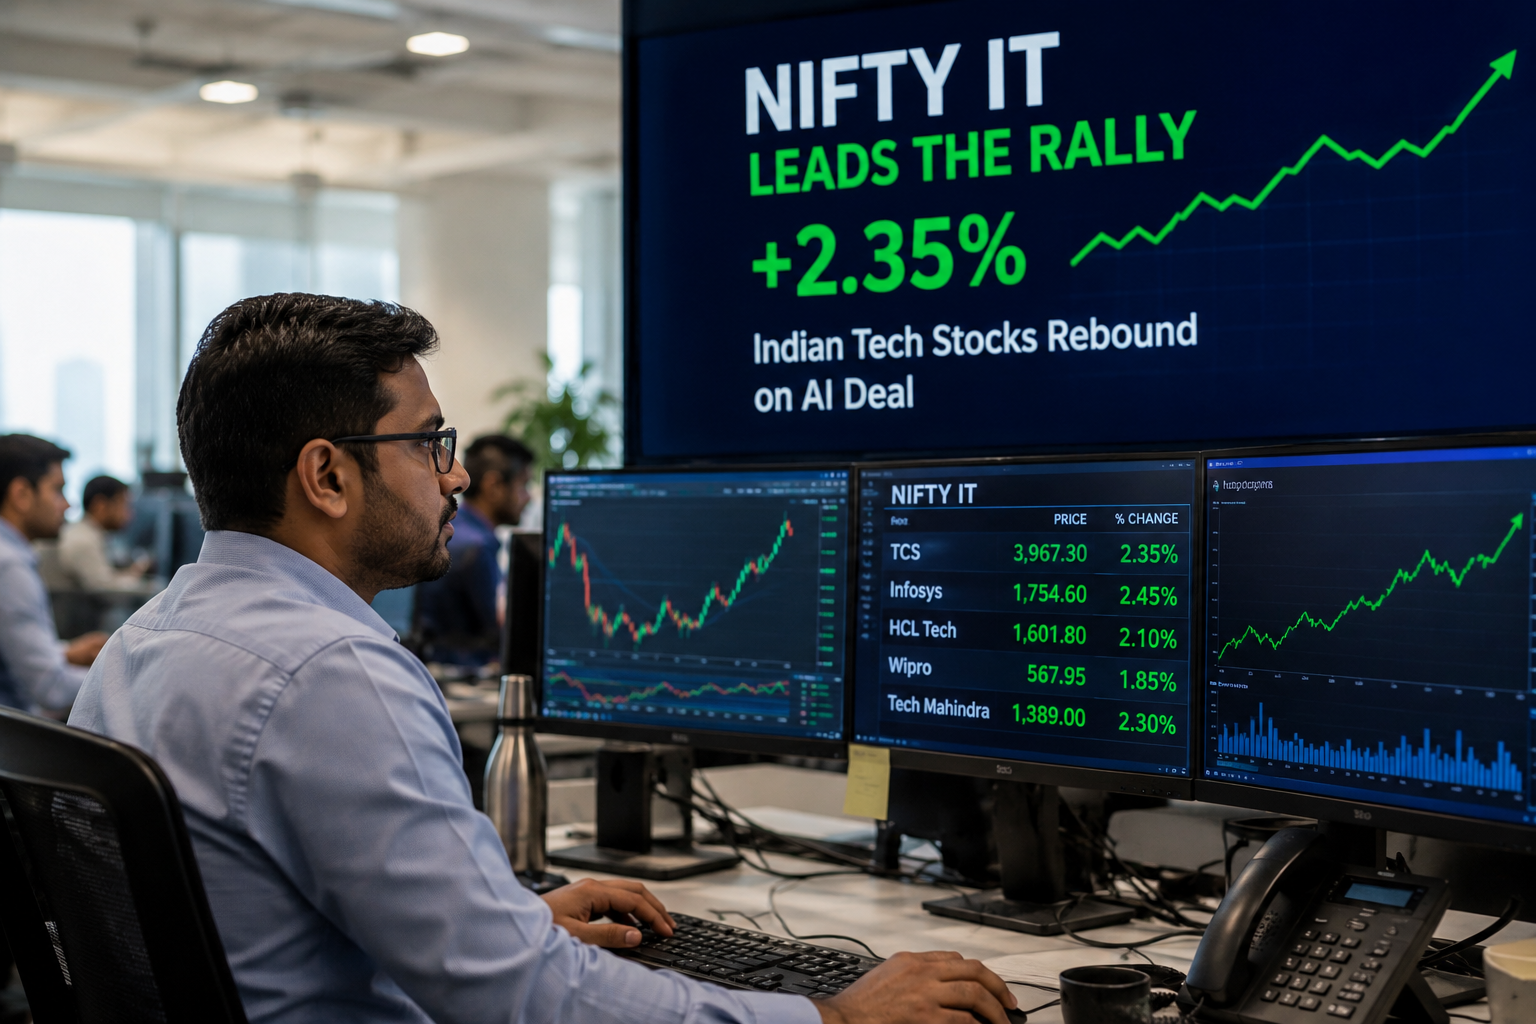
findocblog

Blog

  • What Is SENSEX?

    What Is SENSEX?

    SENSEX is one of the most widely followed indicators of the Indian stock market and reflects the overall performance of the country’s equity space. It is a benchmark index that tracks 30 large, financially strong companies listed on the Bombay Stock Exchange (BSE), representing key sectors of the Indian economy. When investors look for the meaning of SENSEX, they are essentially seeking insight into broader market direction and investor sentiment. The term SENSEX stands for Sensitive Index, highlighting how closely it responds to movements in share prices, economic developments, corporate results, and global events.

    Due to its sensitivity and wide representation, SENSEX is often used as a reliable gauge of market trends and economic confidence in India.

    History and Evolution of the SENSEX Index

    The history of SENSEX dates back to 1986, when it was introduced by the Bombay Stock Exchange. At the time, it was India’s first stock market index designed to provide a clear snapshot of market performance.

    In its early years, SENSEX used a simple market capitalisation method. As the market evolved, the index methodology was refined to better reflect real market conditions. A major milestone in the SENSEX evolution came in 2003, when the calculation method shifted to free-float market capitalisation.

    How SENSEX Is Linked to the Bombay Stock Exchange (BSE)?

    SENSEX is closely connected to the Bombay Stock Exchange and functions as its flagship index. Often referred to as BSE SENSEX, it represents the performance of select companies listed and traded on the exchange. This relationship explains how SENSEX reflects trends within the broader SENSEX share market:

    • Exclusive BSE listing: Only companies listed on the Bombay Stock Exchange are eligible for inclusion in SENSEX, reinforcing its direct association with the exchange.
    • Index governance by BSE: The BSE oversees the composition, calculation methodology, and periodic review of the index to ensure accuracy and relevance.
    • Market performance indicator: Movements in SENSEX capture price changes in 30 large and influential companies, offering a snapshot of overall market sentiment.
    • Reflection of broader trends: As these companies span key sectors, their performance often mirrors wider developments across the Indian equity market.

    Through this structure, SENSEX serves as a reliable reference point for understanding market direction and investor confidence.

    Composition of SENSEX: The 30 Companies That Form the Index

    SENSEX is made up of 30 companies that rank among the top Indian companies in terms of size, liquidity, and market influence. These SENSEX companies are drawn from a wide range of sectors, including banking, information technology, energy, consumer goods, pharmaceuticals, and manufacturing. Their collective performance provides a balanced view of the Indian equity market.

    Key characteristics of SENSEX companies include:

    • Strong market capitalisation
    • High trading liquidity
    • Established operating and financial history
    • Significant representation of core economic sectors

    The composition of SENSEX is reviewed periodically and may change to remain relevant. The criteria for SENSEX selection are applied to ensure fairness, transparency, and accuracy, including:

    • Mandatory listing on the Bombay Stock Exchange
    • Consistent trading volumes and liquidity
    • Large free-float market capitalisation
    • Sectoral balance within the index
    • A proven compliance and governance record

    These selection criteria help preserve SENSEX as a reliable and credible market benchmark.

    How SENSEX Is Calculated and Why the Methodology Matters?

    To calculate the SENSEX, the Bombay Stock Exchange uses the free-float market capitalisation method. This approach considers only those shares that are available for public trading, while excluding promoter holdings, government stakes, and other restricted shareholdings. As a result, the index reflects actual market participation rather than total company ownership.

    The importance of SENSEX lies in this calculation methodology, as it ensures a more accurate representation of market movements. By focusing on free-float shares, the index avoids distortion caused by large but infrequently traded holdings.

    Free-float market capitalisation refers specifically to the portion of a company’s equity that is actively traded in the open market. Its use in SENSEX calculation helps to:

    • Reflect real-time market activity more effectively
    • Reduce the overrepresentation of closely held companies
    • Improve comparability across different sectors and firms

    This methodology aligns SENSEX with global best practices followed by major international indices.

    Why SENSEX Matters: Its Economic Importance and Market Impact

    SENSEX

    The economic impact of SENSEX goes well beyond daily stock price movements. Changes in the index influence investor confidence, market sentiment, and broader financial discussions, often shaping expectations around growth and stability. A consistently rising index is commonly associated with economic optimism, while sustained declines may reflect underlying concerns within the economy.

    The importance of SENSEX also stems from its role as a widely accepted benchmark. Fund managers, analysts, and institutional investors rely on it to assess portfolio performance and compare returns across investment products.

    SENSEX is frequently viewed as a barometer of the Indian economy, as it reflects investor perceptions of key factors such as:

    • Corporate earnings and profitability
    • Inflation trends and interest rate expectations
    • Government policies and economic reforms
    • Overall growth prospects

    When economic conditions are favourable, improved corporate performance is often mirrored in a stronger SENSEX. Conversely, economic uncertainty typically leads to higher volatility in the index.

    Ways to Invest in SENSEX: Investment Options Explained

    Investors cannot directly purchase the SENSEX index, but they can invest in SENSEX through financial products designed to track its performance. These options provide exposure to the broader market without requiring the selection of individual stocks.

    Common ways to invest in SENSEX include:

    • SENSEX ETF: Exchange-traded funds that replicate the index and are bought and sold on stock exchanges like regular shares
    • Index mutual funds: Funds structured to mirror SENSEX returns over the long term by holding the same constituent stocks

    To access these investment options, investors need a trading and demat setup, and many choose to open demat account online for faster onboarding and seamless participation in the equity market. These options are often preferred for their diversification, transparency, and cost efficiency compared to actively managed funds.

    Understanding SENSEX Trends and Market Movements With Findoc

    Monitoring SENSEX market trends allows investors to see how various factors influence the Indian stock market. Key influences include:

    • Changes in interest rates and monetary policy
    • Corporate earnings reports and performance
    • Government regulations and policy announcements
    • Global economic developments and geopolitical events

    Through SENSEX analysis with Findoc, these market movements are broken down in a structured and clear manner. This approach helps investors:

    • Interpret index fluctuations without confusion
    • Identify patterns and trends in the SENSEX share market
    • Make better and more disciplined investment decisions

    By understanding these trends, investors can align their strategies with prevailing market conditions and long-term economic outlooks.

    Conclusion

    SENSEX continues to be a vital indicator of the Indian stock market and investor sentiment. Since its inception in 1986, it has evolved into a benchmark that reflects the performance of major companies across key sectors of the economy. Understanding how SENSEX is constructed, how it responds to market movements, and its broader significance helps investors make better decisions.

    Beyond tracking share prices, it provides insights into economic trends and market confidence, making it an essential reference for both new and experienced participants in India’s equity markets.

    Frequently Asked Questions

    SENSEX companies are reviewed periodically by the BSE to ensure the index reflects the market accurately. Changes are made based on liquidity, market capitalisation, sector representation, and performance of listed firms.

    SENSEX tracks 30 leading companies listed on the Bombay Stock Exchange, whereas NIFTY tracks 50 major companies on the National Stock Exchange, serving as distinct benchmarks for the Indian stock market.

    Investors cannot buy the SENSEX directly. However, exposure is possible through SENSEX ETFs or index mutual funds, which replicate the index’s performance and offer diversified market participation.

    SENSEX movements are influenced by corporate earnings, macroeconomic data, interest rate changes, government policies, and global events, reflecting overall investor sentiment and expectations about the Indian economy.

    While SENSEX comprises large-cap companies, it provides market insights relevant to all investors, helping assess trends, benchmark portfolios, and understand the broader health of the Indian equity market.

    Global developments such as economic trends, geopolitical events, and international market fluctuations impact investor sentiment, often leading to volatility in SENSEX and influencing trading behaviour in the Indian share market.

  • Budget 2026 Highlights: What Every Indian Needs to Know Right Now

    Budget 2026 Highlights: What Every Indian Needs to Know Right Now

    Budget 2026 comes at a vital moment as India tries to balance its growth ambitions with global economic uncertainty. Finance Minister Nirmala Sitharaman will present this key Union Budget on February 1st at 11:00 AM. Her proposals aim to drive economic growth, enhance self-reliance, and protect India’s economy from external pressures like US tariffs and geopolitical tensions.

    This year’s union budget stands out because it pushes forward the vision of ‘Viksit Bharat’ while tackling current economic challenges. Some positive changes are already visible. The Income-Tax Bill 2025 has cut down the number of sections from 819 to 536, which makes compliance easier and clearer. The budget might also bring new incentives that encourage taxpayers to switch to the new income tax regime. Your financial planning and tax situation could change a lot if you have a salaried job. This piece breaks down what you need to know about the upcoming budget and how it will disrupt the economy and your money management.

    Why Budget 2026 Matters More Than Ever

    India’s fiscal world has changed dramatically since the pandemic. Budget 2026 marks a crucial point in the nation’s economic experience. Previous years focused on recovery, but this budget sits at the crossroads of achieved stability and ambitious growth targets. This makes it more relevant than ever before.

    A change from recovery to resilient growth

    Budget 2026 marks a fundamental change in India’s economic story. The country has moved beyond post-pandemic recovery measures to build long-term resilience. This isn’t just about words. The central government has cut its deficit by half since the pandemic. S&P’s sovereign outlook and rating upgrade in 2025 shows growing international trust in India’s fiscal direction.

    Numbers back up this development toward resilient growth. India managed to keep impressive economic momentum with real GDP growth projected at 7.4% in FY26. Private final consumption expenditure grew at 7%, while investment growth reached 7.8%. These numbers show a stronger economic foundation that enables bolder plans.

    Notwithstanding that, the path to resilient growth faces obstacles. Global interest rate swings, export pressures from geopolitical tensions, and the constant need for job creation pose major challenges. The budget must protect domestic growth from these external pressures through strategic policy actions and future-focused investments.

    Balancing fiscal discipline with economic ambition

    Budget 2026’s core challenge lies in balancing fiscal prudence with economic stimulus. Analysts expect continued focus on fiscal consolidation. They predict support for capital expenditure while keeping deficit reduction on track. Market sentiment often responds directly to how well the government sticks to its fiscal deficit plans.

    The government should hit its FY26 fiscal deficit target despite slower nominal growth and weaker tax collections. This achievement would stand out since the fiscal run rate in the first eight months of FY26 shows revenue pressure. The fiscal deficit reached 62.3% of the annual target during April–November. A revenue shortfall of Rs 1.1–1.2 trillion (0.2–0.3% of GDP) means the government will likely cut spending rather than relax deficit goals.

    FY27 Budget will likely focus more on the debt-to-GDP ratio as the main fiscal measure. The government wants to reduce its debt to around 50% of GDP by FY31 from about 56.1% in FY26. The fiscal deficit could drop to about 4.3% of GDP from an estimated 4.4% in FY26.

    Capital expenditure has jumped despite these limits—growing 28% year-on-year in the first eight months of FY26. This shows the government’s dedication to growth-focused spending while keeping fiscal discipline. Investors and markets see this balanced approach as a sign of better fiscal health. This can attract foreign investment and boost sovereign credit ratings and currency stability.

    Budget 2026 explains more than just numbers. It serves as a strategic blueprint that lines up national goals with fiscal reality during unprecedented global economic changes.

    Income Tax Changes: What You Need to Know

    Budget 2026 will bring targeted changes to the income tax world after last year’s big overhaul. The new Income-Tax Act, 2025 starts from April 1, and taxpayers should expect careful adjustments rather than major changes to the tax structure.

    Expected tweaks in the new tax regime

    Budget 2026 wants to take a practical approach that puts growth ahead of big policy changes. The 2025 reforms have moved the focus toward making compliance easier while keeping things stable.

    Tax experts say India’s system no longer makes frequent changes but moves toward “stability, simplicity, and trust”. This lines up with the government’s bigger plan to make tax laws shorter and reduce disputes.

    The budget won’t likely change tax slabs much since Budget 2025 already gave substantial relief. Market watchers are looking out for policies that boost long-term investment and capital flows as the budget might move from consumption to investment focus.

    Standard deduction and slab updates

    People are watching the standard deduction limits closely. The current caps are ₹75,000 under the new tax regime and ₹50,000 under the old one. Many want these limits raised to help with inflation and rising costs.

    Most experts predict the standard deduction will go up from ₹75,000 to ₹1 lakh. Some groups support an increase to ₹1.5 lakh. This change would help salaried employees who face higher living and working costs.

    Other likely updates include:

    • The LTCG tax-free limit might rise from ₹1.25 lakh to ₹2 lakh to encourage long-term investing
    • Better health insurance deductions under Section 80D because medical costs are rising at 11-14%
    • New home loan interest benefits, especially to help first-time buyers

    Making income slabs wider could work better than cutting rates because more taxpayers would benefit. On top of that, experts want the government to let people claim NPS self-investment deductions under the new tax regime.

    TDS rationalization and compliance simplification

    Budget 2026 should make TDS rates and categories simpler with fewer slabs. India’s current withholding tax rules are complex with too many TDS rates for different transactions.

    The budget will likely explain how to switch to the new Income Tax Act, 2025 with clear rules and FAQs. This guidance matters because the new act cuts down sections from 819 to 536 to make things clearer.

    The government will focus on making tax laws simpler and creating faster ways to solve disputes. Digital tax processes have made things more transparent, but assessment speeds still need improvement.

    These changes aim to help people follow tax rules better and get faster assessments that make taxes easier for everyone.

    Support for the Middle Class and Salaried Individuals

    Middle-class Indians watch budget announcements closely since these affect their household finances directly. The upcoming union budget of India 2026 wants to provide meaningful relief to salaried people who don’t deal very well with inflation and rising living costs. This budget aims to address their immediate money concerns.

    Relief measures for disposable income

    Changes in tax slabs, deductions, and exemptions in the income tax union budget affect millions of workers’ take-home salary. Salaried employees might see higher net income in their bank accounts if the government eases taxes or increases standard deductions, as predicted.

    Budget 2026 should increase the standard deduction from the current ₹75,000 to at least ₹1 lakh under the new tax regime, according to experts. This adjustment would boost taxpayers’ disposable income right away and help them manage inflation. Salaried taxpayers also hope to see:

    • Revised HRA exemption limits that match current rental realities, especially in Tier-2 cities where rents now match metro rates
    • Higher home loan interest deduction of ₹5 lakh instead of the current ₹2 lakh cap that hasn’t changed despite rising property prices
    • Better health insurance deductions with medical inflation at 11-14%

    Senior citizens might see a targeted increase in their interest income exemption. The current ₹50,000 exemption limit doesn’t cover rising costs adequately. Budget 2026 could ease this by doubling the threshold to ₹1,00,000 and linking it to the Consumer Price Index.

    Joint taxation proposals for couples

    Budget 2026’s most innovative proposal introduces an optional joint taxation system for married couples. The Institute of Chartered Accountants of India (ICAI) suggests letting spouses file a single consolidated income tax return by combining their incomes.

    Married couples now must calculate and pay taxes separately, even though they share household incomes and expenses. This system creates unfair situations, especially for single-income families where one spouse pays full tax while the other spouse’s basic exemption and slab benefits remain unused.

    The proposed framework would assess combined income under a distinct tax slab system. ICAI suggests doubling the basic exemption limit under joint taxation, with no tax up to ₹8 lakh. Tax slabs would grow with combined household income, and the top rate of 30% would apply to income above ₹48 lakh.

    This approach better reflects modern household economics and a household’s ability to pay tax, rather than focusing only on individual earnings.

    Impact on savings and investments

    Budget 2026 will without doubt shape how middle-class Indians save and invest. Recent tax relief measures have increased disposable income, which supports long-term savings and investments. The Budget often adjusts rules around popular saving schemes like PPF, NPS, SSY, and fixed deposits.

    Many taxpayers who switched to the new tax regime found themselves with higher post-tax income. They now have more freedom to invest based on priorities rather than tax-saving compulsions. Pankaj Mathpal, Founder of Optima Money Managers, explains: “Taxpayers opting for the new tax regime are left with higher post-tax income, giving them greater flexibility to invest as per their preferences rather than being driven by tax-saving compulsions”.

    This flexibility brings a challenge: without tax-saving deductions pushing them, some taxpayers might reduce or stop investing completely. This could affect their long-term financial security. The budget must balance immediate relief with incentives that encourage smart long-term financial planning.

    MSMEs and Startups: A Push for Innovation

    Small businesses and startups are the foundations of India’s economic engine. They create 80% of jobs in companies with less than Rs 1 crore PAT. Budget 2026 acknowledges their vital role by introducing targeted measures to tap into innovation potential and solve the problems these enterprises face.

    PLI schemes and credit access

    The MSME sector faces a massive unmet credit gap of around ₹80 lakh crore. Budget 2026 takes concrete steps to improve financing access. The Credit Guarantee Fund Trust for Micro and Small Enterprises (CGTMSE) has made great progress by approving over 1.7 million guarantees worth more than ₹2 lakh crore in FY 2023-24. We have a long way to go, but we can build on this progress.

    Budget’s vital update expands credit guarantee frameworks beyond traditional asset-backed models. The upcoming budget proposes to modernize these mechanisms by:

    • Extending coverage limits and simplifying claim settlement processes
    • Moving toward cashflow-based lending rather than static balance-sheet assessments
    • Creating a dedicated Budget allocation to expand the MSME credit guarantee corpus

    Industry experts point out that access to credit remains fragmented, especially for early-stage businesses. The budget wants to introduce clearer guidelines for lenders. Bharath Krishna Rao of Emobi notes that “although central government schemes such as CGTMSE, MUDRA and PMEGP are intended to improve access to credit, their effectiveness remains limited due to continued collateral requirements imposed by banks and NBFCs”.

    Simplified compliance and tax clarity

    Budget 2026 focuses heavily on Employee Stock Option Plans (ESOPs) tax treatment. All but one of these 1.59 lakh DPIIT-recognized startups don’t qualify for the 2020 ESOP tax deferment window – only 4,000 do. Nasscom has asked to extend this benefit to all DPIIT-recognized startups, not just those certified by the Inter-Ministerial Board.

    Nasscom has also requested to allow ESOP costs as deductible under section 37 of the Income Tax Act. This would make equity-based compensation more viable for young companies. ESOPs currently face double taxation – first as a perquisite when options are exercised, and again as capital gains when shares are sold.

    Budget 2026 tackles angel tax legacy cases that still hold back startup growth despite its abolition in July 2024. Many founders still struggle with unresolved tax demands that create operational and financial strain. TravelKhana’s Pushpinder Singh highlighted that “despite the law’s removal, his startup still faces an outstanding INR 2.3 crore penalty”.

    Deep-tech and R&D incentives

    The Research, Development and Innovation (RDI) Scheme leads innovation support in Budget 2026. This initiative has a INR 1-lakh-crore corpus that provides long-term, economical solutions for private-sector R&D in sunrise domains including AI, quantum technologies, and advanced materials.

    The Department of Science & Technology says this scheme will spark up to INR 10 lakh crore in private deep tech investment. They expect 5-10 globally competitive deep tech companies to emerge over the next 10-15 years. This shows a shift from grant-based support to a complete innovation financing architecture.

    Budget 2026 has these proposals for semiconductor and deep-tech firms:

    • Introducing a 200% weighted tax deduction on R&D expenditure for the ESDM sector
    • Expanding the Design Linked Incentive (DLI) scheme by increasing its fiscal cap fourfold, from Rs 15 crore to Rs 60 crore
    • Establishing IP commercialization pathways through prototype grants and patent-linked incentives

    Venture investors want DPIIT startup recognition extended from 10 to 15 years for deep-tech companies. Artha Venture Fund’s Anirudh A. Damani explains that companies losing DPIIT recognition “effectively blocks them from domestic institutional capital at the exact stage when they are becoming commercially relevant”.

    Budget 2026 marks a strategic shift from supporting mere scale to enabling depth in India’s innovation ecosystem. The country is moving beyond incremental progress to establish itself as a global digital superpower.

    Digital India and AI: The Next Frontier

    The 2026 union budget shows India’s significant commitment to AI capabilities, highlighting the government’s push toward digital leadership. India now stands as the world’s third-largest digital economy. The country’s technology investments have moved beyond simple digitization to innovative technology that will define its competitive future.

    AI infrastructure and sovereign compute

    The IndiaAI Mission has received a bigger boost in Budget 2026, building on its original allocation of ₹10,371 crore spread across five years. While the mission has deployed 38,000 GPUs, experts note that we just need four times more than this original supply from last year.

    Finance Minister Nirmala Sitharaman will likely announce new investments in data centers. These facilities are now considered crucial national assets, much like roads and airports. Industry leaders suggest:

    • Tax holidays tied to capacity and green energy goals
    • Better GST input tax credit on capital assets
    • Relief on customs duty for AI infrastructure imports

    Budget 2026 aims to spread AI infrastructure beyond big cities. Experts recommend setting up at least 20 AI Centers of Excellence in tier-2 and 3 cities. This approach creates local innovation hubs instead of limiting talent to Bengaluru and Hyderabad.

    Public data access for LLMs

    Budget 2026 focuses on making government data accessible to more people to support India’s sovereign AI development. Global language models currently show Western bias because we trained them mostly on data from the US and Europe. This bias often misses India’s rich cultural context and diverse languages.

    The government plans to treat data and computing infrastructure as a public resource. Developers can now access local language datasets like Bhashini and AI Kosh through the India AI Mission. Yet experts say we just need more detailed data access to build models that truly reflect Indian realities.

    Digital trust and cybersecurity investments

    Budget 2026 sets aside ₹782 crore for cybersecurity projects to protect India’s digital public infrastructure. This investment recognizes that our growing digital interactions mean we just need stronger privacy and security frameworks.

    The government has strengthened protection through detailed regulations, including:

    • The Digital Personal Data Protection Act (2023)
    • The IT Act (2000) that established CERT-In as the national incident response agency
    • AI Governance Guidelines emphasizing transparency, accountability, and user protection

    Experts suggest Budget 2026 should encourage investment in advanced threat intelligence, AI-based cybersecurity platforms, and stronger public-private partnerships. As India builds its AI capabilities, we must embed security-by-design and privacy-by-default standards into all publicly funded technology projects to maintain trust in the digital economy.

    Green Energy and Sustainability Goals

    Budget 2026 shows a fresh push toward India’s green future with a big boost in funding for eco-friendly energy. The government has bumped up green energy funding by 53% to Rs 26,549.38 crore, deepening their commitment to reach 500 GW of non-fossil capacity by 2030.

    Incentives for clean energy and EVs

    This year’s budget brings good news for the electric vehicle sector. Industry leaders expect changes in Production-Linked Incentives (PLI) for EVs and advanced automotive parts, along with tax benefits for research and development. These changes will help reduce dependency on imported technologies, boost local production, and ended up cutting crude oil imports to save foreign exchange.

    The PM E-DRIVE scheme for EV subsidies remains a key focus in Budget 2026. It now targets areas where electric vehicles make the biggest environmental difference – public transport, shared rides, commercial fleets, and last-mile delivery services. The government plans to keep EVs tax-friendly compared to regular vehicles, including benefits for charging stations and battery swapping services.

    Local manufacturers might get some relief through simpler tax structures and lower rates on EV components. The industry wants the government to remove provisional duty rules and make Special Valuation Branch norms easier for imports from related parties. This would help streamline their supply chain.

    Sustainable manufacturing and ESG focus

    Budget 2026 takes an integrated approach to green manufacturing and ESG principles. Better fiscal support for solar and renewable capacity expansion, among other incentives for energy storage systems (ESS), will help stabilize the power grid and allow more clean energy usage.

    New policies will likely boost local manufacturing of solar modules, batteries, and clean-energy parts. Companies will get incentives to secure critical minerals and reduce imports. Industry players want PLI benefits to cover the entire energy storage ecosystem, including anode and cathode production.

    A groundbreaking proposal suggests creating a national green finance institution or special fund. This would help expand EV manufacturing zones and renewable energy projects by bringing in long-term capital. Tax breaks and GST benefits for green buildings will encourage people to adopt energy-efficient designs and green construction practices.

    Water and energy efficiency in data centers

    AI has sparked massive growth in data centers, where power and electrical infrastructure now make up 35-45% of capital costs. Budget 2026 tackles this issue through faster depreciation rules, access to sovereign green bonds, and rewards for using renewable energy.

    Data centers use enormous amounts of power and water. A typical 1 MW facility needs about 68,500 liters of water daily with current cooling systems. Industry experts want 25-35% grant support for green technologies like heat-recovery, economizers, closed-loop cooling, and on-site battery storage in data centers that meet specific Power Usage Effectiveness (PUE) and water-use targets.

    The budget will likely require companies to publicly share their PUE numbers, quarterly KPI reports, and follow Bureau of Energy Efficiency guidelines. This turns sustainability reporting from just paperwork into real operational practice.

    Sectoral Highlights: What’s Changing Across Industries

    The union budget of India 2026 goes beyond economic targets by introducing targeted sectoral initiatives that will reshape key industries. The budget expresses a clear strategy to tackle industry challenges while pushing forward national priorities.

    Healthcare and medtech

    The budget allocates ₹1,250 crore to build three medical device parks in Himachal Pradesh, Tamil Nadu, and Uttar Pradesh. These parks will reduce India’s dependence on imports, which currently supply 80% of medical equipment needs. The Production Linked Incentive scheme now covers 53 critical APIs with ₹6,940 crore to strengthen pharmaceutical manufacturing.

    Both patients and healthcare professionals will benefit from a simplified 18% GST rate that replaces the complex previous structure. The budget also sets aside ₹225 crore to blend telemedicine platforms with the Ayushman Bharat Digital Mission.

    Education and skilling

    Skill development is the life-blood of this budget’s educational focus. The PM-SHRI scheme will add 15,000 more schools that blend National Education Policy elements with traditional learning. Universities working on emerging technologies will receive ₹2,000 crore to boost higher education.

    Digital learning becomes more affordable as platforms now have zero-rated GST status. The National Digital Library has grown to include over 80 million books and resources. An extra ₹500 crore will help expand content in regional languages.

    Real estate and housing

    The budget allocates ₹25,103 crore to the Pradhan Mantri Awas Yojana-Urban to aid affordable housing construction. A new framework supports rental housing by giving infrastructure status to rental projects worth over ₹35 crore.

    Home buyers can claim ₹1.5 lakh additional interest deduction on home loans until 2028. The ₹10,000 crore Urban Infrastructure Development Fund will enhance facilities in Tier-2 and Tier-3 cities.

    Defense and space tech

    Domestic manufacturers will receive 75% of the ₹1.50 lakh crore defense procurement budget. The Indian Space Research Organization gets ₹12,543 crore to advance Gaganyaan and the upcoming Venus orbiter mission.

    New production units in defense manufacturing will enjoy a 5-year tax holiday. These steps arrange with India’s goal to become a net defense exporter by 2032.

    How Budget 2026 Impacts You as an Investor

    Your financial planning depends heavily on budget policies, making it crucial to understand India’s union budget 2026.

    Stock market reactions and volatility

    Budget Day creates significant market volatility as investors respond to policy announcements. Market trends over time are driven by earnings growth, investment cycles, and macroeconomic stability rather than temporary budget fluctuations. Financial experts predict a pragmatic approach that will prioritize growth continuity instead of major policy changes for Budget 2026.

    Sectors to watch post-budget

    The budget’s impact will be significant on infrastructure, manufacturing, agriculture, consumption, and technology-linked sectors. These areas become more relevant as the government balances fiscal discipline against stimulus measures following recent GST adjustments. The potential elimination of non-tariff barriers and increased openness to Foreign Direct Investment could reshape various sectors.

    Long-term investment strategies

    Smart investors should line up with structural growth themes instead of reacting to short-term market movements. Budget 2026 is a chance to boost India’s investment appeal through predictable regulation and reduced transaction costs. Building wealth requires smart selection from the many investment options available.

    Stay updated with the latest Finance and Fintech news through Findoc’s WhatsApp Channel as market experts examine how Budget 2026 maintains the balance between fiscal prudence and growth goals.

    Conclusion

    Budget 2026 marks a defining moment in India’s economic journey. The government wants to balance fiscal discipline with ambitious growth targets while handling global headwinds. India’s economic position on the world stage shows maturity as policies move from recovery focus to building resilience.

    Everyday citizens will see the biggest impact through income tax reforms. Major changes seem unlikely after last year’s substantial updates. However, thoughtful adjustments to standard deductions and potential joint taxation options for couples could boost disposable income for millions of people. Tax filing will become easier for both individuals and businesses through simpler compliance mechanisms.

    MSMEs and startups will get better credit access through stronger guarantee frameworks and easier compliance rules. A new Research, Development and Innovation Scheme with its large corpus will transform India’s innovation landscape, especially for deep-tech ventures. The government’s massive AI infrastructure investments show its dedication to making India a global technology leader.

    Green initiatives form the heart of this budget with a 53% boost in clean energy funding. This money will help everything from EV adoption to environmentally responsible manufacturing. The budget takes a detailed view of national growth through targeted programs in healthcare, education, real estate, and defense.

    Investors face both risks and rewards in this budget. Markets typically show volatility on Budget Day, but infrastructure, manufacturing, and technology sectors look promising for the long term. You can stay updated with the latest Finance and Fintech news through the Findoc Whatsapp Channel as you make your investment choices.

    This budget creates a roadmap to transform India into a developed nation while protecting economic stability. Your financial decisions in the coming year will benefit from understanding these fiscal policies, whether you run a business, invest in markets, or work as a professional.

    Frequently asked questions

    Budget 2026 focuses on balancing fiscal discipline with growth ambitions. It includes potential adjustments to standard deductions and income tax slabs to increase disposable income, expanded credit access for MSMEs and startups, significant investments in AI infrastructure, and a 53% increase in green energy allocations to support sustainability initiatives.

    While major overhauls are unlikely, the budget may introduce modest changes such as increasing the standard deduction from ₹75,000 to ₹1 lakh under the new tax regime. There’s also a possibility of introducing an optional joint taxation system for married couples, allowing them to file a single consolidated income tax return.

    The budget aims to improve financing access for MSMEs through expanded credit guarantee frameworks and simplified compliance requirements. For startups, it proposes extending ESOP tax benefits to all DPIIT-recognized startups and introduces the Research, Development and Innovation (RDI) Scheme with a ₹1-lakh-crore corpus to support deep-tech innovation.

    The budget increases funding for green energy initiatives by 53% to ₹26,549.38 crore. It includes incentives for clean energy and electric vehicles, support for sustainable manufacturing practices, and measures to improve energy efficiency in data centers. There’s also a proposal to create a national green finance institution to support renewable energy projects

    Key sectors to watch post-budget include infrastructure, manufacturing, agriculture, consumption, and technology-linked sectors. The budget also introduces targeted initiatives in healthcare (medical device parks), education (expansion of PM-SHRI scheme), real estate (boost to affordable housing), and defense (focus on indigenous production).

    Disclaimer: This blog is intended solely for educational and informational purposes and should not be construed as investment advice or a recommendation. While efforts have been made to ensure the accuracy and reliability of the information and data presented, no representation or warranty, express or implied, is made regarding its completeness or correctness. Readers are advised to independently verify all information and consult a qualified financial advisor before making any investment decisions. Investments in the securities market are subject to market risks. Please read all relevant offer documents and disclosures carefully before investing.,

  • How to Read Intraday Candlestick Chart Patterns?

    How to Read Intraday Candlestick Chart Patterns?

    Intraday analysis requires timely, structured information on price movements. Intraday candlestick patterns provide this by presenting market activity in a clear visual format, showing how prices fluctuate within shorter time intervals. These formations help illustrate shifts in buying and selling pressure throughout the trading day and are an essential part of technical analysis. Findoc explains these concepts in a systematic and accessible manner, enabling readers to understand how intraday patterns contribute to short-term market analysis.

    For beginners looking to participate actively in the markets, learning these patterns becomes even more valuable once they open demat account online, as it helps them make informed intraday decisions from day one.

    What Are Intraday Trading Chart Patterns?

    Intraday trading chart patterns are recognisable formations created by candlesticks on a price chart, showing how the market behaves within shorter time intervals. These patterns reflect shifts in buying and selling activity and help present intraday movement in an organised visual structure.

    Every candlestick shows four things for that time period:

    • Opening price
    • Closing price
    • Highest price
    • Lowest price

    When many candles are viewed together, they form identifiable intraday chart patterns. These patterns help in analysing short-term market behaviour and understanding how price movement develops during the trading day.

    Also Read: What is Intraday Trading?

    Common Intraday Chart Patterns

    Intraday chart patterns are recurring candlestick formations observed on short-term price charts. These patterns help analyse how market sentiment evolves during the trading day and offer a structured way to study intraday movement. Individual candles provide immediate price information; multi-candle formations give a broader view of short-term behaviour. Intraday patterns are generally grouped into bullish reversal, bearish reversal and continuation patterns.

    Bullish Patterns

    Bullish patterns suggest that downward momentum may be slowing and that buyers are becoming more active within the intraday timeframe. Common examples include:

    • Hammer: A candle with a small real body and a long lower shadow, indicating that prices moved lower during the period but later recovered.
    • Bullish Engulfing: A larger green candle covers the previous red candle, reflecting a shift in intraday sentiment toward buying pressure.
    • Morning Star: A three-candle formation that appears after a decline, showing a transition from selling pressure to signs of renewed demand.

    Bearish Patterns

    Bearish patterns signal that upward momentum may be weakening and that sellers are beginning to exert more influence on the intraday chart.

    • Hanging Man: Visually similar to a hammer but appears after an upward movement, indicating intraday selling interest at higher levels.
    • Bearish Engulfing: A red candle that completely covers the previous green candle; this reflects increased selling activity within the session.
    • Evening Star: A three-candle pattern that appears after an upmove and reflects a shift from buying strength to emerging selling pressure.

    Continuation Patterns

    This pattern shows that the prevailing intraday trend may remain the same, subject to confirmation from subsequent candles.

    • Doji: A candle with minimal body, this represents indecision. When aligned with the broader context, it may support continuation once the next candle confirms direction.
    • Three White Soldiers: Three consecutive green candles with progressively higher closes, representing sustained intraday buying interest.
    • Three Black Crows: Three successive red candles that close lower each time, reflecting consistent intraday selling momentum.

    Additional Read: How to Start Online Trading?

    Key Components of a Candlestick Chart

    An intraday candlestick chart represents intraday price movement through a set of clearly defined elements. Each candle provides information about how prices behaved within a specific interval. The main components are as follows:

    1. The Real Body

    The real body reflects the difference between the opening and closing prices for the chosen time period.

    • A green body indicates a close above the open.
    • A red body indicates a close below the open.

    The size of the body shows the extent of buying or selling within that interval.

    2. The Wick or Shadow

    The wicks extend above and below the real body and mark the highest and lowest prices reached during the session.

    • The upper wick represents the intraday high.
    • The lower wick represents the intraday low.

    These ranges offer insight into price fluctuations beyond the open and close.

    3. Candle Extremes

    The top and bottom of the candle highlight the key price points for the interval.

    • In a green candle, the bottom of the body marks the open and the top marks the close.
    • In a red candle, the top of the body marks the open and the bottom marks the close.

    These levels help outline the path price has taken within the period.

    4. The Trend

    A sequence of candles forms visible trends on an intraday chart. Several consecutive green candles may indicate sustained buying interest, while repeated red candles may reflect ongoing selling pressure. Trend direction offers essential context when assessing intraday movement.

    5. Pattern Formation

    Patterns emerge in the chart when multiple candles appear in a specific pattern. Their collective structure helps identify reversal or continuation tendencies on an intraday trading chart. Multi-candle formations often provide broader insight than individual candles viewed in isolation.

    You May Also Like: Best Intraday Indicators to Improve Your Trading Strategy

    Steps to Apply Candlestick Patterns in Intraday Trading

    Applying intraday candlestick patterns in trading involves a structured analysis of market conditions rather than just relying on any single formation. The following steps show how these patterns are typically assessed within short-term price analysis

    1. Identify the Market Environment

    Determine whether the price is moving upward, downward, or within a narrow range. Candlestick patterns are more helpful when they are used in the context of an existing trend.

    2. Observe Relevant Patterns

    A sequence of candles is analysed to identify whether any recognised pattern is developing. The surrounding price action helps determine whether the formation aligns with prevailing market conditions.

    3. Refer to Technical Reference Points

    Use tools such as support and resistance levels, moving averages, or volume indicators to better understand market conditions. These references help validate whether the observed pattern aligns with broader market behaviour.

    4. Define Entry and Exit Zones

    Identify the areas on the chart where participation may occur and where positions can be closed. These zones are usually determined by technical levels instead of isolated candles.

    5. Apply Stop-Loss Measures

    Stop-loss levels are essential for effectively managing potential losses. They establish specific points at which a position is deemed no longer valid from a technical standpoint.

    6. Maintain Risk Parameters

    It is advisable to limit exposure to a small percentage of available capital. Implementing a consistent risk management framework is essential for mitigating the potential for disproportionate losses during periods of intraday volatility.

    Also Read: Understanding Trading, Profit and Loss Account

    Conclusion

    Intraday candlestick chart patterns offer a structured way to observe short-term market movement and identify how buying and selling activity develops within the trading day. These formations help present price behaviour in a clear visual format and support a more organised approach to analysing intraday trends. When assessed with confirmation and broader market context, they contribute meaningfully to technical interpretation. Findoc explains these concepts concisely and systematically, enabling readers to understand how intraday patterns fit into overall market analysis.

    Frequently Asked Questions

    The colour of the next candlestick cannot be predicted with certainty. Market participants analyse price structure, support and resistance levels, volume behaviour, and overall trend context to assess potential direction, but outcomes remain probabilistic rather than guaranteed.

    The 3-candle rule involves observing three consecutive candles moving in the same direction before evaluating short-term momentum. This approach helps reduce reliance on isolated candles that may not accurately reflect broader price behaviour.

    Patterns such as Hammer, Engulfing formations, Doji variations, and Morning Star structures are frequently used in intraday analysis. Their effectiveness depends on confirmation, volume support, and alignment with the prevailing market trend.

    The 3-5-7 rule refers to analysing price behaviour over groups of three, five, or seven candles. These groupings help identify short-term momentum shifts and provide a structured way to observe whether strength or weakness is developing in the market.

    The 1% rule is a risk management guideline that limits exposure on a single position to no more than 1% of total trading capital. Its objective is to control downside risk and support long-term consistency.

    Intraday trading carries higher risk due to rapid price movements within short timeframes. Beginners may find these fluctuations challenging without sufficient preparation. A disciplined approach, risk control, and structured analysis are essential in such environments.

    Candlestick patterns tend to be more reliable in stocks with higher liquidity and trading volume. In low-volume stocks, price movements can be erratic, making pattern-based analysis less consistent.

  • Differences Between Stock Investing and Trading

    Differences Between Stock Investing and Trading

    The stock market offers multiple ways to participate, and one of the most common comparisons that new investors try to understand is trading vs investing. Although both involve dealing in securities, they differ significantly in purpose, time horizon, and the level of involvement required. This distinction can be difficult for new investors to understand, especially when they are still learning how the market functions or planning to open free demat account online to get started. Findoc provides clear and reliable financial insights that help readers assess these methods with greater clarity before making informed decisions.

    What is Investing?

    Investing refers to purchasing shares or other financial assets with the intention of holding them for a long period. The objective is long-term capital growth supported by the performance of the underlying business. Investors typically focus on stability, sustained value appreciation, and the potential to earn passive income through dividends. This approach is suitable for individuals seeking predictable, long-term outcomes rather than frequent short-term market activity. Understanding investing is essential when evaluating the broader discussion of trading vs investing, as each method requires a different outlook and risk preference.

    Also Read: What is Online Stock Trading?

    Types of Investing

    Different investing styles allow individuals to choose an approach that aligns with their financial goals, time horizon, and comfort with risk. Below are the most commonly followed methods.

    1. Value Investing

    Value investing involves selecting companies that appear to be priced below their intrinsic value. Investors evaluate financial statements, earnings patterns, long-term prospects, and competitive advantages to identify opportunities where the market’s current valuation may not reflect the company’s true potential.

    2. Growth Investing

    Growth investing focuses on businesses expected to expand faster than the market average. These companies may operate in sectors with strong innovation or rising consumer demand. The emphasis is on future potential rather than immediate profitability, making this approach suitable for those who prioritise long-term appreciation.

    3. Dividend Investing

    Dividend investing involves selecting companies that regularly distribute a portion of their profits to shareholders. Individuals who prefer a steady income stream often favour this method, as it provides both periodic payouts and the possibility of long-term capital growth.

    4. Buy and Hold Investing

    The buy-and-hold approach involves retaining investments over several years, regardless of short-term market fluctuations. Investors rely on the long-term resilience of high-quality businesses and allow compounding to work over time. This method is one of the clearest illustrations of the difference between trading and investing, as it requires far less frequent decision-making.

    5. Socially Responsible Investing

    SRI integrates personal or institutional values into investment choices. Investors consider environmental practices, governance standards, and ethical policies alongside financial performance, choosing companies that align with both their principles and long-term objectives.

    6. Contrarian Investing

    Contrarian investing involves taking positions against prevailing market sentiment. Investors identify situations where widespread pessimism or temporary reactions have pushed prices away from a company’s long-term fundamentals, creating scope for future appreciation.

    Additional Read: Beginner’s Guide to Share Market Basics in India

    What is Trading?

    Trading refers to buying and selling securities with the intention of benefiting from short-term price movements. It involves active market tracking, the use of technical indicators, and quick decision-making. Because prices can change rapidly, trading carries higher risk and demands more involvement than long-term investing. Understanding how trading works is important when evaluating the difference between trading and investing, as both follow very different objectives and time horizons.

    Also Read: What is Trading Account?

    Types of Trading

    Different trading styles suit varying levels of expertise, risk tolerance, and time commitment. The main categories include:

    1. Day Trading

    Day trading involves opening and closing positions within the same trading session. Traders avoid carrying positions overnight to eliminate exposure to after-hours market developments. This method requires continuous monitoring, quick execution, and a high degree of risk management.

    2. Swing Trading

    Swing trading focuses on short- to medium-term price movements. Positions are typically held for a few days or weeks, depending on how the trend develops. This style combines elements of technical analysis with broader market observations, allowing traders to operate with a slightly longer time horizon than intraday trading.

    3. Scalping

    Scalping is an ultra-short-term approach aimed at capturing very small price movements across a high volume of trades. Each trade lasts only a few seconds or minutes. Scalpers rely on precision, strict discipline, and fast execution, as the margins for error are significantly lower.

    4. Position Trading

    Position trading involves holding positions for several weeks or months, depending on momentum and broader market conditions. Although the holding period is longer than other trading styles, the approach remains centred on technical indicators and trends rather than long-term company fundamentals.

    5. Momentum Trading

    Momentum traders focus on securities showing strong upward or downward movement. Positions are taken when a clear directional trend is identified and closed once momentum begins to weaken. This approach requires careful entry and exit planning to manage risk effectively.

    6. Algorithmic Trading

    Algorithmic trading uses automated systems that execute trades based on pre-defined rules and programmed strategies. These algorithms analyse data, detect patterns, and react quickly to market changes, reducing the impact of human emotion and enabling efficient order execution.

    Also Read: Top Algorithmic Trading Strategies

    7. Options Trading

    Options trading involves the use of derivative contracts that provide the right, but not the obligation, to buy or sell an underlying asset at a specified price. Traders use options for directional strategies, hedging, and risk management with greater flexibility. Understanding how options behave under different market conditions is critical, given their complexity and time sensitivity.

    Main Differences Between Investing and Trading

    The difference between trading and investing becomes clearer when examined in terms of their underlying purpose, time commitment, and risk exposure. The following comparison outlines these factors in a structured manner to help readers understand how the two approaches operate.

    Factor Investing Trading
    Purpose Long-term wealth creation Short-term profit
    Time Frame Years or decades Seconds to months
    Risk Level Generally lower Higher due to price volatility
    Approach Patient, long-term participation Active, short-term participation
    Primary Analysis Fundamental analysis (company health) Technical analysis (price charts & volume)
    Trade Frequency Low High
    Profit Source Dividends and long-term value appreciation Short-term price movements
    Emotional Discipline Patience and consistency Speed and discipline under pressure
    Diversification Usually more diversified Often concentrated in specific opportunities
    Suitable For Long-term financial goals Short-term opportunities and high-frequency strategies

    Who Should Consider Investing and Who Should Consider Trading?

    The choice between investing and trading depends on financial goals, risk appetite, and the level of involvement an individual is prepared for. The points below outline situations where each approach may be appropriate.

    You should consider investing if:

    • Your objective is long-term wealth creation
    • You prefer not to monitor the markets frequently
    • Your goals include retirement planning, property purchase, or education funding
    • You are comfortable with low to moderate risk
    • You prefer gradual, consistent growth over time
    • You value the potential for dividend income

    You should consider trading if:
    You aim to benefit from short-term market movements

    • You can track market conditions actively
    • You understand price charts, technical indicators, and market trends
    • You are comfortable taking higher risk
    • You can make quick, disciplined decisions
    • You have sufficient capital to manage frequent trades

    A clear understanding of these factors helps individuals choose an approach that reflects their financial objectives, and the structured market information available through Findoc supports this evaluation naturally and effectively.

    Limitations of Trading and Investing

    Every approach to the market has its constraints, and recognising these helps individuals set realistic expectations and choose methods aligned with their financial comfort and goals.

    Limitations of Trading

    • Involves a higher level of risk due to rapid price movements
    • Requires continuous monitoring of market conditions
    • Demands a strong technical understanding and disciplined execution
    • Can lead to emotional stress because of frequent decision-making

    Limitations of Investing

    • Capital growth typically occurs over a long period
    • Requires patience and the ability to stay invested during volatility
    • Short-term market declines can be challenging for some investors to manage emotionally

    Evaluating these limitations provides a clearer perspective on how trading vs investing differ in expectations and commitment, allowing individuals to make choices that match their financial outlook.

    Additional Read: What Is the India Volatility Index?

    Conclusion

    Investing and trading offer two distinct ways to participate in the markets, each serving different objectives and levels of involvement. Choosing between them depends on financial goals, risk tolerance, and preferred time horizon. Findoc provides clear, structured financial information that helps readers better understand these approaches and make decisions that align with their long-term plans.

    Frequently Asked Questions

    Neither method is universally better. Trading focuses on short-term price movements and carries higher risk, while investing aims for long-term growth with comparatively lower volatility. The suitable choice depends on personal goals.

    Yes. Trading is one way of participating in the stock market and involves buying and selling securities more frequently to benefit from short-term movements.

    No. Trading is based on short-term price changes, whereas investing is centred on long-term value and business performance.

    Trading generally involves higher risk because prices can change quickly. Investing carries lower relative risk due to its long-term approach.

    Investing is generally suited to long-term financial goals. Trading may be appropriate for individuals who can manage higher risk and follow market movements more closely.

    Yes. Many individuals use both approaches, investing for long-term goals while taking selective short-term trading opportunities, provided each method aligns with their risk tolerance and financial objectives.

  • Candlestick Patterns Every Trader Should Know

    Candlestick Patterns Every Trader Should Know

    A candlestick chart is one of the most widely used tools in technical analysis, offering a clear view of market behaviour across specific time intervals. The formations on these charts are known as candlestick patterns, which help traders assess buying and selling pressure, momentum shifts, and short-term sentiment. Many beginners start learning these patterns soon after they open free demat account online, as it helps them analyse market movements more confidently. Findoc explains these patterns in a structured and accessible manner, helping readers understand their role in market analysis more effectively.

    What are Candlestick Patterns?

    Candlestick patterns are formations that appear on a candlestick chart and represent the price movement of a security within a specific period. Each candle shows four key data points: the opening price, the closing price, the highest price, and the lowest price. When multiple candles form recognisable structures, they may indicate potential shifts in market sentiment. These classifications help traders interpret how different candlestick chart patterns reflect shifts in sentiment and short-term market behaviour.

    Types of Candlestick Patterns

    Candlestick patterns are commonly grouped into bullish reversal, bearish reversal, and continuation patterns. Each category helps traders determine whether the market may reverse or continue its current movement. Understanding these classifications helps readers see how different candlestick formations reflect shifts in sentiment and potential short-term market behaviour.

    Some commonly observed candlestick patterns include:

    1. Bullish Engulfing Pattern

    A Bullish Engulfing pattern forms when a small red candle is followed by a larger green candle that fully covers the previous candle. It indicates a shift from selling pressure to stronger buying interest. This pattern often appears after a decline and may suggest improving sentiment in the near term.

    2. Hammer Pattern

    The Hammer is a single candle with a small body and a long lower shadow, typically appearing after a downtrend. It shows that sellers initially pushed the price lower, but buyers entered at those levels and restored it closer to the open. This may indicate emerging buying interest.

    3. Morning Star Pattern

    The Morning Star is a three-candle pattern that consists of a long red candle, a small indecisive candle, and a long green candle. It reflects weakening selling momentum and early signs of buying interest. This pattern may signal a shift in sentiment following a downtrend.

    4. Piercing Line Pattern

    The Piercing Line is a two-candle formation where a long red candle is followed by a green candle that closes above the midpoint of the previous body. It highlights increased buying participation after a decline and may point to a short-term improvement in sentiment.

    5. Bullish Harami Pattern

    This pattern appears when a large red candle is followed by a smaller green candle positioned within the previous body. It suggests a slowdown in selling momentum and the possibility of buying interest emerging, often observed during early signs of trend exhaustion.

    6. Three White Soldiers Pattern

    Three consecutive green candles of progressively higher closes form this pattern. Each candle opens within the prior body and closes near its high. It illustrates consistent buying interest over three sessions.

    7. Inverted Hammer Pattern

    The Inverted Hammer features a small body with a long upper wick and appears after a downtrend. It indicates that buyers attempted to lift prices despite earlier selling. While not a confirmation on its own, it can signal early buyer interest at lower levels.

    8. Dragonfly Doji

    A Dragonfly Doji has little to no body and a long lower wick, showing that sellers pushed prices down but buyers later restored them to the opening level. When seen after a decline, it may reflect buying interest emerging at key support levels.

    9. Bullish Abandoned Baby Pattern

    This pattern consists of a long red candle, a Doji that gaps down, and a long green candle that gaps up. The separation between the candles suggests a sharp change in sentiment. It is often interpreted as a potential bullish reversal when appearing after a decline.

    10. Three Inside Up Pattern

    The pattern begins with a long red candle, followed by a smaller green candle closing above the midpoint of the prior body, and concludes with a stronger green candle. It reflects a gradual transition from selling pressure to increasing buying interest.

    11. Three Outside Up Pattern

    This pattern begins with a red candle, followed by a larger green candle that engulfs the previous body, and a second green candle that closes higher. The sequence indicates strengthening buying interest and confirms a shift in sentiment after a decline. It is generally viewed as a reinforcing bullish signal.

    12. Bullish Kicker Pattern

    A Bullish Kicker pattern appears when a red candle is followed by a green candle that opens significantly higher, creating a noticeable price gap. This reflects a sharp change in sentiment, often driven by new information or strong buying interest. It is regarded as a decisive change in direction.

    13. Tweezer Bottom Pattern

    This pattern forms when two consecutive candles display nearly identical low points. It suggests that the market has tested a support level twice and rejected lower prices both times. The formation indicates stabilising sentiment and the possibility of buying interest at that level.

    14. Rising Three Methods Pattern

    This continuation pattern features a strong green candle, followed by a series of small red candles that remain within its range, and ends with another green candle closing higher. It reflects a temporary pause in an uptrend before buyers regain control. The structure suggests sustained upward momentum.

    15. Bearish Engulfing Pattern

    A Bearish Engulfing pattern forms when a small green candle is followed by a larger red candle that completely covers the previous body. It indicates increasing selling pressure and a potential sentiment shift after an upward move. It is often interpreted as a sign of weakening momentum.

    16. Bearish Belt Hold Pattern

    This pattern appears as a long red candle that opens at its high and closes near its low without forming an upper wick. It reflects strong selling interest from the start of the session and may indicate emerging downward pressure after an advance.

    17. Three Black Crows Pattern

    Three consecutive long red candles with small or no wicks create this pattern. Each candle opens within the prior body and closes lower. It signals sustained selling pressure and may indicate the early stages of a broader downward trend when seen after an upmove.

    18. Bearish Evening Star Pattern

    The Evening Star is a three-candle formation consisting of a strong green candle, a small indecisive candle, and a long red candle closing deep into the first candle’s body. It shows that upward momentum has weakened and that sellers are beginning to take control.

    19. Bearish Shooting Star Pattern

    A Shooting Star features a small body and a long upper wick and appears after an advance. It indicates that buyers attempted to push prices higher but were met with selling pressure. This shift may suggest early signs of weakening momentum near resistance.

    20. Bearish Harami Pattern

    This pattern forms when a large green candle is followed by a smaller red candle that sits within the prior body. It reflects slowing buying interest and indicates increasing selling interest. The formation may indicate hesitation in the ongoing uptrend.

    21. Bearish Kicker Pattern

    A Bearish Kicker consists of a strong green candle followed by a red candle that opens significantly lower, creating a clear downward gap. The abrupt price shift suggests a notable change in sentiment, often prompting a reassessment of the preceding trend.

    22. Bearish Tweezer Top Pattern

    This pattern occurs when two candles at the top of a trend share a similar high. The first is typically green, followed by a red candle. It suggests that the market encountered firm resistance at that level, indicating a potential shift towards selling pressure.

    23. Dark Cloud Cover Pattern

    The Dark Cloud Cover consists of a long green candle followed by a red candle that opens higher but closes below the midpoint of the previous body. It highlights rising selling interest and may indicate weakening momentum.

    Also Read: Stock Market Technical Analysis

    Conclusion

    Candlestick patterns offer valuable insight into short-term market behaviour by showing how the price reacts to buying and selling pressure. Understanding these formations helps traders interpret shifts in sentiment and assess potential movements within ongoing trends. Findoc presents these concepts in a structured and accessible manner, supporting readers as they develop a sharper understanding of the role these patterns play in informed market analysis.

    Frequently Asked Questions

    No single candlestick pattern is universally accurate. Patterns such as the Bullish or Bearish Engulfing are considered strong signals, but their usefulness increases when combined with trend analysis, volume, and broader market context.

    It refers to analysing three consecutive candles together to confirm a possible reversal or continuation. This approach helps traders avoid reacting to isolated candles and reduces the likelihood of misinterpreting short-term movements.

    Candlestick patterns can be used to identify potential reversals, continuations, entry areas, and exit points. They highlight changes in buying and selling pressure, but should be interpreted alongside technical indicators and risk-management principles.

    They are helpful tools for reading market behaviour, but they are not guarantees in and of themselves. Reliability improves when patterns are combined with supporting indicators, market structure, and broader analysis.

    Candlestick patterns are formations created by price movement on a candlestick chart. They help traders understand market sentiment and assess whether prices may strengthen, weaken, or consolidate based on recent activity.

  • Hammer Candlestick Patterns

    Hammer Candlestick Patterns

    A hammer candlestick is a widely recognised chart formation used in technical analysis to interpret potential shifts in market sentiment. It appears after a decline and is characterised by a distinct structure, which may signal early signs of buying interest. Findoc explains such patterns clearly and in a structured manner to help readers understand their relevance in market analysis.

    Understanding such patterns becomes even more valuable for new investors who wish to make informed decisions when they open demat account online and start analysing market movements.

    What Is a Hammer Candlestick Pattern?

    A hammer candlestick pattern is a single-candle formation that commonly appears after a downward price move. It has a small real body and a long lower shadow, which indicates that prices have declined during the session but were later supported by buying interest. In the hammer in the stock market context, this structure reflects rejection of lower levels. While it may suggest improving sentiment, it should be assessed alongside broader market conditions and confirmation from subsequent price action.

    Also Read: Expert Stock Market Technical Analysis

    Importance of Hammer Candlestick Patterns

    A hammer pattern is important because it highlights price rejection at lower levels and may indicate a potential shift in market sentiment. Analysts often review the hammer candle to identify whether selling pressure is weakening and buying interest is emerging. When combined with confirmation from subsequent price movement, it can provide useful context within broader technical analysis.

    Additional Read: Fundamental Analysis in the Share Market

    Types of Hammer Candlestick

    Hammer formations appear after a decline and highlight rejection of lower prices, but their structures differ slightly. The two most recognised variations are the Bullish Hammer and the Inverted Hammer.

    1. Bullish Hammer

    A Bullish Hammer has a small real body positioned near the top of the candle and a long lower shadow. This structure shows that the price fell during the session, but buyers entered decisively at lower levels, pushing the price back toward the open. It is often viewed as an early indication that selling pressure may be weakening and that demand is beginning to emerge.

    2. Inverted Hammer

    An Inverted Hammer has a small body near the lower end of the candle and a long upper shadow. It forms after a downtrend and reflects an attempt by buyers to lift the price, even though sellers later drove it back near the open. If the candle that follows closes higher, it may support the view that buying interest is strengthening despite earlier downward momentum.

    Both variations suggest that lower levels have been tested and may indicate early signs of shifting sentiment, subject to further confirmation.

    Also Read: Types of Trading in the Stock Market

    Interpretation of Hammer Candlesticks

    Interpreting a hammer candlestick involves examining how the price moved during the session and what that movement suggests about market sentiment. The candle typically shows that prices opened, declined as sellers dominated early trading, and later recovered as buyers entered at lower levels, resulting in a close near the upper portion of the candle’s range.

    A hammer pattern is generally considered more meaningful when:

    • It forms after a series of preceding bearish candles
    • The candle that follows closes above the hammer’s high, offering confirmation
    • The lower shadow is significantly longer than the real body, indicating strong rejection of lower prices

    These factors collectively help assess whether selling pressure is weakening and whether buyers are beginning to show interest at lower levels. Findoc explains such pattern-based interpretations in a structured and accessible manner, helping readers understand how these signals fit into broader technical analysis.

    Also Read: What is Trading Account?

    Trading Strategies Based on Hammer Pattern

    The hammer pattern is often assessed alongside other technical factors to determine whether sentiment is shifting. Common approaches include:

    • Reviewing the candle that follows the hammer to check whether it closes higher, offering confirmation
    • Using established support levels to assess whether the rejection of lower prices aligns with the broader market structure
    • Considering volume behaviour to gauge the strength of buying interest at lower levels
    • Avoiding the interpretation of hammer formations that appear within sideways or low-momentum market conditions

    These considerations help place the hammer pattern within a broader framework of technical analysis.

    Additional Read: What is a Demat Account?

    How to Trade the Hammer Candlestick Pattern

    When analysing a hammer candlestick pattern, traders typically follow a structured approach to understand whether buying interest is emerging at lower levels. Key steps include:

    • Identifying the hammer at the end of a clear downtrend
    • Ensuring the lower shadow is significantly longer than the real body
    • Waiting for the next candle to close above the hammer’s high as confirmation
    • Considering trade entries only after confirmation is established
    • Placing a stop loss below the hammer’s low to manage risk
    • Setting potential targets based on nearby resistance zones or previous price levels

    These steps help integrate the hammer pattern into a disciplined technical analysis process.

    Additional Read: What Is Dematerialisation?

    Tips for Trading with Hammer Candlestick Pattern

    When evaluating a hammer candlestick pattern, the following considerations can help place the formation within a broader analytical context:

    • Look for confirmation from the subsequent candle to understand whether buying interest is strengthening
    • Review the proportion of the lower shadow to the real body, as deeper rejection may reflect stronger intraday demand
    • Use trendlines, moving averages, or broader trend structure to contextualise the pattern
    • Exercise caution with hammers that have relatively small shadows or appear in low-momentum market environments
    • Apply disciplined risk-management principles when interpreting any candlestick formation
    • Avoid relying solely on patterns without considering additional technical or market factors

    Also Read: What is Intraday Trading?

    Example of Hammer Candlestick Pattern

    For instance, if a stock declines over several sessions. One day, the stock opens at 100, drops to 90, but closes at 102. This structure forms a hammer candlestick, indicating rejection of lower prices. If the following session opens higher and closes above this level, buying interest is likely to strengthen after the earlier decline.

    Limitations of Hammer Candlestick Pattern

    While the hammer candlestick pattern is a useful analytical formation, it has certain limitations that should be considered:

    • A hammer does not indicate a reversal in every instance
    • Confirmation from the subsequent candle is generally required
    • The pattern may be less effective during strong or persistent downtrends
    • It does not indicate the duration or strength of any potential reversal
    • Additional technical tools are necessary to build a broader market view

    Findoc presents these considerations in a structured manner to help readers understand the context in which hammer formations may be interpreted more effectively.

    You May Also Like: What is Algo Trading?

    Common Mistakes While Using Hammer Candlestick Pattern

    When interpreting a hammer candlestick pattern, certain errors can affect the accuracy of the analysis. Common mistakes include:

    • Entering the trade before the pattern receives confirmation from the next candle
    • Interpreting hammer formations that appear in sideways or low-momentum market conditions
    • Relying solely on the hammer pattern without checking other technical indicators
    • Overlooking the proportion between the shadow and the real body
    • Placing stop-loss levels too close to the candle’s low may lead to premature exits

    Recognising these mistakes can help apply the hammer pattern within a more disciplined analytical framework.

    Recommended Read: What are Shares?

    Conclusion

    The hammer candlestick pattern is a trusted technical analysis formation that shows rejection of lower prices and may signal early signs of shifting sentiment after a downtrend. Its effectiveness improves when evaluated in conjunction with confirmation and a wider market context. Findoc presents these concepts in a clear, structured manner, enabling readers to understand how individual patterns contribute to overall chart interpretation.

    Frequently Asked Questions

    A hammer candlestick pattern is a single candle with a small body and a long lower shadow. It forms when prices decline during a session, but recover significantly before the close, indicating rejection of lower levels.

    Its reliability improves when it appears after a downtrend and is supported by confirmation from the following candle. However, like all chart patterns, it should be assessed alongside broader market conditions.

    It is generally not used in isolation. The pattern is more meaningful when combined with additional indicators such as volume, trend structure, or established support levels.

    If the price does not show confirmation in the next session, the pattern remains inconclusive. In such situations, analysts usually avoid drawing conclusions based solely on the hammer.

    The pattern can appear across multiple timeframes. Many analysts refer to higher timeframes, such as hourly or daily charts, for clearer signals and reduced noise.

    Yes. The colour of the real body is less important than the presence of a long lower shadow, which indicates that lower prices were rejected during the session.

    Both candles look similar, but their context differs. A hammer forms at the bottom of a downtrend and is associated with potential bullish reversal, while a hanging man appears after an uptrend and may indicate emerging selling pressure.

  • Amagi Media Labs IPO: Complete Guide to Price, Dates & Financials

    Amagi Media Labs IPO: Complete Guide to Price, Dates & Financials

    If you have ever streamed a free movie on your smart TV or watched a specialized sports channel on an app without a cable subscription, you have likely interacted with the technology behind Amagi Media Labs. As the global media landscape shifts aggressively from traditional cable to internet-based streaming, the “plumbing” that makes this transition possible has become big business.

    Amagi Media Labs is positioning itself at the center of this revolution. As a Software-as-a-Service (SaaS) unicorn, they provide the cloud technology that allows broadcasters and content owners to launch, distribute, and monetize channels across the globe. Now, they are bringing this growth story to the public markets.

    For retail investors, the upcoming Initial Public Offering (IPO) presents an opportunity to invest in the infrastructure of the streaming boom. However, with the company operational transitioning from a high-growth, high-burn phase into profitability, understanding the financial nuances is critical.

    In this detailed guide, we will break down the Amagi Media Labs IPO, analyzing the price band, the company’s path to profitability, and the risks and rewards you need to consider before adding this stock to your portfolio.

    IPO Snapshot: Key Dates and Numbers

    Before diving into the business model, let’s look at the essential details of the offer. Amagi Media Labs is looking to raise approximately ₹1,789 Crore through a mix of fresh equity and an Offer for Sale (OFS). Investors interested in participating can Apply now while reviewing the key dates and pricing structure outlined below.

    Here is the tentative schedule and pricing structure you need to know:

    • IPO Opening Date: Tuesday, January 13, 2026
    • IPO Closing Date: Friday, January 16, 2026
    • Price Band: ₹343 to ₹361 per share
    • Lot Size: 41 Shares
    • Total Issue Size: ₹1,789 Crore
    • Face Value: ₹5 per share
    • Tentative Listing Date: Wednesday, January 21, 2026

    Understanding the Issue Structure
    It is important for investors to distinguish where the money is going.

    • Fresh Issue (₹816 Crore): This capital goes directly into the company. Amagi plans to use ₹550 Crore of this for technology and cloud infrastructure expansion, specifically scaling their AI-led ad tech. The rest will fund inorganic growth (acquisitions) and general corporate purposes.
    • Offer for Sale (OFS): The remaining portion involves existing investors—such as Accel India, Norwest Venture Partners, and early shareholders—selling part of their stake. The company does not receive proceeds from this portion.

    What Does Amagi Media Labs Actually Do?

    Amagi is not a content creator; they are a technology enabler. They operate what is known as a “glass-to-glass” cloud platform. This means they handle the entire lifecycle of a video broadcast, from the camera lens (glass) to the viewer’s screen (glass).

    Traditionally, TV stations required massive, expensive hardware, satellites, and on-premise servers to broadcast content. Amagi replaces all of that with the cloud. They allow media companies to spin up new channels, distribute them to platforms like Roku or Apple TV, and insert targeted ads, all through a web-based dashboard.

    The Three-Sided Marketplace

    Amagi’s business model is robust because it serves three distinct groups, creating a network effect:

    1. Content Providers: Studios and networks (like Lionsgate, Fox, and NBC) use Amagi to manage and play out their video feeds.
    2. Distributors: Streaming platforms (like Roku, VIZIO, and Rakuten TV) use Amagi to receive content formatted perfectly for their apps.
    3. Advertisers: Brands use Amagi’s dynamic ad-insertion technology to place ads into these streams in real-time.

    As more content providers join, more distributors want to carry those channels. As viewership grows, advertisers are willing to pay more for ad slots. Amagi sits in the middle, monetizing every part of this flow.

    Revenue Model: How Amagi Makes Money

    For a retail investor, understanding how a SaaS company generates cash is vital, especially when evaluating long-term sustainability alongside factors like the Amagi Media Labs Share Price. Amagi has moved beyond simple subscription fees to a diversified revenue model.

    • Fixed Subscription Fees: Clients pay a monthly recurring fee to use the Amagi CLOUDPORT platform to manage and broadcast their channels. This provides steady, predictable cash flow.
    • Usage-Based Fees: Similar to a utility bill, some clients pay based on the hours of content they process or stream.
    • Revenue Share (Ad Tech): This is a high-growth area. Through its “Thunderstorm” product, Amagi inserts ads into streams. They take a cut of the ad revenue generated (based on impressions and fill rates).
    • Event-Based Pricing: For massive one-off events, like the Olympics or elections, Amagi charges specific fees for orchestration and dynamic ad management.

    Financial Health: From Burn to Profitability

    SaaS companies often run losses for years to capture market share. Amagi fits this profile but is currently at a turning point.

    Revenue Growth
    The company has demonstrated impressive top-line growth. Revenue from operations jumped from ₹680 Crore in FY23 to ₹1,162 Crore in FY25. This represents a Compound Annual Growth Rate (CAGR) of 30.7%.

    The Profitability Turnaround
    Historically, Amagi prioritized growth over profit, resulting in losses in FY23 and FY24. However, the data for FY25 and H1 FY26 shows a significant shift:

    • Gross Margins: Expanded to nearly 69.6% in H1 FY25. As they scale, their cost of delivering services (COGS) decreases relative to revenue.
    • EBITDA: The company transitioned from a negative EBITDA margin of -50% in FY23 to a positive 2.02% in FY25.
    • Net Profit: Amagi turned profitable in the first half of FY26, posting a Profit After Tax (PAT) of ₹64.70 million.

    Balance Sheet Strength
    A key indicator of safety for retail investors is debt. Amagi maintains a debt-free balance sheet. Their net worth has risen to ₹859 Crore, and the fresh issue will further fortify their cash reserves for future acquisitions or R&D.

    Industry Tailwinds: Why Now?

    The timing of this IPO aligns with a massive structural shift in the media industry.

    The Rise of FAST
    FAST stands for Free Ad-Supported Streaming TV. Consumers are experiencing “subscription fatigue” from paying for Netflix, Disney+, Hulu, and others. As a result, they are flocking to free, linear channels that look like traditional TV but are streamed over the internet.
    The FAST market is projected to double from $6.6 billion in 2024 to $13.3 billion by 2029. Amagi is a dominant player in enabling these FAST channels.

    Legacy Migration
    Believe it or not, 90% of global broadcast operations still rely on old-school, on-premise hardware. This is expensive and inflexible. Media companies are desperate to cut costs and are migrating to the cloud. Amagi’s cloud solutions can reduce Total Cost of Ownership (TCO) by 35-50%, making them an attractive partner during economic downturns.

    SWOT Analysis for Investors

    Before placing a bid, weigh the strengths against the potential risks.

    Strengths

    • Customer Stickiness: Amagi boasts a Net Revenue Retention (NRR) of 126.9%. This means that for every $100 a customer spent last year, they are spending $126.90 this year. Existing clients are growing with the platform.
    • Global Clientele: They serve 45% of the top 50 global media companies.
    • Technology Moat: With over 10 granted patents and AI capabilities for ad-yield optimization, their tech stack is difficult for competitors to replicate quickly.

    Weaknesses

    • Geographic Concentration: A massive 72.86% of their revenue comes from the Americas. While they are a global company, they are heavily dependent on the US economic climate.
    • Client Concentration: Losing a major partner like Roku or a top-tier studio could impact revenues significantly.
    • High Employee Costs: While decreasing as a percentage of sales, employee benefits still make up nearly 60% of expenses due to the high cost of tech talent.

    Opportunities

    • International Expansion: With under 2% of revenue coming from the Middle East and only 6.7% from Asia-Pacific, there is a massive runway to expand into emerging markets.
    • New Verticals: The technology used for TV can be adapted for e-sports, education, and healthcare streaming.

    Threats

    • Competition: Legacy hardware vendors are trying to build cloud solutions, and tech giants (like Amazon or Google) could theoretically build competing tools.
    • Ad Market Volatility: Since a portion of revenue is tied to ad impressions, a global recession that causes brands to cut ad spend would directly hurt Amagi’s bottom line.

    Conclusion

    Amagi Media Labs represents a classic “picks and shovels” play on the streaming industry. Rather than betting on which streaming service will win the content war, investing in Amagi is a bet on the infrastructure that powers all of them.

    The company checks several boxes for growth investors: high revenue growth, a debt-free balance sheet, expanding margins, and a clear path to profitability. The transition from loss-making to profit-generating in FY26 is a strong signal of operational maturity.

    However, the valuation and the risks associated with US market dependency should be considered. This IPO is best suited for investors with a moderate-to-high risk tolerance who believe in the long-term shift toward ad-supported streaming and cloud broadcasting.

    As always, ensure this investment aligns with your broader financial goals and portfolio diversification strategy.

    Frequently Asked Questions (FAQ)

    To participate in the IPO, you need to bid for a minimum of one lot. With a lot size of 41 shares and the upper price band at ₹361, the minimum investment would be ₹14,801.

    Yes, the company has recently turned a corner. While they posted losses in FY23 and FY24 due to heavy investment in growth, they reported a Net Profit of ₹64.70 million in the first half of FY26.

    Amagi competes with legacy broadcast hardware providers who are pivoting to the cloud, as well as niche SaaS players. However, Amagi distinguishes itself by offering an end-to-end “glass-to-glass” platform rather than just isolated solutions.

    Amagi is currently a growth-stage company. It is reinvesting its profits back into technology, infrastructure, and acquisitions to capture more market share. Therefore, it is unlikely to pay dividends in the near future.

    This is an industry term indicating that Amagi handles the video signal from the moment it is captured (the camera lens glass) to the moment it is viewed (the TV or phone screen glass), handling processing, distribution, and monetization in between.

    Disclaimer: This blog is intended solely for educational and informational purposes and should not be construed as investment advice or a recommendation. While efforts have been made to ensure the accuracy and reliability of the information and data presented, no representation or warranty, express or implied, is made regarding its completeness or correctness. Readers are advised to independently verify all information and consult a qualified financial advisor before making any investment decisions. Investments in the securities market are subject to market risks. Please read all relevant offer documents and disclosures carefully before investing.

  • Bharat Coking Coal IPO 2026: Comprehensive Review of Financials & Growth Potential

    Bharat Coking Coal IPO 2026: Comprehensive Review of Financials & Growth Potential

    India’s infrastructure ambitions are massive, and steel is the backbone of that growth. While many investors focus on steel manufacturers, smart retail investors often look upstream to the raw materials that make steel production possible. This brings us to the upcoming initial public offering (IPO) of Bharat Coking Coal Limited (BCCL). As a subsidiary of the state-owned giant Coal India Limited, BCCL holds a unique and dominant position in the energy sector.

    Scheduled to open for subscription in January 2026, this IPO represents a significant opportunity for the public to own a stake in India’s largest producer of coking coal. But is this public sector undertaking (PSU) a solid addition to your portfolio? To help you make an informed decision, we are breaking down the company’s business model, analyzing its financial health, and evaluating the long-term growth prospects.

    IPO Snapshot: Key Dates and Details

    Before analyzing the fundamentals, let’s look at the logistical details of the offer. The IPO is structured entirely as an Offer for Sale (OFS), meaning the promoter, Coal India Limited, is selling a portion of its stake to the public. BCCL itself will not receive proceeds from this issue.

    Here are the essential details you need to mark on your calendar:

    • IPO Open Date: January 9, 2026
    • IPO Close Date: January 13, 2026
    • Price Band: ₹21 to ₹23 per share
    • Lot Size: 600 Shares
    • Total Issue Size: ₹1,071 Crore
    • Tentative Listing Date: January 16, 2026
    • Listing Exchanges: BSE and NSE

    For retail investors, the entry point is accessible, with the price band set between ₹21 and ₹23, and interested investors can apply now during the offer period to participate in the listing.

    Company Overview: The Coking Coal Monopoly

    To understand the value of BCCL, you must understand the difference between thermal coal and coking coal. While thermal coal is used to generate electricity, coking coal is an irreplaceable ingredient in steel manufacturing.These fundamentals form the basis of the Bharat Coking Coal Ltd. IPO details for investors evaluating the company.

    Bharat Coking Coal Limited is the undisputed leader in this space. As of FY25, the company accounted for 58.50% of domestic coking coal production. More importantly, BCCL is the only source of prime coking coal in India. This gives the company a significant competitive moat.

    Operational Footprint

    BCCL operates primarily in the Jharia coalfield in Jharkhand and the Raniganj coalfield in West Bengal. These are historic mining zones with rich deposits. The company currently manages:

    • 34 Operational Mines: A mix of opencast, underground, and mixed projects.
    • 5 Operational Washeries: Located at Moonidih, Madhuband, Dahibari, Patherdih I, and Madhuband NLW.

    The company is also backed by a massive resource base of approximately 7.91 billion tonnes, providing high visibility for long-term production.

    Revenue Model

    BCCL generates revenue through three main channels:

    1. Raw Coal: Sales of coking coal to steel plants and non-coking coal to power plants.
    2. Washed Coal: Coal that has been processed to reduce ash content, fetching a higher price.
    3. By-products: Sales of middlings, slurry, and rejects.

    The clientele is impressive, consisting largely of Public Sector Undertakings (PSUs) and major power producers like SAIL, NTPC, and Damodar Valley Corporation.

    Industry Landscape: The Demand for Steel

    The investment case for BCCL is closely tied to India’s steel industry. The government has set an ambitious target to reach a crude steel capacity of 300 million tonnes per annum (MTPA) by FY31. Since coking coal is a non-substitutable input for steel, demand is expected to remain robust.

    Currently, India imports about 90% of its coking coal requirements, mostly from Australia and the USA. This high import dependence is a strategic vulnerability for the country. Under the “Atma-Nirbhar Bharat” (Self-Reliant India) initiative, the government is pushing hard for import substitution.

    This is where BCCL plays a critical role. By expanding its production and washing capabilities, BCCL aims to replace expensive imported coal with domestic supply. This macro-economic tailwind provides a long runway for growth.

    Financial Analysis: A Deep Dive

    For a retail investor, the numbers tell the real story. Let’s analyze BCCL’s financial performance over the last few years to gauge its stability and profitability.

    Revenue Trends

    BCCL has shown consistent sales performance.

    • FY23 Sales: ₹132,809 Million
    • FY24 Sales: ₹140,453 Million
    • FY25 Sales: ₹139,984 Million

    While sales were relatively flat in FY25, projections for the future are optimistic. Revenue is forecast to grow to ₹153,798 Million in FY26 and ₹172,995 Million in FY27. This growth is expected to be driven by increased production volumes and better realization per tonne.

    Profitability and Margins

    The company has seen a significant improvement in its operating margins.

    • EBITDA Margin: Jumped from 4% in FY23 to 15% in FY24, stabilising at 13% in FY25.
    • Net Profit: Rose from ₹6,647 Million in FY23 to ₹12,401 Million in FY25.

    It is worth noting that FY25 saw a dip in profit compared to FY24 (which was ₹15,644 Million). This was largely due to external headwinds, including excessive rainfall that hampered production and offtake. However, cost efficiency measures helped mitigate the impact.

    Balance Sheet Strength

    One of the most attractive features of BCCL for a risk-averse retail investor is its debt-free balance sheet. The company has no long-term borrowings and has successfully eliminated accumulated losses as of FY24. This financial resilience allows the company to invest in modernization without the burden of high interest payments.

    Key Ratios

    • Return on Net Worth (RoNW): Stood at 20.83% in FY25, indicating efficient use of shareholder equity.
    • Return on Capital Employed (ROCE): A healthy 30.13% in FY25, showing strong returns on the capital invested in the business.
    • Earnings Per Share (EPS): ₹2.7 in FY25, projected to rise to ₹3.3 in FY26 and ₹3.7 in FY27.

    SWOT Analysis

    Bharat Coking Coal IPO 2026

    Every investment carries risks and rewards. Here is a breakdown of BCCL’s position:

    Strengths

    • Market Dominance: Largest producer of coking coal in India.
    • Parentage: Backed by Coal India Limited, ensuring financial and technical support.
    • Integrated Operations: Strong rail and road connectivity in mining zones.
    • Financial Health: Zero long-term debt and strong cash flow generation potential.

    Weaknesses

    • Quality Issues: Domestic coal has high ash content, requiring washing/beneficiation before it can be used in steel production.
    • Geographic Concentration: Operations are concentrated in Jharia and Raniganj, making the company vulnerable to regional disruptions.
    • Legacy Issues: The Jharia coalfield faces environmental challenges, including underground mine fires and land subsidence.

    Opportunities

    • Washery Expansion: BCCL is adding 7.00 MTPA of new washery capacity. This will improve the quality of coal, making it more competitive against imports.
    • Import Substitution: As steel demand rises, domestic steelmakers are eager to source local coal to reduce costs.
    • Diversification: The company is expanding into Coal Bed Methane (CBM) and solar power, opening new revenue streams.

    Threats

    • Green Transition: The long-term global shift toward renewable energy and India’s net-zero 2070 target poses a structural risk to the coal industry.
    • Regulatory Changes: Stricter environmental norms could increase compliance costs.

    Yes, BCCL is a wholly-owned subsidiary of Coal India Limited, which is a Maharatna PSU under the Ministry of Coal, Government of India.

    Thermal coal is burned to create steam for electricity generation. Coking coal (metallurgical coal) is baked in a furnace to create coke, which is used to smelt iron ore into steel. BCCL specializes in coking coal.

    This IPO is an Offer for Sale (OFS). This means existing shares held by the promoter (Coal India) are being sold to the public. The money goes to the promoter, not the company’s treasury.

    The minimum investment for a retail investor is one lot. With a lot size of 600 shares and a price band of ₹21-₹23, the minimum investment would be between ₹12,600 and ₹13,800.

    No, as of the latest financial reports, BCCL has a debt-free balance sheet with no long-term borrowings.

    Disclaimer: This blog is intended solely for educational and informational purposes and should not be construed as investment advice or a recommendation. While efforts have been made to ensure the accuracy and reliability of the information and data presented, no representation or warranty, express or implied, is made regarding its completeness or correctness. Readers are advised to independently verify all information and consult a qualified financial advisor before making any investment decisions. Investments in the securities market are subject to market risks. Please read all relevant offer documents and disclosures carefully before investing.

  • Personal Finance Is More About Behavior Than Numbers: Why Mindset Drives Wealth

    Personal Finance Is More About Behavior Than Numbers: Why Mindset Drives Wealth

    We have all been there. We sit down with a calculator, a spreadsheet, or a budgeting app. We crunch the numbers. We figure out exactly how much we need to save each month to be a millionaire by age 60. The math is simple. It makes perfect sense.

    But then, the weekend comes. A friend invites us out for a fancy dinner. Or we see a new phone that looks amazing. Suddenly, the plan goes out the window.

    Why does this happen? The math didn’t change. The spreadsheet is still right there.

    The truth is, managing money isn’t really about math. It’s about behavior. It’s about how we think, how we feel, and the habits we build every single day. If personal finance were just about numbers, everyone who knows how to add and subtract would be rich. But they aren’t.

    In this guide, we will explore why your financial success depends less on your IQ and more on your “EQ” (emotional intelligence). We will look at why behavior beats math, and how you can trick your brain into making better money choices.

    Why Numbers Are Easy but Behavior Is Hard

    Let’s be honest: the math behind getting rich is incredibly boring and simple.

    You don’t need to know complex calculus. You really only need fourth-grade math. Here is the formula for wealth:

    • Spend less than you earn.
    • Invest the difference.
    • Wait a long time.

    That’s it. So why is it so hard to do?

    Because we are human beings, not robots. We have feelings, fears, and desires.

    Knowledge Does Not Equal Action

    Knowing what to do is very different from actually doing it. This is called the “Knowing-Doing Gap.”

    Think about diet and exercise. We all know we should eat vegetables and go for a run. That is simple knowledge. But doing it when there is a pizza in front of you and Netflix on TV? That is behavior.

    Money works the same way. You might know what an “SIP” (Systematic Investment Plan) is. You might know that credit card interest is bad. But when you are stressed after a long work week, swiping that card for a little “retail therapy” feels good in the moment.

    Key Stat: According to a study by the National Bureau of Economic Research, financial literacy classes have almost no effect on whether people actually save more money. Why? Because they teach math, not habit change.

    Emotional Decisions Cost More Than Bad Math

    Most people think they lose money because they didn’t pick the “right” stock or they didn’t know a secret investing trick.

    In reality, most money is lost because of emotions. Our brains are wired to react to fear and greed. These instincts helped our ancestors survive in the wild, but they are terrible for our bank accounts.

    The Fear Factor

    When the stock market crashes, it looks scary. The news headlines are red. Everyone says “the economy is collapsing.”

    Math says: “Stocks are on sale! Buy more at a low price.”
    Behavior says: “Run away! Sell everything before it goes to zero!”

    When you panic and sell, you turn a temporary drop into a permanent loss.

    The Greed Trap

    On the flip side, when everyone is making money on a hot new investment—like a trendy tech stock or cryptocurrency—we feel “FOMO” (Fear Of Missing Out).

    Math says: “This is overpriced and risky.”
    Behavior says: “Everyone else is getting rich! I need to get in now!”

    This usually leads to buying high and losing money when the hype dies down.

    Real-Life Example: In 2020 and 2021, many new investors jumped into “meme stocks” because they saw people bragging on social media. Many of them lost huge amounts of money because they were chasing hype (emotion) instead of looking at the company’s value (logic).

    Consistency Beats Intelligence

    You do not need to be a genius to be wealthy. In fact, being too smart can sometimes hurt you.

    Smart people often try to “outsmart” the market. They try to time their trades perfectly. They analyze charts for hours. They think they can predict the future.

    But study after study shows that simple consistency wins.

    The Story of Ronald Read

    There is a famous story about a man named Ronald Read. He was a janitor and a gas station attendant. He didn’t have a high salary. He didn’t have a finance degree.

    But when he died at age 92, he had over $8 million.

    How? He wasn’t a genius. He just saved a little bit of money every single month and bought boring stocks. He never sold them. He let them grow for decades.

    Compare that to high-paid Wall Street traders who panic, trade too much, and often go bust. Ronald Read won because his behavior was perfect, even if his math skills were average.

    The Golden Rule: Time in the market beats timing the market.

    Why We Don’t Follow Our Own Advice

    If you asked 100 people on the street, “Should you save for retirement?”, 99 of them would say “Yes.”

    But if you look at their bank accounts, many have saved nothing.

    Why do we ignore our own good advice?

    1. Present Bias

    This is a fancy term that means we value “now” much more than “later.”

    • Spending $100 on a nice dinner tonight feels great now.
    • Putting $100 into a retirement account feels like throwing money into a black hole that you can’t touch for 30 years.

    Our brains struggle to connect with our “future selves.” To your brain, “Future You” is like a stranger. And who wants to save money for a stranger?

    2. Keeping Up with the Joneses

    We are social creatures. We look at what our friends, neighbors, and coworkers are doing.

    If your friend buys a new car, you feel a little pressure to upgrade yours. If everyone on Instagram is traveling to Europe, you feel like you deserve a vacation too.

    This is lifestyle inflation. It has nothing to do with what you can afford (math). It has everything to do with social status (behavior).

    Money Is Personal, Not Just Logical

    There is a reason it is called Personal Finance.

    If money were purely logical, there would be one “correct” way to handle it for everyone. But that’s not true because we all have different histories.

    Your relationship with money is shaped by:

    • Your Childhood: Did your parents fight about money? Was money scarce? Or was it never discussed?
    • Your Experiences: Did you lose a job once and struggle? You might be more scared of investing than someone who has always had a steady job.

    The “Sleep Well at Night” Factor

    Sometimes, the mathematically “wrong” decision is the right behavioral decision if it helps you sleep.

    For example, paying off a mortgage early.

    • The Math: Mortgage interest rates are often low (say, 4% or 5%). You could invest that extra money in the stock market and maybe earn 8% or 10%. Math says: Don’t pay off the house. Invest instead.
    • The Behavior: Being debt-free feels amazing. It lowers your stress. It gives you security.

    If paying off your house gives you peace of mind, it is the right choice, even if the calculator says you could have made more money elsewhere.

    Small Behavioral Fixes That Work

    Since we know our brains are the problem, we need to trick them. We need to design a system where doing the right thing is easy, and doing the wrong thing is hard.

    Here are a few behavioral hacks that work better than willpower.

    1. Automate Everything

    This is the most powerful tool you have.
    If you have to manually transfer money to savings every month, you will eventually forget or find a reason not to do it.

    Instead, set it up so money leaves your paycheck and goes into investments before it hits your checking account. If you don’t see it, you won’t spend it. You are taking the “choice” out of the equation.

    For example, when you open demat account online, you can easily automate SIPs and long-term investments with just a few clicks. This removes emotional decision-making and helps you stay consistent without constantly thinking about when or how to invest.

    2. The 24-Hour Rule

    This helps with impulse buying. If you see something you want to buy (that isn’t a necessity like food), force yourself to wait 24 hours.

    Usually, the emotional excitement fades after a day. You will wake up the next morning and realize, “I don’t actually need that.”

    3. Stop Checking Your Portfolio

    If you are investing for the long term (10+ years), checking your account every day is torture.

    • When it’s up, you want to sell to take profit.
    • When it’s down, you want to sell to stop the pain.

    Delete the app from your phone. Check it once a quarter. Ignorance can be profitable.

    4. Frame Spending in Hours, Not Dollars

    Before you buy a $200 gadget, look at your hourly wage. If you make $20 an hour, that gadget costs you 10 hours of your life sitting at a desk working.

    Ask yourself: “Is this gadget worth 10 hours of my life?”
    Often, the answer changes from “yes” to “no.”

    Conclusion: Master Your Mind, Master Your Money

    At the end of the day, a spreadsheet cannot save you. A calculator cannot stop you from impulse buying.

    Personal finance is 20% head knowledge and 80% behavior.

    You can have the best investment strategy in the world, but if you panic and sell at the first sign of trouble, that strategy is useless. Conversely, you can have a very average, boring strategy, but if you stick to it for 30 years without fail, you will likely end up wealthy.

    Stop worrying about finding the perfect stock or the secret formula. Start focusing on your habits. Automate your savings. Control your emotions. And be patient.

    That is the true secret to financial freedom.

    Frequently Asked Questions (FAQs)

    Not at all. You only need basic addition and subtraction. What matters more is patience, discipline, and the ability to control your emotions around spending and saving.

    Automation removes the need for willpower. Since people naturally get tired and distracted, automating bills and savings helps ensure consistency without relying on daily decision-making.

    Yes. If a decision makes you feel safer, more confident, or less stressed, it can still be a good choice. Emotional well-being and peace of mind are important factors in personal finance.

    Remind yourself that losses are not realized until you sell. Market downturns are normal, and history shows recovery over time. Limiting news exposure and avoiding frequent account checks can help.

    Short-term thinking is often the biggest issue. This includes overspending today or reacting to daily headlines instead of staying focused on long-term financial goals.

    Yes. Change works best when it starts small. Focus on one manageable habit, such as tracking spending for a week or saving a small amount consistently, and build from there.

    Lifestyle inflation can prevent long-term progress. When spending rises at the same pace as income, financial stress often remains the same, even though earnings increase.

  • Gujarat Kidney & Super Speciality IPO: Complete Review & Details

    Gujarat Kidney & Super Speciality IPO: Complete Review & Details

    The Indian healthcare sector has witnessed significant attention from investors in recent years, driven by rising health awareness, increasing insurance penetration, and government initiatives. Amidst this sectoral growth, regional healthcare providers are carving out niches in specific geographies and specialties.

    One such entity, Gujarat Kidney and Super Speciality Limited (GKSL), is set to launch its Initial Public Offering (IPO). Operating primarily in the state of Gujarat, the company focuses on secondary and tertiary care with a specific leadership position in renal sciences.

    This blog post provides a comprehensive review of the Gujarat Kidney and Super Speciality Limited IPO. We will examine the company’s business model, financial performance, industry landscape, and the specific details of the offer. Whether you are a seasoned investor or exploring the market for the first time, this guide aims to provide the neutral, factual information you need to understand this upcoming opportunity.

    About Gujarat Kidney and Super Speciality Limited

    Gujarat Kidney and Super Speciality Limited is a regional healthcare services provider based in Gujarat, India. The company operates a network of mid-sized multi-speciality hospitals. While they offer a broad range of medical services, they have established a distinct reputation in renal sciences (kidney care), including urology and nephrology.

    Core Business Model

    The company operates on an “asset-light” model. Instead of investing heavily in owning real estate for every facility, they often utilize leased premises or management contracts. This strategy allows the company to focus its capital on medical equipment, technology, and clinical teams rather than land and buildings. This approach is generally designed to improve the Return on Capital Employed (ROCE) and allow for faster expansion compared to traditional heavy-asset models.

    Medical Specializations

    GKSL categorizes its services into two main verticals:

    1. Secondary Care: General surgical services and routine medical treatments.
    2. Tertiary Care: High-end super-specialty treatments.

    Their leadership in renal sciences is significant, covering six urology sub-specialties. Beyond kidney care, the hospital chain has expanded its capabilities into cardiology, orthopedics, and advanced laparoscopic procedures.

    Operational Presence

    The company’s operations are concentrated in the central region of Gujarat. They currently operate seven multi-speciality hospitals and four in-house pharmacies. Their facilities are strategically located in:

    • Vadodara
    • Godhra
    • Bharuch
    • Borsad
    • Anand

    As per the Red Herring Prospectus (RHP), the total bed capacity across their network stands at 490 beds. This network allows them to serve a mix of urban and semi-urban populations, capturing patient flow from Tier-2 and Tier-3 cities where competition from large national chains is often lower.

    Revenue Mix

    Understanding who pays for the services is crucial for analyzing a hospital’s cash flow. GKSL has a payer mix dominated by self-paying patients:

    • Self-Payers: ~69%
    • Insurance/TPAs: ~21%
    • Government Schemes (e.g., PMJAY): ~10%

    A high percentage of self-payers often indicates strong brand trust in the local community, as patients are willing to pay out-of-pocket for services.

    Gujarat Kidney and Super Speciality Limited IPO Details

    The IPO is a Book Built Issue, meaning the price is discovered within a range rather than being fixed in advance. The issue comprises entirely of a fresh issue of shares, meaning the money raised will go into the company for growth and debt reduction, rather than to existing shareholders selling their stake.

    Here are the key schedules and figures you need to know:

    Feature Details
    IPO Open Date Monday, December 22, 2025
    IPO Close Date Wednesday, December 24, 2025
    Price Band ₹108 to ₹114 per share
    Lot Size 128 Shares
    Total Issue Size ₹250.8 Crores (approx)
    Fresh Issue ₹250.8 Crores (2.20 Crore shares)
    Offer For Sale (OFS) Nil
    Face Value ₹2 per share
    Listing Exchanges BSE, NSE
    Basis of Allotment Friday, December 26, 2025 (Tentative)
    Initiation of Refunds Monday, December 29, 2025 (Tentative)
    Credit to Demat Monday, December 29, 2025 (Tentative)
    Listing Date Tuesday, December 30, 2025 (Tentative)

    Investor Categories

    The allocation of shares is divided among different investor categories:

    • Qualified Institutional Buyers (QIB): Not more than 75% of the net offer.
    • Non-Institutional Investors (NII): Not less than 15% of the net offer.
    • Retail Individual Investors (RII): Not less than 10% of the net offer.

    This structure suggests that institutional participation is expected to be the primary driver of the book building process.

    Objectives of the Issue

    The company proposes to utilize the Net Proceeds from the Fresh Issue for the following specific goals:

    1. Inorganic Growth (Acquisitions): A significant portion (approx ₹77 Crores) is allocated for the proposed acquisition of Parekhs Hospital Private Limited in Ahmedabad. This marks their entry into a major metropolitan market.
    2. Debt Management: Repayment or prepayment of certain outstanding secured borrowings.
    3. Expansion of Stake: Increasing shareholding in their subsidiary, Harmony Medicare Private Limited, Bharuch.
    4. New Facilities: Capital expenditure for setting up a new women-focused hospital in Vadodara.
    5. Technology Upgrade: Purchase of the MAKO SmartRobotics™ System for their Vadodara facility, enhancing their orthopedic capabilities.
    6. General Corporate Purposes: To cover general operating expenses and other corporate needs.

    Industry Overview

    To understand the potential of GKSL, it is helpful to look at the broader landscape of the Indian healthcare industry.

    Market Size and Growth

    According to IBEF, India’s hospital market was valued at approximately US$ 98.98 billion in 2023. It is projected to grow at a Compound Annual Growth Rate (CAGR) of 8.0% from 2024 to 2032, potentially reaching an estimated value of US$ 193.59 billion.

    Key Drivers

    Several factors are fueling this growth:

    • Demographics: An aging population and a rise in lifestyle-related non-communicable diseases (NCDs) are increasing the demand for tertiary care.
    • Bed Density: India currently has a shortage of hospital beds relative to its population. The country aims to achieve a target of 3 beds per 1,000 people, necessitating the addition of millions of new beds by 2025.
    • Policy Support: Government initiatives like Ayushman Bharat (PM-JAY) have expanded healthcare access to millions, although GKSL currently derives only about 10% of its revenue from such schemes.
    • Medical Tourism: India is becoming a hub for affordable, high-quality medical procedures, attracting international patients.

    Regional Opportunity

    Gujarat specifically faces a shortfall in hospital beds compared to global norms. This gap presents an expansion opportunity for regional players like GKSL to penetrate Tier-2 and Tier-3 cities where large national corporate hospitals may not yet have a deep presence.

    Financial Performance

    Investors should carefully review the company’s financial history. GKSL has shown a sharp increase in revenue and profitability in the most recent fiscal year, largely driven by its acquisition strategy.

    Note: The figures below represent restated consolidated financial information.

    Parameter FY 2023 FY 2024 FY 2025
    Revenue from Operations Nil ₹4.77 Cr ₹40.24 Cr
    Profit After Tax (PAT) (Loss ₹0.006 Cr) ₹1.71 Cr ₹9.49 Cr
    EBITDA Margin 40.86% 41.12%
    Return on Net Worth (RoNW) 1.67% 15.86% 36.61%

    Analysis: The massive jump in FY25 revenue (from ₹4.77 Cr to ₹40.24 Cr) is attributed to the integration of acquired hospitals and the full-year operations of new units. The company maintains healthy EBITDA margins above 40%, which is competitive for the hospital sector.

    To view the current market performance of the company after it lists, you can check the Guj. Kidney & Super Share Price page.

    Strengths of the Company

    1. Leadership in Renal Sciences: The company has a specialized niche in nephrology and urology, which serves as a differentiator in the crowded multi-specialty market.
    2. Asset-Light Model: By leasing properties rather than buying land, the company can expand faster and maintain a better Return on Capital Employed (ROCE).
    3. Strategic Locations: Their presence in high-growth districts of Gujarat (like Bharuch and Anand) positions them to capture patient volume that might otherwise travel to Ahmedabad or Mumbai.
    4. Acquisition Track Record: The company has successfully acquired and integrated units like Ashwini Medical Centre and Harmony Medicare, demonstrating an ability to grow inorganically.
    5. High Retention: The RHP indicates low attrition rates among doctors and nurses, which is critical for maintaining service quality in healthcare.

    Risks and Considerations

    Every investment carries risk. Here are some specific concerns related to GKSL:

    1. Geographical Concentration: The company is entirely dependent on the Gujarat market. Any adverse regulatory changes or economic downturns specific to the state could impact operations.
    2. Integration Risk: A significant portion of the IPO proceeds is for acquiring Parekhs Hospital. Mergers and acquisitions carry the risk of integration challenges, culture clashes, or lower-than-expected synergies.
    3. Regulatory Hurdles: The healthcare sector is subject to strict regulations regarding pricing (e.g., caps on stent prices), biomedical waste, and licenses. Non-compliance can lead to severe penalties.
    4. Competition: The company faces competition from large listed peers like Yatharth Hospital and GPT Healthcare, as well as unorganized local nursing homes.
    5. Dependence on Key Personnel: As a specialized service provider, the business relies heavily on the reputation and availability of its specialist doctors.

    For New Investors:

    If you do not have a Demat account yet, you will need to create one to participate in the stock market. You can Open Demat Account easily with Findoc to get started.

    Once your account is active, you can Apply Now for this and other upcoming IPOs.

    Conclusion

    The Gujarat Kidney and Super Speciality Limited IPO offers investors an opportunity to invest in a growing regional healthcare chain with a specific focus on renal sciences. The company’s asset-light model and acquisition-led growth strategy have resulted in a significant jump in financial performance in FY25.

    However, potential investors must weigh these strengths against the risks of geographical concentration and the challenges inherent in integrating new acquisitions. The healthcare sector is capital-intensive and highly regulated, requiring consistent operational efficiency to maintain margins.

    As always, investors should review the Red Herring Prospectus (RHP) carefully and consider their own financial goals and risk tolerance before participating in the issue.

    Frequently Asked Questions

    The minimum investment is for 1 lot, which contains 128 shares. At the upper price band of ₹114, the minimum investment amount is ₹14,592.

    Based on the issue size of over ₹250 crore and the allocation structure across QIB, NII, and Retail categories, this is a Mainboard IPO. The shares will be listed on both BSE and NSE.

    The tentative date for the finalization of the basis of allotment is Friday, December 26, 2025.

    The face value of each equity share is ₹2.

    MUFG Intime India Limited is the registrar for the IPO. Investors can check their allotment status on the registrar’s official website.

    Disclaimer: This blog is intended solely for educational and informational purposes and should not be construed as investment advice or a recommendation. While efforts have been made to ensure the accuracy and reliability of the information and data presented, no representation or warranty, express or implied, is made regarding its completeness or correctness. Readers are advised to independently verify all information and consult a qualified financial advisor before making any investment decisions. Investments in the securities market are subject to market risks. Please read all relevant offer documents and disclosures carefully before investing.