
A hammer candlestick pattern is a single-candle formation that may signal rejection of lower prices after a decline. This guide explains its meaning, types, interpretation and limitations, so readers can assess the pattern as part of a broader technical analysis process. Investors learning about market analysis can also open a demat account online.
What Is a Hammer Candlestick Pattern?
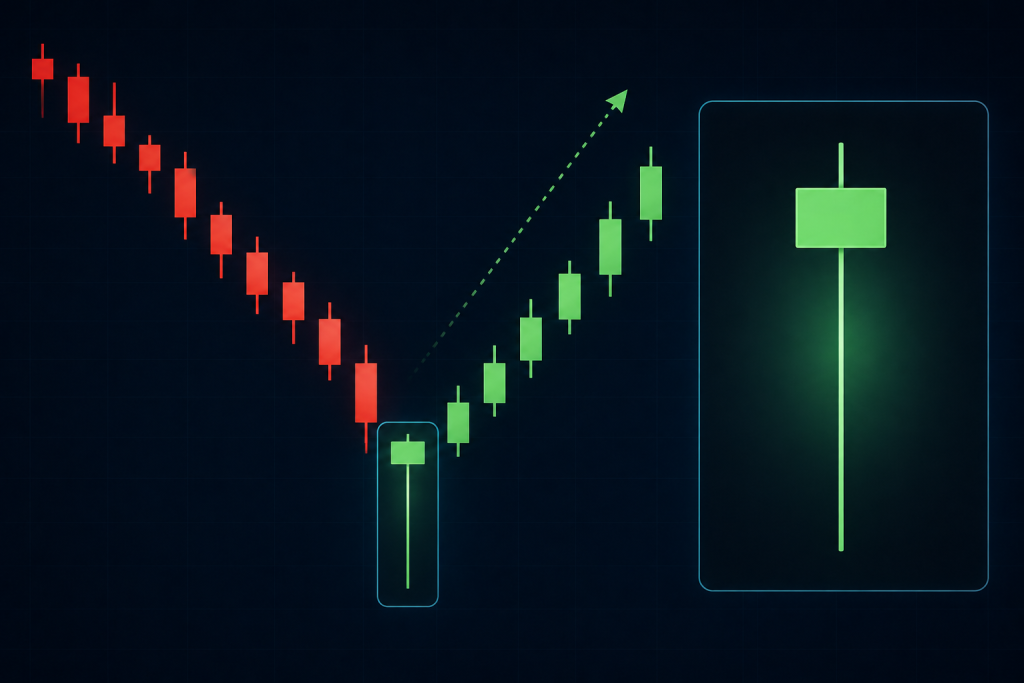
A hammer candlestick pattern is a single-candle formation that commonly appears after a downward price move. It has a small real body and a long lower shadow, which indicates that prices have declined during the session but were later supported by buying interest. In the hammer in the stock market context, this structure reflects rejection of lower levels. While it may suggest improving sentiment, it should be assessed alongside broader market conditions and confirmation from subsequent price action.
Also Read: Expert Stock Market Technical Analysis
Importance of Hammer Candlestick Patterns
A hammer pattern is important because it highlights price rejection at lower levels and may indicate a potential shift in market sentiment. Analysts often review the hammer candle to identify whether selling pressure is weakening and buying interest is emerging. When combined with confirmation from subsequent price movement, it can provide useful context within broader technical analysis.
During a hammer’s formation, sellers push the price lower, creating the lower shadow. The recovery toward the top of the candle’s range may suggest that buyers responded before the session ended. This price action can indicate that lower levels were rejected during that session, but it does not prove that a sustained reversal will follow.
Additional Read: Fundamental Analysis in the Share Market
Types of Hammer Candlestick
Hammer formations appear after a decline and highlight rejection of lower prices, but their structures differ slightly. The two most recognised variations are the Bullish Hammer and the Inverted Hammer.
1. Bullish Hammer
A Bullish Hammer has a small real body positioned near the top of the candle and a long lower shadow. This structure shows that the price fell during the session, but buyers entered decisively at lower levels, pushing the price back toward the open. It is often viewed as an early indication that selling pressure may be weakening and that demand is beginning to emerge.
2. Inverted Hammer
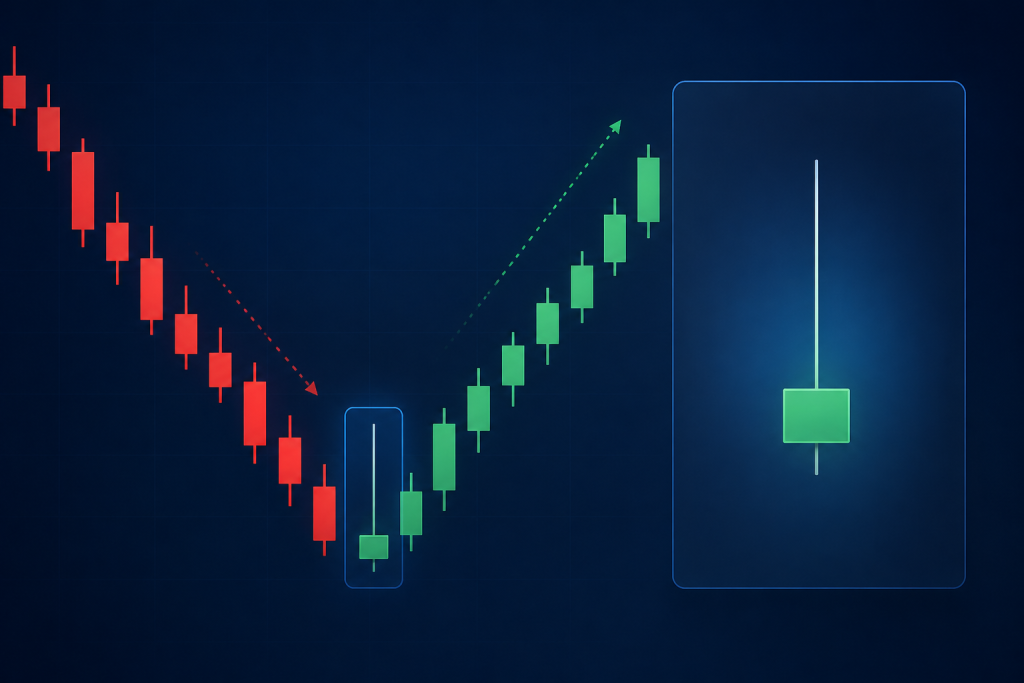
An Inverted Hammer has a small body near the lower end of the candle and a long upper shadow. It forms after a downtrend and reflects an attempt by buyers to lift the price, even though sellers later drove it back near the open. If the candle that follows closes higher, it may support the view that buying interest is strengthening despite earlier downward momentum.
Both variations suggest that lower levels have been tested and may indicate early signs of shifting sentiment, subject to further confirmation.
The inverted hammer is a related bullish reversal formation that may appear after a decline. It differs from the classic hammer in its shape: the inverted hammer has a long upper shadow, while the classic hammer has a long lower shadow. Both patterns require context and should not be treated as confirmation of a reversal on their own.
Also Read: Types of Trading in the Stock Market
Hammer vs Related Candlestick Patterns
| Pattern | Typical Shape | Common Context |
|---|---|---|
| Hammer | Small body near the top, long lower shadow | After a decline |
| Inverted hammer | Small body near the bottom, long upper shadow | After a decline |
| Hanging man | Similar shape to a hammer | After an advance |
| Shooting star | Small body near the bottom, long upper shadow | After an advance |
| Doji | Open and close are close together; shadows can vary | Context-dependent |
Similar-looking candle shapes can have different interpretations depending on the preceding trend and subsequent price action.
Also Read: Candlestick Patterns Every Trader Should Know
Interpretation of Hammer Candlesticks
Interpreting a hammer candlestick involves examining how the price moved during the session and what that movement suggests about market sentiment. The candle typically shows that prices opened, declined as sellers dominated early trading, and later recovered as buyers entered at lower levels, resulting in a close near the upper portion of the candle’s range.
A hammer pattern is generally considered more meaningful when:
- It forms after a series of preceding bearish candles.
- The candle that follows closes above the hammer’s high, offering confirmation.
- The lower shadow is significantly longer than the real body, indicating strong rejection of lower prices.
These factors collectively help assess whether selling pressure is weakening and whether buyers are beginning to show interest at lower levels. Findoc explains such pattern-based interpretations in a structured and accessible manner, helping readers understand how these signals fit into broader technical analysis.
Body and shadow proportions are visual guidelines, not guarantees of a reversal. Some analysts look for a following candle that closes above the hammer’s high as confirmation, but confirmation does not make the signal certain.
Trading Strategies Based on Hammer Pattern
The hammer pattern is often assessed alongside other technical factors to determine whether sentiment is shifting. Common approaches include:
- Reviewing the candle that follows the hammer to check whether it closes higher, offering confirmation.
- Using established support levels to assess whether the rejection of lower prices aligns with the broader market structure.
- Considering volume behaviour to gauge the strength of buying interest at lower levels.
- Avoiding the interpretation of hammer formations that appear within sideways or low-momentum market conditions.
These considerations help place the hammer pattern within a broader framework of technical analysis.
When assessing a hammer pattern, analysts may consider whether it appears near a support level, whether trading volume changes, and whether the broader trend supports the interpretation. These factors provide context; they do not guarantee that a reversal will occur.
How to Trade the Hammer Candlestick Pattern
When analysing a hammer candlestick pattern, traders typically follow a structured approach to understand whether buying interest is emerging at lower levels. Key steps include:
- Identifying the hammer at the end of a clear downtrend.
- Ensuring the lower shadow is significantly longer than the real body.
- Waiting for the next candle to close above the hammer’s high as confirmation.
- Considering trade entries only after confirmation is established.
- Placing a stop loss below the hammer’s low to manage risk.
- Setting potential targets based on nearby resistance zones or previous price levels.
These steps help integrate the hammer pattern into a disciplined technical analysis process.
Confirmation does not remove the risk of loss, and traders may assess the same setup differently. Entry, exit and risk decisions depend on the wider market context and an individual’s trading plan; the candle alone does not determine an appropriate trade.
Tips for Trading with Hammer Candlestick Pattern
When evaluating a hammer candlestick pattern, the following considerations can help place the formation within a broader analytical context:
- Look for confirmation from the subsequent candle to understand whether buying interest is strengthening.
- Review the proportion of the lower shadow to the real body, as deeper rejection may reflect stronger intraday demand.
- Use trendlines, moving averages, or broader trend structure to contextualise the pattern.
- Exercise caution with hammers that have relatively small shadows or appear in low-momentum market environments.
- Apply disciplined risk-management principles when interpreting any candlestick formation.
- Avoid relying solely on patterns without considering additional technical or market factors.
Also Read: What is Intraday Trading?
Example of Hammer Candlestick Pattern
For instance, if a stock declines over several sessions. One day, the stock opens at 100, drops to 90, but closes at 102. This structure forms a hammer candlestick, indicating rejection of lower prices. If the following session opens higher and closes above this level, buying interest is likely to strengthen after the earlier decline.
A contrasting hypothetical case would be a hammer followed by a session that closes below the hammer’s high or continues lower. In that case, the pattern would not receive the same confirmation, and its interpretation would remain uncertain. The example illustrates why a hammer candle should be assessed with subsequent price action and broader market context.
Limitations of Hammer Candlestick Pattern
While the hammer candlestick pattern is a useful analytical formation, it has certain limitations that should be considered:
- A hammer does not indicate a reversal in every instance.
- Confirmation from the subsequent candle is generally required.
- The pattern may be less effective during strong or persistent downtrends.
- It does not indicate the duration or strength of any potential reversal.
- Additional technical tools are necessary to build a broader market view.
Findoc presents these considerations in a structured manner to help readers understand the context in which hammer formations may be interpreted more effectively.
Common Mistakes While Using Hammer Candlestick Pattern
When interpreting a hammer candlestick pattern, certain errors can affect the accuracy of the analysis. Common mistakes include:
- Entering the trade before the pattern receives confirmation from the next candle.
- Interpreting hammer formations that appear in sideways or low-momentum market conditions.
- Relying solely on the hammer pattern without checking other technical indicators.
- Overlooking the proportion between the shadow and the real body.
- Placing stop-loss levels too close to the candle’s low may lead to premature exits.
Recognising these mistakes can help apply the hammer pattern within a more disciplined analytical framework.
Conclusion
The hammer candlestick pattern is a trusted technical analysis formation that shows rejection of lower prices and may signal early signs of shifting sentiment after a downtrend. Its effectiveness improves when evaluated in conjunction with confirmation and a wider market context. Findoc presents these concepts in a clear, structured manner, enabling readers to understand how individual patterns contribute to overall chart interpretation.
The hammer candlestick pattern may indicate that lower prices were rejected after a decline, but it is not a reversal signal on its own. Consider the candle’s shape, trend context and subsequent price action alongside other relevant analysis.
Explore Related Topics
Frequently Asked Questions
A hammer candlestick pattern is a single candle with a small body and a long lower shadow. It forms when prices decline during a session, but recover significantly before the close, indicating rejection of lower levels.
Its reliability improves when it appears after a downtrend and is supported by confirmation from the following candle. However, like all chart patterns, it should be assessed alongside broader market conditions.
It is generally not used in isolation. The pattern is more meaningful when combined with additional indicators such as volume, trend structure, or established support levels.
If the price does not show confirmation in the next session, the pattern remains inconclusive. In such situations, analysts usually avoid drawing conclusions based solely on the hammer.
The pattern can appear across multiple timeframes. Many analysts refer to higher timeframes, such as hourly or daily charts, for clearer signals and reduced noise.
Yes. The colour of the real body is less important than the presence of a long lower shadow, which indicates that lower prices were rejected during the session.
Both candles look similar, but their context differs. A hammer forms at the bottom of a downtrend and is associated with potential bullish reversal, while a hanging man appears after an uptrend and may indicate emerging selling pressure.
A hammer candlestick may indicate that a price decline was followed by buying interest and rejection of lower levels. It is generally interpreted in context and does not confirm a reversal on its own.
Look for a small real body near the upper end of the candle’s range and a longer lower shadow, typically after a decline. Analysts may also consider the surrounding trend and subsequent price action when assessing the pattern.
A hammer has a small body near the top of its range and a long lower shadow. An inverted hammer has a small body near the bottom and a long upper shadow; both may appear after a decline, but they have different candle shapes.
A hammer has a long lower shadow and typically appears after a decline. A shooting star has a long upper shadow and is typically assessed after an advance. Context and subsequent price action matter when interpreting either formation.
Yes, but a candle resembling a hammer in a sideways market may not carry the same implications as one appearing after a clear decline. Its context and any subsequent confirmation should be considered.
If following price action does not support the initial interpretation, the hammer remains inconclusive. Traders and analysts may assess other market evidence rather than relying on the candle alone.
Leave a Reply