findocblog

Category: IPOs

  • NSE IPO to Open September 17 at ₹1,700–₹1,785: What Investors Should Know Before Applying

    NSE IPO to Open September 17 at ₹1,700–₹1,785: What Investors Should Know Before Applying

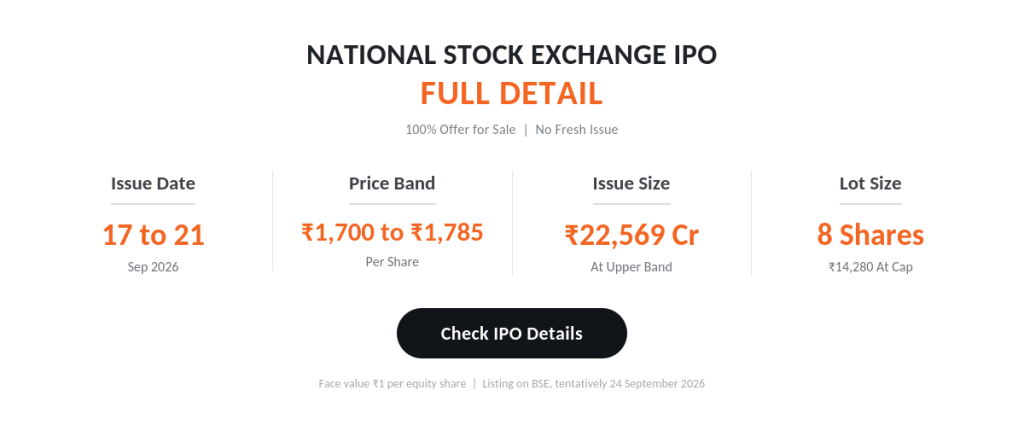
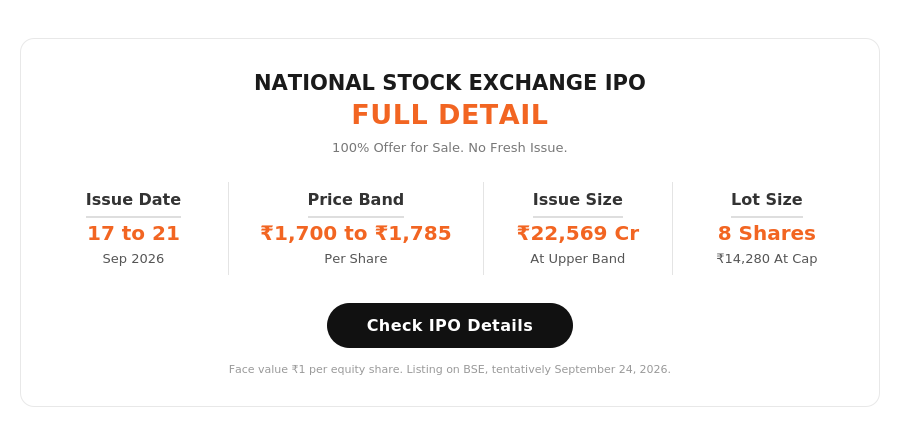
    The NSE IPO opens on Thursday, September 17 and closes on Monday, September 21, with a price band of ₹1,700 to ₹1,785 per share. The offer was cut by about 15% after the draft stage and now raises up to ₹22,569 crore.

    Key Takeaways

    • The NSE IPO price band is ₹1,700 to ₹1,785 per share, on a face value of ₹1.
    • Bidding runs from September 17 to September 21, with listing on BSE tentatively on September 24.
    • The offer shrank from 6.02% of the company in the draft prospectus to about 5.11% in the final one.
    • At the cap, NSE is valued near ₹4.42 lakh crore, or 42.9 times FY26 earnings, against 66.67 times recorded for BSE.
    • Retail investors need a minimum of 8 shares, costing ₹14,280 at the upper end.

    NSE IPO Price Band, Dates and Lot Size

    NSE filed its red herring prospectus with SEBI on September 10, 2026, fixing the terms of the issue. The band spans exactly 5%, the usual width for a book build of this size.

    The entire issue is an offer for sale by existing shareholders, so NSE receives none of the proceeds. Ashishkumar Chauhan is the managing director and chief executive officer.

    NSE IPO DetailParticulars
    Price band₹1,700 to ₹1,785 per share
    Issue opensThursday, September 17, 2026
    Issue closesMonday, September 21, 2026
    Basis of allotmentTuesday, September 22, 2026
    Shares credited and refundsWednesday, September 23, 2026
    Tentative listingThursday, September 24, 2026, on BSE
    Minimum lot8 shares, and multiples of 8 thereafter
    Retail minimum at the cap₹14,280
    Offer typeOffer for sale only, no fresh issue
    RegistrarMUFG Intime India Private Limited

    Offer terms as per the NSE red herring prospectus dated September 10, 2026. Listing dates are tentative.

    What Changed Between the Draft and the Final Prospectus?

    The most significant development is one the headlines mostly skip. NSE trimmed the size of the offer between its draft prospectus of June 17 and the final one of September 10.

    The draft proposed selling up to 14,89,05,525 shares, or 6.02% of the company. The final version offers up to roughly 12.64 crore shares, about 5.11%. That is close to 2.25 crore fewer shares, a reduction of around 15%.

    Offer SizeDraft Prospectus, June 17Red Herring Prospectus, September 10
    Shares offeredUp to 14,89,05,525Up to about 12.64 crore
    Stake on offer6.02%About 5.11%
    National Insurance CompanySelling 60,00,000 sharesNo longer selling
    SBI Capital MarketsNot a selling shareholderAdded, offering about 87.8 lakh shares

    Comparison of the June 17 draft prospectus with the September 10 red herring prospectus.

    State Bank of India, MS Strategic (Mauritius), Bank of Baroda, Stock Holding Corporation of India and General Insurance Corporation of India each reduced the number of shares they intend to sell.

    Canada Pension Plan Investment Board, Aranda Investments (Mauritius), The New India Assurance Company and United India Insurance Company left their portions unchanged.

    How Much Is NSE Worth at This Price Band?

    Applying the band to the full share count of 2,47,50,00,000 shares gives the implied market value of the exchange. Applying it to the shares on offer gives the size of the issue.

    At the Offer PriceFloor, ₹1,700Cap, ₹1,785
    Implied market capitalisation₹4,20,750 crore₹4,41,788 crore
    Size of the offer for saleAbout ₹21,494 croreAbout ₹22,569 crore
    Price to FY26 earnings40.8 times42.9 times
    Price to book value13.1 times13.8 times
    Yield on the FY26 dividend2.06%1.96%

    Multiples computed on FY26 basic and diluted EPS of ₹41.62, book value per share of ₹129.75 and the recommended FY26 dividend of ₹35 per share, as disclosed in the prospectus.

    How Does the NSE IPO Price Compare With BSE?

    The prospectus names BSE Limited as the only listed peer, since it runs a comparable multi-asset exchange with a similar revenue mix.

    It records BSE trading at 66.67 times FY26 diluted earnings, based on a closing price in June 2026. At the cap of ₹1,785, the NSE IPO is priced at 42.9 times the same year’s earnings.

    The comparison needs care. NSE earns roughly 3.4 times BSE’s operating revenue, but BSE reported the higher FY26 EPS at ₹60.61, a higher return on net worth at 45% against 33.21%, and a higher net asset value per share. The BSE multiple also moves with its market price, so check the live figure rather than the June reference.

    What Do the FY26 Numbers Behind the Price Show?

    NSE reported total income of ₹18,713 crore in FY26 and profit after tax of ₹10,302 crore, down 15.47% from ₹12,188 crore the year before. Operating revenue slipped 3.15% to ₹16,601 crore.

    Two things drove the fall. Trading volumes moderated after SEBI’s derivatives measures of October 2024 and May 2025, and the exchange took a one-time provision of ₹1,391.21 crore against settlement applications filed with SEBI.

    Strip out the one-offs and the picture shifts. Normalised operating EBITDA margin moved only from 77.69% to 76.23%, while the reported margin fell from 73.78% to 66.85%. Anyone valuing the issue on trailing earnings is working from a year carrying a large exceptional charge.

    How Is the NSE IPO Split Between Investor Categories?

    • Qualified institutional buyers: 50% of the net offer.
    • Non-institutional investors: 15%, with a minimum application of 120 shares, or ₹2,14,200 at the cap.
    • Retail individual investors: 35%, with a minimum of 8 shares at ₹14,280 at the cap.
    • Eligible employees: a reserved portion of up to 4,33,436 shares, aggregating up to ₹70 crore, with a discount of ₹170 per share.

    The employee discount brings the effective price for staff to ₹1,615 a share at the upper end of the band.

    What Should Investors Check Before Applying?

    The prospectus is candid about concentration. Transaction charges were 78.65% of operating revenue in FY26 and equity options alone contributed 60.22%, so a change in derivatives rules moves most of the business at once.

    The colocation and dark fibre matters also remain open, with settlement applications of ₹1,491.21 crore pending before SEBI and related appeals pending before the Supreme Court.

    Bidding requires a demat account to hold any shares allotted, and subscription figures, allotment status and the listing can be followed through an online trading platform once the issue opens.

    Investments in securities markets are subject to market risks. This article is for information purposes only and is not investment advice.

  • NSE IPO 2026: DRHP, 6.02% Stake Offer & Key Details

    NSE IPO 2026: DRHP, 6.02% Stake Offer & Key Details

    The NSE IPO moved a step closer as National Stock Exchange of India Limited filed its draft red herring prospectus dated June 17, 2026. Up to 14,89,05,525 shares, roughly 6.02% of its capital, are on offer, with listing proposed on BSE.

    Key Takeaways

    • The NSE IPO is a pure offer for sale of up to 14,89,05,525 shares, about 6.02% of pre-offer capital.
    • NSE itself receives no money from the issue, because there is no fresh issue component.
    • The shares are proposed to be listed on BSE, which is also the designated stock exchange for the offer.
    • Price band, offer size in rupees and bid dates are all still blank in the draft prospectus.

    What Is the NSE IPO and What Does the DRHP Propose?

    National Stock Exchange of India Limited has filed a draft red herring prospectus, or DRHP, for a 100% book-built offer. A DRHP is the draft disclosure document an unlisted company files before an IPO, carrying every material fact except the final price.

    The NSE IPO is for up to 14,89,05,525 equity shares of face value ₹1 each. Against a pre-offer capital of 2,47,50,00,000 shares, that works out to roughly 6.02% of the company.

    The total offer value, price band and minimum bid lot are all left blank in the draft. They will be decided by the company in consultation with the lead managers and advertised in English, Hindi and Marathi newspapers at least two working days before bidding opens.

    NSE IPO DetailAs Stated in the DRHP
    Document typeDraft Red Herring Prospectus, 100% book built
    Date of the draftJune 17, 2026
    Offer typeOffer for sale only, no fresh issue
    Shares offeredUp to 14,89,05,525 equity shares, face value ₹1
    Share of pre-offer capitalApproximately 6.02%
    Pre-offer share capital2,47,50,00,000 shares
    Total offer valueNot yet disclosed
    Proposed listing venueBSE Limited, also the designated stock exchange
    PromoterNo identifiable promoter
    Registrar to the offerMUFG Intime India Private Limited
    Employee quotaReservation for eligible employees, size not yet disclosed

    NSE IPO offer snapshot. Source: NSE Draft Red Herring Prospectus dated June 17, 2026.

    Is the NSE IPO a Fresh Issue or an Offer for Sale?

    The NSE IPO is entirely an offer for sale. There is no fresh issue component at all.

    In an offer for sale, existing shareholders sell their own shares and keep the proceeds. The company itself receives none of the money.

    The prospectus states the objects plainly: to carry out the offer for sale, and to achieve the benefits of listing on BSE. Proceeds go to each selling shareholder after deducting their share of offer expenses and taxes.

    The practical meaning for a reader is that this IPO does not fund any expansion plan. It is a liquidity event for shareholders who have held unlisted stock for years, and a route to a public market price for the exchange.

    Who Are the Selling Shareholders in the NSE IPO?

    The prospectus lists the ten largest selling shareholders on its cover, along with the weighted average cost of acquisition. That is the average price each one originally paid per share, adjusted for later corporate actions such as the bonus issue.

    The spread is striking. State Bank of India’s average cost works out to ₹0.80 a share, while Canada Pension Plan Investment Board’s is ₹324.13.

    Selling ShareholderShares Offered (up to)Avg. Cost per Share (₹)
    State Bank of India2,47,50,0000.80
    MS Strategic (Mauritius) Limited1,60,00,00066.54
    Canada Pension Plan Investment Board1,18,74,060324.13
    Aranda Investments (Mauritius) Pte Ltd1,12,46,33662.38
    Bank of Baroda1,09,86,2500.54
    Stock Holding Corporation of India Limited1,08,90,0000.46
    General Insurance Corporation of India1,06,58,0005.26
    The New India Assurance Company Ltd.1,05,00,0000.32
    National Insurance Company Limited60,00,0000.32
    United India Insurance Company Limited60,00,0000.50

    Top ten selling shareholders in the NSE IPO, as disclosed on the DRHP cover. Acquisition costs certified by Manian & Rao, Chartered Accountants, on June 17, 2026. The complete list appears in Annexure A of the prospectus.

    Who Owns NSE Before the IPO?

    The cover page carries a line most prospectuses do not: the company does not have an identifiable promoter. NSE ownership is spread across insurers, banks, global funds and individuals, with no single controlling group.

    Life Insurance Corporation of India is the largest shareholder at 10.72% of pre-offer capital. The twenty shareholders holding 1% or more together account for 52.76%.

    Largest Pre-Offer ShareholdersSharesStake (%)
    Life Insurance Corporation of India26,52,75,00010.72
    Aranda Investments (Mauritius) Pte Ltd11,24,63,3564.54
    Stock Holding Corporation of India Limited11,00,00,0004.44
    SBI Capital Markets Limited10,72,50,0004.33
    Mahagony Limited9,22,95,0003.73
    State Bank of India7,98,47,0503.23
    PI Opportunities Fund I5,82,00,0002.35
    Crown Capital Limited5,13,55,4652.07
    DVI Fund (Mauritius) Limited4,52,16,2151.83
    TIMF Holdings4,32,30,3571.75
    Radhakishan Shivkishan Damani3,90,84,4001.58
    Total of all shareholders above 1%1,30,61,79,55852.76

    NSE shareholding pattern before the IPO, based on the beneficiary position statement of June 15, 2026. The table shows the eleven largest of the twenty shareholders above 1%.

    How Will NSE IPO Shares Be Allotted?

    The NSE IPO follows the standard book-building split under SEBI ICDR Regulations, applied to the net offer, which is the total offer minus the employee reservation.

    • Qualified institutional buyers: not more than 50% of the net offer. Up to 60% of this can go to anchor investors, of which 33.33% is reserved for domestic mutual funds and 6.67% for life insurers and pension funds.
    • Non-institutional bidders: not less than 15%, split one-third for applications of ₹2 lakh to ₹10 lakh and two-thirds for applications above ₹10 lakh.
    • Retail individual bidders: not less than 35% of the net offer.
    • Eligible employees: a separate reserved portion, allotted proportionately.

    Every category except anchor investors must apply through ASBA, where the application money is blocked in the bank account rather than debited. Retail and employee applicants use the UPI route.

    Which Banks Are Managing the NSE IPO?

    The offer is being managed by twenty book running lead managers, an unusually large syndicate. They are Kotak Mahindra Capital, JM Financial, Morgan Stanley India, Citigroup Global Markets India, HSBC Securities and Capital Markets (India), J.P. Morgan India, SBI Capital Markets, Anand Rathi Advisors, Avendus Capital, Axis Capital, DAM Capital Advisors, Equirus Capital, HDFC Bank, ICICI Securities, IDBI Capital Markets & Securities, IIFL Capital Services, Motilal Oswal Investment Advisors, Nuvama Wealth Management, Pantomath Capital Advisors and 360 ONE WAM.

    Three of them, namely Morgan Stanley India, SBI Capital Markets and ICICI Securities, are associates of selling shareholders. Under the SEBI Merchant Bankers Regulations they will be involved only in marketing the offer, not in the wider due diligence role.

    NSE IPO Price Band and Dates: What Is Still Unknown?

    A draft prospectus is exactly that. The price band, the rupee size of the offer, the bid opening and closing dates, the minimum lot and any employee discount all appear as blanks in this document.

    Those numbers are filled in only at the red herring prospectus stage, after SEBI issues its observations on the draft. Until then, no NSE IPO offer size or valuation can be quoted from this filing.

    Anyone planning to bid when the offer opens will need a demat account to hold the allotted shares, and can track the price band announcement and listing through an online trading platform once the dates are notified.

    Investments in securities markets are subject to market risks. This article is for information purposes only and is not investment advice.

  • NSE IPO 2026: Price Band, Dates, GMP and Full Review

    NSE IPO 2026: Price Band, Dates, GMP and Full Review

    The National Stock Exchange of India Limited (NSE), the country’s largest stock exchange, is finally coming to market after a nearly decade-long wait. The IPO opens for subscription on 17 September 2026 and closes on 21 September 2026, with a price band of ₹1,700 to ₹1,785 per share. Shares are expected to list on the BSE on 24 September 2026.

    This is an entirely Offer for Sale (OFS) existing shareholders are selling part of their stake, and NSE itself will not receive any money from the issue.

    NSE IPO: Key Details at a Glance

    DetailInformation
    Issue typeOffer for Sale (OFS) only, no fresh issue
    Price band₹1,700 – ₹1,785 per share
    Lot size8 shares
    Minimum retail investment₹14,280 (at upper band)
    OFS sizeUp to 12.64 crore equity shares (12,64,36,650)
    Issue sizeApprox. ₹22,569 crore at the upper band
    Anchor bidding16 September 2026
    Subscription opens17 September 2026
    Subscription closes21 September 2026
    Allotment date22 September 2026 (tentative)
    Listing date24 September 2026, BSE only
    RegistrarMUFG Intime India Pvt Ltd
    Lead managerKotak Mahindra Capital Company (with a large syndicate of BRLMs)

    Face value of each share is ₹1. At the top end of the price band, NSE’s market capitalisation works out to roughly ₹4.42 lakh crore. At ₹22,569 crore, this is set to be India’s second-largest IPO ever, behind only Hyundai Motor India’s ₹27,870 crore issue in 2024.

    Why This IPO Matters

    NSE first filed papers for an IPO back in December 2016. The listing was shelved after the co-location controversy allegations that certain brokers got preferential, faster access to NSE’s algorithmic trading servers between 2015 and 2016 pulled the exchange into a long-running SEBI investigation and, later, Supreme Court litigation. Nearly a decade on, SEBI issued a no-objection certificate (NOC) to NSE in early 2026, allowing the exchange to file a fresh Draft Red Herring Prospectus (DRHP) which it did on 17-18 June 2026. SEBI’s observation letter (effectively, its go-ahead) followed on 4 September 2026. One condition attached to the NOC: NSE must complete its listing before 30 January 2027, or seek a fresh approval. Also Read: What is an IPO?

    Who Is Selling, and How Much

    Because this is a pure OFS, the shares are coming from existing shareholders rather than the company. The DRHP originally proposed selling up to 14.89 crore shares; that was trimmed to about 12.64 crore shares as some shareholders chose to hold on, betting on a higher price after listing rather than through the OFS. Selling shareholders include:
    • State Bank of India (around 1.60 crore shares, cut down from an earlier 2.47 crore)
    • Canada Pension Plan Investment Board (CPPIB)
    • Aranda Investments (Mauritius) Pte Ltd
    • MS Strategic (Mauritius)
    • Bank of Baroda
    • Stock Holding Corporation of India
    • General Insurance Corporation of India, New India Assurance, National Insurance Company, and United India Insurance Company
    The offer is reserved 50% for Qualified Institutional Buyers (QIBs), 35% for retail investors, and 15% for Non-Institutional Investors (NIIs).

    NSE IPO GMP Today

    As of midday on 11 September 2026, NSE shares were trading in the grey market at a premium of roughly ₹187–₹200 over the upper price band about 10–11% with slightly different trackers reporting slightly different numbers within that range at the same hour. A word of caution: GMP is an unofficial, unregulated number that can and does swing sharply within a single day, especially for an issue this large and widely tracked. It is not a reliable predictor of listing-day performance and should never be read as a guaranteed return. Treat it as one data point among many, not a forecast. Also Read: What is Grey Market in IPO?

    NSE’s Financial Performance

    NSE’s numbers over the last three financial years (consolidated):
    Particulars (₹ crore) FY 2023-24 FY 2024-25 FY 2025-26 Q1 FY 2026-27 (Apr–Jun 2026)
    Total income 16,352.06 19,176.83 18,713.37 5,252.17
    Profit after tax 8,305.74 12,187.69 10,302.06 3,120.08
    Net worth (year-end) 23,833.10 30,165.05 31,869.72 34,983.74 (as of 30 Jun 2026)
    FY 2025-26 profit came in lower than FY 2024-25 mainly because NSE set aside a one-off provision of about ₹1,297 crore (including interest) toward its proposed settlement with SEBI over the co-location and dark fibre matter not because the core business slowed. On scale, NSE reported roughly 93% market share in the cash market, 99.8% in equity futures, and 77% in equity options for H1 FY 2025-26. It facilitated total fund mobilisation of about ₹20.33 lakh crore in FY 2025-26 and ranks among the top five global exchange groups by capital raised through IPOs. Working out a simple trailing P/E from the FY 2025-26 PAT and the ₹4.42 lakh crore market cap at the upper price band gives a multiple of roughly 43x worth keeping in mind alongside its listed domestic peer, BSE, and global exchanges such as the NYSE, Nasdaq, and the Japan Exchange Group when judging whether the pricing looks rich or reasonable.

    Key Risks to Know Before Applying

    • The co-location case isn’t fully closed. NSE has proposed a ₹1,388 crore settlement with SEBI, and provisioned for it, but the matter is still tied to litigation before the Supreme Court. A less favourable outcome than expected remains a possibility.
    • Revenue depends heavily on trading volumes. Transaction charges are NSE’s single largest revenue line. A prolonged market slowdown, or further SEBI changes to F&O trading rules, would hit income directly.
    • A few subsidiaries are loss-making and may need continued financial support; for instance, NSE IFSC Limited and NAL Academy Limited have both posted losses in recent years.
    • This is a pure OFS. None of the IPO proceeds go into NSE’s own business; they go entirely to the selling shareholders.
    • The listing has a regulatory deadline. Per the terms of its NOC, NSE needs to complete the listing before 30 January 2027.

    How to Apply for the NSE IPO

    You’ll need an active demat account. Once the issue opens on 17 September 2026:
    1. Log in to your broker’s app or your bank’s net banking portal.
    2. Go to the IPO section and select NSE.
    3. Choose your price within the ₹1,700–₹1,785 band and the number of lots (minimum 1 lot = 8 shares).
    4. Apply via UPI (enter your UPI ID and approve the mandate on your UPI app) or via ASBA through net banking.
    5. Funds are blocked in your account until allotment; unallotted amounts are released automatically.
    Note that regular charges brokerage, STT, GST, and stamp duty apply once shares start trading after listing, though not on the IPO application itself. Read Also
  • Axiom Gas Engineering IPO Review: Price, Dates, Lot Size & Financials

    Axiom Gas Engineering IPO Review: Price, Dates, Lot Size & Financials

    Axiom Gas Engineering Limited, an Auto LPG distribution company operating under the ‘PRIMEFUEL’ brand, is launching its IPO with a fresh issue worth ₹49.81 crore at a price band of ₹50 to ₹53 per share. The issue opens on September 18, 2026, closes on September 22, 2026, and is expected to list on the NSE SME platform on September 25, 2026. Here is a closer look at the issue details, the company’s business, and its financial track record to help investors understand the offering before applying.

    Axiom Gas Engineering IPO: Key Details

    Parameter Details
    IPO Dates September 18–22, 2026
    Face Value ₹5 per share
    Price Band ₹50 to ₹53 per share
    Lot Size 2,000 shares (minimum application approx. ₹2,12,000)
    Issue Type Fresh issue only (no offer for sale)
    Issue Size ₹49.81 crore
    Listing Exchange NSE SME
    Allotment Date September 23, 2026
    Listing Date September 25, 2026 (tentative)
    Registrar KFin Technologies Limited
    Lead Manager SKI Capital Services Limited


    Details are current as of September 10, 2026. Lot size and reservation figures can vary slightly across sources, so it is worth confirming the final terms in the RHP or on Findoc’s live IPO snapshot page before applying.

    About Axiom Gas Engineering Limited

    Incorporated in 2007 and headquartered in Vadodara, Gujarat, Axiom Gas Engineering Limited works in Auto LPG (Liquefied Petroleum Gas) distribution and retailing under its ‘PRIMEFUEL’ brand. The company follows an integrated approach that covers procurement, storage, and retail dispensing of Auto LPG.

    • Runs more than 20 Auto LPG Dispensing Stations (ALDS) across Telangana, Karnataka, and Maharashtra

    • Focuses entirely on the Auto LPG segment, an alternative automotive fuel category

    • Is led by promoters with close to two and a half decades of combined experience in the oil and gas industry

    • Operates as an integrated player, handling everything from sourcing and bulk storage to last-mile retail dispensing

    The company’s growth strategy revolves around expanding its retail fuel network regionally rather than branching into unrelated business lines.

    Financial Performance (FY24–FY26)

    According to figures disclosed in the RHP, Axiom Gas Engineering has recorded steady growth in both revenue and profitability over the reported financial years.

    Metric FY26 FY25
    Revenue ₹100.78 crore ₹89.85 crore
    Profit After Tax (PAT) ₹9.45 crore ₹7.75 crore
    EBITDA ₹15.48 crore —
    Net Worth ₹33.28 crore —
    Debt-to-Equity Ratio 0.48 —
                PAT margin =
    PAT
    Total income
    × 100

    For FY26, this comes to roughly 9.38 percent based on the disclosed figures. These numbers reflect historical financial disclosures only and should not be read as an indication of future performance.

    Valuation Metrics Explained

    Valuation ratios help investors understand how an IPO is priced relative to a company’s earnings and net worth. Based on post-issue disclosures, here are Axiom Gas Engineering’s key ratios.

    Ratio Value
    EPS (Post-issue) ₹2.67
    P/E Ratio (Post-issue) ~19.85x
    Return on Net Worth (RoNW) 28.40%
    Net Asset Value (NAV) ₹12.83
    • EPS (Earnings Per Share) = Net Profit ÷ Weighted Average Shares Outstanding

    • P/E Ratio = Share Price ÷ EPS

    • RoNW = Net Profit ÷ Net Worth × 100

    These ratios are standard tools used to evaluate a company’s earnings efficiency. They are shared here purely for educational understanding, not as investment guidance.

    Objects of the Issue

    The company plans to use the net proceeds from the fresh issue as follows:

    • Capital expenditure: approximately ₹27.60 crore

    • Repayment or prepayment of borrowings: approximately ₹9.12 crore

    • General corporate purposes

    Strengths and Risk Factors

    Evaluating an IPO fairly means looking at both its stated strengths and the risks disclosed in the RHP.

    Strengths Risk Factors
    Established PRIMEFUEL retail network across three states Revenue depends entirely on the Auto LPG segment, with no fuel diversification
    Promoter team with long-standing experience in the oil and gas industry High supplier concentration, with a few suppliers accounting for a large share of procurement
    Improving debt-to-equity ratio of 0.48 SME platform listing, which typically comes with lower liquidity than the main board
    Regional demand alignment in southern Indian markets Sensitivity to price differentials between LPG and conventional automotive fuels
    Investors may find it useful to go through the complete risk factors section in the company’s Red Herring Prospectus before making any investment decision.

    How to Apply for Axiom Gas Engineering IPO via Findoc

    1. Log in to your Findoc trading and demat account.

    2. Go to the IPO section on the Findoc platform or app.

    3. Select “Axiom Gas Engineering IPO” from the list of active issues.

    4. Enter your UPI ID, the desired quantity (in multiples of the lot size), and a bid price within the ₹50–₹53 band.

    5. Approve the UPI mandate request in your linked banking app to complete the application.

    Those who don’t yet have a Findoc account can complete demat account signup before the issue closes.

    Key Takeaways

    • Axiom Gas Engineering IPO is a ₹49.81 crore fresh-issue offering priced between ₹50 and ₹53 per share.

    • The issue opens on September 18, 2026, and is expected to list on NSE SME on September 25, 2026.

    • The company distributes Auto LPG under the ‘PRIMEFUEL’ brand across three states.

    • FY26 disclosed financials show revenue of ₹100.78 crore and PAT of ₹9.45 crore.

    • Single-fuel dependence and SME-platform liquidity are among the disclosed risk factors.

  • Horizon Industrial Parks IPO Day 2: Issue Subscribed 16% so Far

    Horizon Industrial Parks IPO Day 2: Issue Subscribed 16% so Far

    Horizon Industrial Parks IPO entered its second day of bidding on Tuesday, 18 August, after a muted response on the first day. The ₹2,600 crore public issue was subscribed over 16% as of 10:35 am. The issue will remain open for bidding until Wednesday, 19 August 2026. The company has offered the IPO as a fresh issue, consisting of 43.34 crore shares.

    Subscription Status Across Investor Categories

    Retail Individual Investors were the most active group in the bidding so far. Their portion was subscribed at 27% of the 4.55 crore shares reserved for the category. Qualified Institutional Buyers also showed interest, with their portion subscribed at 18%. Non-Institutional Investors were slower to participate, with only 4% subscription recorded in their reserved portion.

    Investor Category Subscription Level
    Retail Individual Investors (RII) 27%
    Qualified Institutional Buyers (QIB) 18%
    Non-Institutional Investors (NII) 4%
    Overall Subscription 16%

    Grey Market Premium

    According to Investorgain, Horizon Industrial Parks shares were commanding a grey market premium of ₹1.7 on Tuesday. Based on that premium, the issue was indicating an estimated 2.83% listing gain over the upper end of the price band. The IPO price band has been fixed at ₹57 to ₹60 per share.

    Brokerage Views on Occupancy and Debt Reduction

    Swastika Investmart assigned a ‘subscribe’ tag to the issue. The brokerage noted that the company had committed operational occupancy of 93.56% across 118 enterprise tenants, and 54.05% of leased space was held by Fortune 500 companies. It further stated that the company reported an EBITDA margin of approximately 79.16% in FY26 and described the IPO as a structural asset play. The brokerage also noted that the fresh capital raise is linked to debt reduction. Investors looking to evaluate this IPO may also consider the importance of using a reliable trading platform to track live subscription data and grey market signals.

    Company Background and Portfolio

    Horizon Industrial Parks is backed by Blackstone Group and is described as India’s largest industrial and logistics infrastructure developer, owner and operator by total network, according to a JLL report. As of the DRHP date, the company had 45 logistics and industrial assets across 10 key cities in India, with a combined area of 58.01 million square feet.

    The company focuses on developing and leasing warehouses and industrial facilities. Its portfolio includes fulfilment centres, industrial facilities, and in-city centres used for dark stores, pharmaceuticals, cloud kitchens, retail, and other services.

    For those considering participation in Horizon Industrial Parks IPO as part of a broader stock investment strategy, understanding the company’s asset base, occupancy metrics, and debt profile may be relevant factors to assess before applying.

    Key IPO Details at a Glance

    • Issue Size: ₹2,600 crore (fresh issue)
    • Total Shares on Offer: 43.34 crore shares
    • Price Band: ₹57 to ₹60 per share
    • Minimum Lot Size: 250 shares
    • IPO Close Date: Wednesday, 19 August 2026
    • Expected Allotment Date: 20 August 2026
    • Grey Market Premium (as of 18 August): ₹1.7
    • Indicative Listing Gain (based on GMP): 2.83%

    Investors who wish to participate in upcoming public issues are advised to open demat account in advance to ensure readiness before the allotment and listing process begins.

    Summary: Horizon Industrial Parks IPO was subscribed 16% on Day 2, with retail investors leading at 27%. GMP stands at ₹1.7, indicating a modest 2.83% estimated listing gain over the ₹60 price band.

    Trending Stocks
    TVS Motor Company Share Price Bajaj Auto Share Price
    Polycab India Share Price JSW Steel Share Price
    Bharat Heavy Elect. Share Price Nestle India Share Price
    Infosys Share Price Adani Enterprises Share Price
    ONGC Share Price Titan Company Share Price
  • PNGS Reva Diamond Jewelry IPO 2026: Issue Details, Price Band, GMP & Review

    PNGS Reva Diamond Jewelry IPO 2026: Issue Details, Price Band, GMP & Review

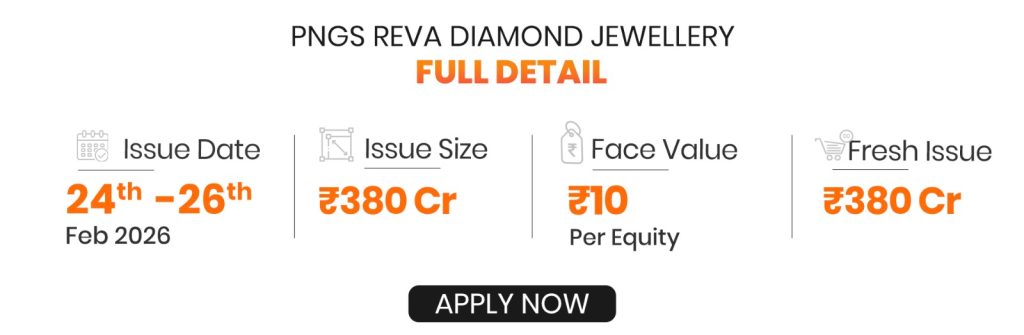
    PNGS Reva Diamond IPO price has caught most investors’ attention as the company wants to raise ₹380 crore through a fresh issue. The funds will support expansion plans and marketing initiatives. This affordable diamond jewelry brand, backed by the P.N. Gadgil & Sons, has shown remarkable performance. The company boasts a PAT margin of 30.84% and an exceptional ROE of 78.89%.

    Investors should know several key details about the PNGS Reva Diamond IPO. The IPO subscription starts on February 24 and ends on February 26. The allotment finalization will happen on February 27, followed by listing on March 3. While not comparable to a Revain IPO in Nasdaq, this RNG IPO price presents a good chance in India’s jewelry market.

    PNGS Reva’s smart market strategy offers pure diamond pieces starting at just ₹10,000, making luxury available to more customers. The company’s plans include launching its Reva collection before Valentine’s Day in 2025 to tap into festive sales. The gray market premium (GMP) will be a significant indicator for investors. A positive GMP hints at potential listing gains, while a negative one could mean listing at a discount.

    Investors tracking post-listing performance can monitor the PNGS Reva Diamond Share Price for real-time updates and valuation movement after listing.

    What makes PNGS Reva Diamond IPO stand out in 2026? The PNGS Reva Diamond IPO stands out in the busy 2026 market with its unique strategic position and strong brand heritage. The diamond-focused brand launched in February 2025 shows a calculated entry into India’s growing affordable luxury jewelry segment.

    Affordable luxury positioning makes Reva’s market strategy distinctive. You can buy pure diamond pieces starting at just ₹10,000, which opens doors for first-time diamond buyers and positions the brand strongly within India’s evolving premium jewelry segment.

    Also Read: What is IPO?

    What Makes PNGS Reva Diamond IPO Stand Out in 2026?

    The PNGS Reva Diamond IPO stands out in the busy 2026 market with its unique strategic position and strong brand heritage. The diamond-focused brand launched in February 2025 shows a calculated entry into India’s growing affordable luxury jewelry segment.

    Investors who wish to participate in this public issue during the subscription window can review the offer details and proceed with their application below.

    Affordable Luxury Positioning

    Reva’s market strategy makes diamond jewelry available to more customers through smart pricing. You can buy pure diamond pieces starting at just ₹10,000, which opens doors for first-time diamond buyers. This pricing lets Reva reach customers who thought diamond jewelry was too expensive.

    The brand smartly markets itself as “affordable luxury” instead of just “affordable jewelry” to keep its premium image despite lower prices. Their products cover various categories like diamond rings, earrings, bracelets, sets, and necklace sets. The brand also lets customers customize pieces to match their style priorities.

    The timing of marketing campaigns has been vital to Reva’s position. The brand launched its collection right before Valentine’s Day 2025 to boost gift purchases. They offered zero making charges during the launch to attract new customers. These seasonal offers show how well Reva understands when people buy jewelry.

    This smart pricing and promotion strategy helps Reva target customers who want branded jewelry without high prices. A gross profit margin of 26.67% shows this affordable luxury approach works financially.

    Backed by Trusted Brand P.N. Gadgil & Sons

    The most important advantage for the PNGS Reva Diamond IPO is its connection to P.N. Gadgil & Sons, a jewelry institution trusted by customers for over 190 years. This rich heritage gives Reva instant credibility in a market where trust drives purchases.

    P.N. Gadgil & Sons transferred its diamond business to PNGS Reva Diamond Jewelry through a strategic slump sale in January 2025. This move lets Reva work independently while using its parent company’s brand value and strong operations. The P.N. Gadgil & Sons connection helps build customer loyalty, improve supply chains, and grow faster.

    This partnership goes beyond branding into retail presence. PNGS Reva Diamond Jewelry runs 34 stores in Maharashtra, Karnataka, and Gujarat. All but one of these stores operate inside existing P.N. Gadgil & Sons locations. This setup gives Reva retail presence without spending heavily on new stores.

    The company uses multiple operational models:

    • Company Owned Company Operated (COCO)
    • Franchise Owned Company Operated (FOCO)
    • Franchise Owned Franchise Operated (FOFO)

    This flexible approach helps quick expansion while you retain control over the brand. The company knows how to operate in cities of all sizes in its main markets, which builds efficiency and community trust.

    The PNGS Reva Diamond IPO offers more than just another jewelry market investment. Investors get a chance to back a brand with smart pricing and support from a 190-year jewelry legacy, something rare in today’s Indian retail world.

    Read in Details: How to Meet the IPO Eligibility Criteria?

    How does the Reva Brand Plan to Disrupt the Diamond Market?

    PNGS Reva Diamond Jewelry has created a fresh approach to challenge India’s traditional diamond market. The brand launched in February 2025 to capture market share by solving the biggest problems and meeting needs in the premium jewelry segment.

    Modern Designs at ₹10,000+ Price Points

    Reva has positioned itself in the affordable luxury segment by offering pure diamond jewelry starting at just ₹10,000. This pricing makes diamond jewelry accessible to more people who thought diamonds were out of their reach.

    The company showcases a wide collection with contemporary designs that appeal to urban and millennial consumers. Their products include:

    • Rings and earrings
    • Necklaces and pendants
    • Solitaires
    • Bangles and bracelets
    • Mangalsutra and nose rings
    • Chains

    The brand has created 13 unique jewelry collections as of September 2025. In-house design teams work with carefully selected third-party manufacturers and artisans to develop these collections. Each piece blends tradition with modern elements while staying elegant and authentic.

    Zero Making Charges and Festive Targeting

    Reva made a bold move by introducing zero making charges during its launch. This strategy tackles one of the major costs in traditional jewelry pricing that adds substantial markup to final prices and often confuses buyers.

    The brand’s launch just before Valentine’s Day 2025 came with waived making charges until February 16, 2025. This smart timing shows Reva understands how gift-buying occasions bring new customers to diamond jewelry.

    The company’s marketing goes beyond Valentine’s Day to target wedding seasons and festivals when jewelry sales peak in India. This seasonal approach helps build brand awareness during high-interest periods.

    These promotions help first-time diamond buyers overcome their hesitation by reducing both cost and psychological barriers. Customers can also customize pieces across collections to match their priorities.

    Tier-1 and Tier-2 City Expansion

    The company will use ₹286.56 crore from IPO proceeds to open 15 new brand-exclusive stores. This growth plan targets Tier-1 cities while learning about opportunities in Tier-2 locations across Maharashtra and other metro cities in India.

    Early 2026 data shows PNGS Reva Diamond Jewelry runs 34 stores across Maharashtra, Karnataka, and Gujarat. All but one of these stores are shop-in-shop formats within P.N. Gadgil & Sons retail stores. The exception operates under the Company Owned Company Operated (COCO) model.

    The company’s knowledge of Tier-1, Tier-2, and Tier-3 cities helps improve operational efficiency. This focused presence allows better logistics, inventory management, and store operations. The expansion strategy utilizes this regional expertise while entering new promising markets.

    The company plans to spend ₹35.40 crore from IPO proceeds on marketing for these new stores. This investment will improve local brand awareness and help Reva connect with communities as it grows.

    Reva combines asset-light shop-in-shop models (FOCO/FOFO) with strategic standalone stores to grow faster while maintaining consistent brand experience. This balanced growth strategy helps the company benefit from India’s jewelry retail consolidation trends.

    Why is the ₹380 Cr IPO being Launched Now?

    PNGS Reva Diamond’s ₹380 crore IPO comes at a perfect time in India’s jewelry market. The public offering starts February 24 and runs through February 26, 2026. This move aims to raise capital with clear goals in mind.

    Timing with Wedding and Festive Season

    The company picked the perfect moment for its IPO during India’s peak jewelry buying season. PNGS Reva launched its diamond collection right before Valentine’s Day 2025. This smart move built brand awareness before going public. Their timing shows they understand when people buy gifts.

    Their H1 FY26 revenue hit ₹157 crore thanks to strong festive and wedding season sales. These numbers prove the brand knows how to tap into seasonal buying spikes across India.

    PNGS Reva’s IPO fits perfectly with their business plan of targeting special occasions. They launched their collection before Valentine’s Day and offered zero making charges. This strategy shows they know when customers are most likely to buy. The IPO follows this same smart thinking – launch when market interest peaks.

    The anchor book opens February 23, letting big investors get in just as retail interest builds. This timing helps grab attention when jewelry sales typically surge.

    Capitalizing on Premiumisation Trend in Jewelry

    The ₹380 crore from this IPO will go toward riding the premium wave in India’s jewelry market:

    • ₹286.56 crore (75.4%) to open 15 brand-exclusive stores
    • ₹35.40 crore (9.3%) for marketing campaigns
    • The rest for general business needs

    This split shows PNGS Reva sees how customer priorities are changing. The jewelry market keeps growing as pieces become everyday wear rather than special occasion items. Simple chains, rings, and bracelets are now daily fashion must-haves that create year-round sales.

    The best reason for this IPO’s timing links to market growth factors. Higher incomes, city growth, and more spending have created the perfect setting for premium jewelry brands. The organized diamond jewelry market looks set to grow 16-17% yearly.

    Diamond jewelry offers the best growth potential in the premium segment. PNGS Reva sells pure diamond pieces starting at ₹10,000 with modern designs. This puts them in a great spot to benefit from market changes.

    The IPO structure tells us more about their funding approach: 75% for qualified institutional buyers, 15% for non-institutional investors, and 10% for retail investors. This setup focuses on getting long-term institutional money to support their growth plans.

    Their expansion targets Tier-1 cities first, while carefully picking Tier-2 spots in Maharashtra and other metro areas across India. These locations match areas where premium jewelry sales are growing fastest.

    PNGS Reva’s IPO combines short-term seasonal opportunities with long-term market trends. By raising money now, they can capture both festival sales and the bigger shift toward premium jewelry in India.

    Read Also: Things You Should Know Before Investing in IPO

    How Strong is PNGS Reva’s Financial Foundation?

    Financial performance drives any IPO investment case. PNGS Reva’s numbers tell a compelling story of strategic growth and operational efficiency that supports the PNGS Reva Diamond IPO price.

    Revenue and PAT Growth over 3 Years

    PNGS Reva Diamond Jewelry’s financial journey shows steady progress over recent fiscal periods. The company started as an offshoot of the P.N. Gadgil & Sons brand and showed remarkable financial progress after focusing solely on diamond jewelry.

    Revenue reached ₹157 crore in H1 FY26, which shows strong growth momentum before its public offering. These numbers stand out, especially given the economic climate affecting consumer spending.

    The company’s operational efficiency shines through its Profit After Tax (PAT) figures, with a 30.84% PAT margin – an exceptional number in retail jewelry. This profitability puts PNGS Reva ahead of its peers and gives investors confidence in its business model.

    Strong revenue growth matches the company’s push into new markets and its focus on affordable luxury. Unlike typical png ipo reviews, PNGS Reva’s story centers on making profit while keeping prices available to customers.

    Net Worth Turnaround Post Slump Sale

    January 2025 marked a turning point in PNGS Reva’s progress when P.N. Gadgil & Sons sold its diamond business to PNGS Reva Diamond Jewelry through a strategic slump sale. This move reshaped the company’s balance sheet and business focus.

    The sale let PNGS Reva run independently while keeping its parent company’s brand value and infrastructure. This showed up as a big boost in the company’s net worth, creating a stronger base for future growth.

    Smart timing of this deal just before the Valentine’s Day 2025 collection launch helped PNGS Reva tap into seasonal sales with better financial structure. Investors comparing this to a Revain IPO in nasdaq should note that PNGS Reva’s financial moves target the Indian jewelry market rather than tech sector.

    After restructuring, the company’s capital efficiency improved significantly. Return on Net Worth (RoNW) hit 78.89%, showing how well the company uses shareholder money to generate returns.

    EBITDA and Margin Trends

    PNGS Reva’s EBITDA numbers prove its operational strength. A 26.67% gross profit margin shows healthy product-level profits while maintaining affordable luxury status.

    The margin structure reveals several advantages:

    • Shop-in-shop model cuts overhead costs (33 of 34 stores)
    • Smart inventory management in focused areas
    • Targeted seasonal marketing keeps costs down
    • Working efficiently with parent company P.N. Gadgil & Sons

    These advantages help maintain margins despite price competition in diamond jewelry. The rng ipo price depends on many factors, but EBITDA trends point to a business model that stays profitable in different market conditions.

    The company plans to use ₹286.56 crore from IPO funds to open 15 brand-exclusive stores, aiming to boost margins through bigger retail presence and brand control. Another ₹35.40 crore will go to marketing, balancing growth with profit protection.

    PNGS Reva’s financial foundation rests on strong fundamentals – high profitability, smart capital use, and healthy margins. IPO investors can clearly see how operational performance backs the company’s value and growth plans.

    What do Valuation Metrics Reveal about Investment Potential?

    Understanding valuation metrics gives us vital insights into the PNGS Reva diamond IPO price and its investment potential. A detailed analysis of key financial ratios shows how the company matches up against other players in the Indian jewelry market.

    RoNW and EPS vs Peers

    PNGS Reva Diamond Jewelry’s valuation analysis shows remarkable efficiency metrics compared to industry peers. The company has an impressive Return on Net Worth (RoNW) of 59.36%, which is nowhere near what its competitors achieve. This exceptional capital efficiency is way ahead of Thangamayil Jewelry (24.99%), Tribhovandas Bhimji Zaveri (9.05%), and Senco Gold (13.26%).

    Earnings Per Share (EPS) is a vital indicator of profitability. PNGS Reva has a Basic and Diluted EPS of ₹35.21, making it second only to Thangamayil’s ₹44.91 among its peers. This metric alone doesn’t paint the complete picture without looking at corresponding valuation multiples.

    The company shows superior operational efficiency with Return on Equity (ROE) at 59.4% and Return on Capital Employed (ROCE) at 80.5%. These numbers prove its better asset utilization and operational effectiveness compared to industry standards.

    We can’t make direct valuation comparisons since PNGS Reva doesn’t have a defined Price-to-Earnings (P/E) ratio yet. All the same, peer P/E ratios—Senco Gold (14.48×), TBZ (23.58×), and Thangamayil (41.24×)—help establish a potential valuation framework.

    NAV and Debt-equity Ratio

    Net Asset Value (NAV) gives us fundamental insight into book value per share. Different sources show conflicting data. One reliable source states PNGS Reva’s NAV at ₹45.82 per share, while another shows ₹206.19. The ₹45.82 figure seems more accurate based on source reliability.

    Peer companies have much higher NAVs: Thangamayil (₹179.74), Senco Gold (₹175.74), and TBZ (₹90.14). PNGS Reva’s lower NAV could mean either growth potential or overvaluation, depending on future performance.

    The company has a healthy debt-equity ratio of 0.37, which shows financial prudence and a strong balance sheet. This conservative leverage position means there’s room to expand without too much financial burden. A PAT margin of 23.04% and EBITDA margin of 41.81% further prove its operational strength.

    Comparison with Senco Gold, TBZ, Thangamayil

    A detailed peer analysis reveals PNGS Reva’s competitive position:

    This comparison clarifies several investment points. PNGS Reva gets better returns on invested capital, as shown by its industry-leading RoNW. Its revenue base is much smaller than other players, which suggests significant room to grow if execution works out.

    The company’s financial profile stands out from typical jewelry retailers. Thangamayil has slightly higher EPS but needs nearly 15× PNGS Reva’s revenue to achieve it. This efficiency shows PNGS Reva’s streamlined business model and capital-light approach.

    The PNG IPO review through valuation metrics shows a company with exceptional profitability ratios but relatively small scale. Investors might see substantial returns if the company executes its expansion strategy well, quite different from a Revain IPO in Nasdaq that focuses more on technology metrics than financial efficiency.

    What are the Risks Investors should Consider?

    Investors looking at the PNGS Reva Diamond IPO price should carefully consider several key risks that could affect its future performance. The attractive valuations tell only part of the story – there are important challenges that need a closer look.

    Execution Risk in Store Rollout

    The life-blood of PNGS Reva’s growth strategy lies in setting up 15 brand-exclusive stores to boost its market position and revenue. This ambitious expansion comes with substantial risks. The company might face higher costs and delays as it enters the highly competitive retail jewelry sector. PNGS Reva, just a few months old (since December 2024), still needs to build its brand identity and depends heavily on its parent promoter group’s systems and operations.

    The company’s current scale remains small with revenue of about ₹258 crore compared to older players in the industry. Sales and brand relevance could take a hit if new designs don’t line up with changing customer priorities. Poor inventory management or supply delays could lead to either empty shelves or excess stock, which would hurt operational efficiency.

    Geographic Concentration in Maharashtra

    The biggest problem in the PNG IPO analysis comes from PNGS Reva’s heavy focus on one region. Maharashtra accounts for 97% of FY25 revenue, making the company vulnerable to regional disruptions. Even more worrying, just five stores generate 44% of total revenue.

    The company runs stores in Maharashtra, Gujarat, and Karnataka, but this limited presence leaves it exposed to local economic downturns. Plans to expand mainly in Maharashtra will likely increase this concentration. Unlike a Revain IPO on NASDAQ that could reach global markets, PNGS Reva’s geographic limits might restrict its growth potential.

    Volatility in Gold/Diamond Prices

    The RNG IPO price faces substantial commodity risks. Raw materials make up 65-70% of total costs, so profits are nowhere near stable when gold and diamond prices fluctuate. The typically thin margins in jewelry retail make this worse.

    Lab-grown diamonds are becoming popular and could threaten natural diamond demand, which might affect pricing, margins, and long-term growth. The industry also faces stricter rules like hallmarking and traceability requirements, adding pressure in a market where 58% remains unorganized.

    Seasonal sales patterns add another risk factor. Any drop in sales during key festive or wedding seasons could substantially impact yearly financial results.

    What is the Latest GMP and Market Sentiment?

    Market participants are keeping a close eye on PNGS Reva Diamond Jewelry IPO’s Gray Market Premium (GMP) before its subscription period. The IPO will open on February 24 and close on February 26, 2026. Unofficial trading circles have already shown interest ahead of the launch.

    Gray Market Premium (GMP) Trends

    Latest unofficial reports show PNGS Reva Diamond IPO GMP at around ₹10 per share. Early market participants seem optimistic about the listing potential, as shown by this positive premium. The GMP acts as an unofficial indicator of investor interest before official subscriptions start.

    The current premium shows gray market activity before the actual listing. Market demand and sentiment can make the GMP fluctuate a lot. These early figures might change by a lot as we get closer to the IPO dates.

    The PNGS reva diamond ipo price and GMP trends don’t guarantee listing performance. Final subscription numbers across investor categories will determine the actual listing gains.

    Subscription Status Updates

    Daily updates on PNGS Reva Diamond’s subscription status will start once bidding opens on February 24. The IPO has specific allocation quotas for different investor groups:

    • Qualified Institutional Buyers (QIB): Financial institutions, banks, FIIs, and mutual funds
    • Non-Institutional Investors (NII): Individual investors, NRIs, companies, and trusts
    • Retail Individual Investors (RII): Regular retail investors

    This mainboard IPO will list on both BSE and NSE, unlike a Revain IPO in Nasdaq. Investors can track up-to-the-minute bidding information through designated platforms once subscription begins.

    The IPO allotment will be finalized on Friday, February 27, 2026. Investors should receive their credited shares by March 2, 2026. The company plans to list on Wednesday, March 4, 2026.

    Retail and HNI Interest Levels

    Subscription numbers will reveal interest levels across investor categories. Png ipo reviews suggest investors should look at QIB, NII, and retail subscription numbers before making their decision.

    The rng ipo price tends to relate to institutional interest during the subscription period. Subscription trends often show dramatic improvements on the final day compared to the original responses.

    GMP tracking and subscription status help predict potential listing performance. Financial experts suggest looking at this IPO as a long-term investment rather than focusing only on listing gains.

    How can Investors Apply and Track Allotment?

    PNGS Reva Diamond IPO welcomes prospective investors through multiple digital platforms. The subscription window starts February 24 and ends February 26, 2026. Investors must have an active demat account to apply, and those without one can open demat account online to participate in the IPO through these platforms.

    Application Process via UPI/ASBA

    Investors have two payment options – UPI or ASBA. Here’s how you can apply online:

    1. Access your broker account or bank’s net banking portal
    2. Find the IPO section and select PNGS Reva Diamond Jewelry
    3. Fill in your bid details and UPI ID
    4. Submit your application form
    5. Confirm the mandate request on your UPI app

    The bank ASBA facility remains available until 5 PM on February 26, 2026, and provides another application route.

    Lot Size and Retail Limits

    Official channels will soon announce the exact lot size details. Retail investors typically get to apply between one and 13 lots. Your total application amount depends on the final PNGS Reva Diamond IPO price multiplied by the chosen lot size.

    Allotment Date and Refund Process

    The IPO allotment results will be ready by February 27, 2026. Successful applicants will receive their shares in their demat accounts by March 2, while unsuccessful applicants will get their refunds processed the same day.

    You can check your IPO allotment status through these three options:

    • Bigshare Services (the registrar) website using your application details
    • BSE website with your application number or PAN
    • NSE website using your application number or PAN

    The refund process starts March 2, 2026, and shares will list on the exchange between March 3-4, 2026.

    Conclusion

    PNGS Reva Diamond Jewelry IPO gives investors a fresh way to enter the Indian jewelry market. The company stands out by offering affordable luxury with pure diamond pieces starting at just ₹10,000. Their numbers tell an impressive story – a PAT margin of 30.84% and ROE of 78.89% show how well they run their business.

    The brand draws strength from its 190-year connection with P.N. Gadgil & Sons, which gives it a clear edge in the market. PNGS Reva’s blend of trusted heritage and modern designs creates a bridge between old values and new styles. While their shop-in-shop model works well now, they want to open 15 brand-exclusive stores using IPO funds.

    Smart investors should think over some risk factors before jumping in. The biggest problem is geographic concentration – 97% of revenue comes from Maharashtra. The planned store expansion could face hurdles that might slow growth. Raw materials make up 65-70% of total costs, so changes in gold and diamond prices could affect profit margins.

    The market seems cautiously positive with a Gray Market Premium of about ₹10 per share. Investors will watch the allotment date of February 27, 2026, and listing on March 3-4 closely. Those who get shares will see them in their accounts by March 2.

    PNGS Reva Diamond Jewelry makes a strong but complex investment case. The company’s solid finances and market position point to good growth ahead. Yet wise investors will balance these chances against the risks. Anyone thinking of investing should assess their risk comfort and time horizon rather than just focusing on listing gains. This IPO shows how traditional jewelry businesses can adapt to changing customer priorities while staying profitable in a competitive market.

    Frequently Asked Questions

    PNGS Reva offers affordable luxury diamond jewelry starting at ₹10,000, backed by the 190-year legacy of P.N. Gadgil & Sons. Their strategic positioning and strong financial metrics, including a 30.84% PAT margin and 78.89% ROE, set them apart in the competitive jewelry market.

    The company plans to use ₹286.56 crore from the ₹380 crore IPO to establish 15 new brand-exclusive stores. Additionally, ₹35.40 crore will be allocated for marketing and promotional activities, with the remaining funds used for general corporate purposes.

    Major risks include execution challenges in the planned store rollout, high geographic concentration with 97% of revenue from Maharashtra, and potential volatility in gold and diamond prices affecting profit margins.

    Investors can apply through UPI or ASBA methods via their broker accounts or bank’s net banking portals. The subscription window is from February 24 to February 26, 2026, with a cutoff time of 5 PM on the closing date.

    The tentative listing date for PNGS Reva Diamond Jewelry shares is set for Wednesday, March 4, 2026, on both BSE and NSE. Allotment finalization is scheduled for February 27, with share credits expected by March 2, 2026.

    Disclaimer: This blog is intended solely for educational and informational purposes and should not be construed as investment advice or a recommendation. While efforts have been made to ensure the accuracy and reliability of the information and data presented, no representation or warranty, express or implied, is made regarding its completeness or correctness. Readers are advised to independently verify all information and consult a qualified financial advisor before making any investment decisions. Investments in the securities market are subject to market risks. Please read all relevant offer documents and disclosures carefully before investing.,

  • Fractal Analytics IPO: Latest GMP, Price Band & Should You Invest in 2026?

    Fractal Analytics IPO: Latest GMP, Price Band & Should You Invest in 2026?

    The gray market premium (gmpipo) for Fractal Analytics IPO shows strong investor interest as shares trade at a premium of ₹182 over the upper band price. This AI and analytics powerhouse plans to launch a major book-built IPO worth ₹2,833.90 crore. The offering includes fresh equity shares of ₹1,023.50 crore and an offer for sale of ₹1,810.40 crore.

    The Fractal Analytics IPO share price ranges between ₹857 and ₹900 per share[-2], making it one of India’s biggest tech offerings in 2026. The company’s client base includes more than 100 Fortune 500 companies from sectors of all types including BFSI, CPG, retail, healthcare, tech, and media. Fractal Analytics’ SEBI filings showcase remarkable financial growth, with PAT jumping by 503.29% from -₹54.70 crores in March 2024 to ₹220.60 crores in March 2025. Let’s take a closer look at the Fractal Analytics IPO India listing, its GMP trends, company fundamentals, and help you decide if this chance lines up with your portfolio goals.

    IPO Details and Timeline

    Fractal Analytics just announced its IPO schedule, marking one of the biggest tech offerings on the Indian stock market this February. Here are all the key details about this highly awaited public issue.

    Issue size and share breakdown

    The company’s IPO is a massive book-built issue worth ₹2,833.90 crore. It combines two parts – they will issue fresh shares worth ₹1,023.5 crore and sell existing shares (OFS) worth ₹1,810.4 crore. This setup helps the company raise money while letting current investors cash out their investments. The fresh issue will create 1.14 crore new equity shares, and the OFS will sell 2.01 crore existing shares. The company’s DRHP shows this balanced fundraising approach will strengthen their balance sheet and let early investors get returns on their money.

    Price band and lot size

    You can buy Fractal Analytics’ shares between ₹857 and ₹900 each, with each share’s face value at ₹1. This puts the company’s value at about ₹15,500 crore. Regular retail investors need to buy at least 1 lot of 16 shares, which means putting in ₹14,400 at the higher price. Small non-institutional investors must get at least 14 lots (224 shares), costing ₹2,01,600. Large non-institutional investors need 70 lots minimum (1,120 shares), which comes to ₹10,08,000.

    Subscription and allotment dates

    The subscription window starts Monday, February 9, 2026, and ends Wednesday, February 11, 2026.Eligible investors planning to participate during the issue window can Apply Now through the IPO platform. The company has laid out clear next steps:

    • Basis of Allotment Finalization: Thursday, February 12, 2026
    • Refund Initiation: Friday, February 13, 2026
    • Credit of Shares to Demat Accounts: Friday, February 13, 2026

    Investors will know their allotment status just one day after subscriptions close. The company will divide shares based on SEBI rules – retail investors get 10%, non-institutional investors get 15%, and qualified institutional buyers get 75%.

    Listing date and stock exchanges

    The SEBI-approved listing happens Monday, February 16, 2026. You’ll find the shares listed on both the Bombay Stock Exchange (BSE) and National Stock Exchange (NSE). The gray market shows strong investor interest, with shares trading at a 10% premium. This hints at possible gains on listing day for lucky applicants. Right now, the GMP is about ₹93 above the highest price, showing market confidence in this AI analytics company’s public debut.

    Gray Market Premium (GMP) Insights

    Investors are happy to track unofficial gray market prices for Fractal Analytics IPO as the listing date gets closer. Here’s what the latest gmpipo trends mean for potential investors.

    Current GMP and listing expectations

    The fractal analytics ipo gmp shows mixed readings across different market trackers as of February 6, 2026. Most reliable sources show the current GMP is around ₹93-99 per share. This points to an estimated listing price between ₹993 and ₹999, based on the upper price band of ₹900. Investors could see potential listing gains of 10.33-11%. All the same, some trackers share more conservative numbers. InvestorGain quotes a GMP of ₹57, which points to a lower estimated listing price of ₹957 with a 6.33% gain. The positive premium shows that markets expect this AI-focused company to list above par.

    GMP movement over recent days

    The fractal analytics ipo gmp has shown substantial changes in the days before its public offering:

    • February 3-4: GMP reached ₹180-182, pointing to a potential listing price of ₹1,082 with expected upside of nearly 20.22%
    • February 4: GMP peaked at ₹165 before it started falling
    • February 5: Premium dropped to around ₹90
    • February 6: More consolidation with most sources showing GMP between ₹57-99[121]

    The gray market premium has cooled down compared to the early excitement when the price band was first announced. The shares had a premium of up to 21% in the unregulated market. This shows the high original interest that has now settled.

    What GMP indicates about investor sentiment

    Gray market premium works as an unofficial gage of how investors feel about an upcoming public offering. The positive GMP for fractal analytics ipo india shows that investors think the stock will list higher than its issue price. Fractal Analytics is India’s first pure-play AI company to go public. The steady positive GMP reflects market excitement for AI-driven businesses in today’s investment scene.

    The premium has dropped from its peak but stays positive, which shows steady investor interest. This reflects their confidence in Fractal’s place in the global generative AI cycle and better profits. Swastika Investment Ltd gave it a ‘Subscribe’ rating. They believe the valuation premium makes sense given the company’s AI-focused business model.

    The fractal analytics ipo sebi filings point out that gray market data is unofficial and based on speculation rather than regulated market activity[113]. IPO experts warn that GMP can change quickly. Making investment choices based only on gray market premiums can be risky. Yes, it is true that “GMP is not regulated or recommended by stock exchanges or SEBI”.

    Company Fundamentals and Business Model

    Fractal Analytics, a 25-year old trailblazing force in the enterprise AI world, started its journey in 2000. The company’s gmpipo performance shows strong investor interest, backed by a sophisticated business model. Let’s get into what makes this AI powerhouse successful.

    AI and analytics services offered

    Fractal Analytics operates as a pure-play enterprise data, analytics, and artificial intelligence (DAAI) company. The market value stands at approximately ₹12 trillion in FY25 and should reach ₹23 trillion by FY30 at a CAGR of 16.7%. Large enterprises in any discipline benefit from the company’s complete end-to-end AI solutions that help with decision-making.

    Their service portfolio has:

    • Strategic decision acceleration
    • Customer experience optimization
    • Personalization accuracy boost
    • Supply chain optimization
    • Risk management solutions
    • Demand forecasting capabilities

    The company has built seven pillars of enterprise transformation: GenAI, Machine Learning Operations, Conversational AI, Computer Vision, Cognitive Automation, Responsible AI, and Quantum Computing. They invest heavily in state-of-the-art solutions, putting 5% of revenue into R&D activities. This investment led to 24 granted patents and 41 pending applications as of August 2025.Investors evaluating the business beyond GMP trends may review the detailed company profile on fractal-analytics-company to understand its operations, clients, and financial positioning.

    Client base and revenue concentration

    We focused on “Must Win Clients” (MWCs)—enterprises that generate over USINR 843.80 billion in annual revenue, exceed USINR 1,687.61 billion market capitalization, or serve more than 30 million end-customers. The company managed to keep relationships with 122 such clients by September 2025. Their impressive client list features Citibank, Costco, Mars, Mondelez, Nestlé, Philips, and Franklin Templeton.

    The Americas bring in two-thirds of Fractal’s revenue, with Europe and Asia-Pacific following behind. Foreign clients generate about 92% of total revenue. The company’s client relationships prove remarkably stable—its top 10 clients have stayed with Fractal for more than 8 years on average[143].

    The success brings concentration risk. The fractal analytics ipo drhp shows that the top 10 clients generated 54.2% of the company’s revenue in its  segment for H1FY26, with one client bringing in 8.2%. The consumer packaged goods and retail sector made up 37.5% of  segment revenue during this period.

    Financials and Valuation Snapshot

    The numbers behind Fractal Analytics’ IPO tell an exciting story about the company’s growth and profit potential. Let’s get into the figures that make investors eager about this AI-focused enterprise.

    Revenue and profit growth

    Fractal Analytics showed solid revenue growth from ₹1,985 crore in FY23 to ₹2,196 crore in FY24, and then surged to ₹2,765 crore in FY25. The numbers reveal a 26% year-over-year jump between FY24-25 and an 18% CAGR through FY23-25. Analytics services brought in most of the revenue (₹2,701 crore in FY25), while subscription revenue jumped 167% to ₹64 crore in FY25.

    The company’s profit story is even more impressive. Fractal turned around a ₹55 crore loss in FY24 into a ₹221 crore profit in FY25. This 503% turnaround shows how well the company improved its operations. The company managed to keep making profits in the first half of FY26 at ₹70.9 crore, though it dipped slightly by 2.7% from last year.

    EBITDA and PAT margins

    FY25 brought an EBITDA of ₹398 crore with a 14.13% margin, which substantially beat last year’s numbers. The profit-after-tax margin reached 8.0% in FY25, with an adjusted PAT margin of 12.6%. The return on net worth jumped to 12.6% for FY25 from -3.9% in FY24.

    Smart expense management helped improve these margins. Total expenses grew by just 14.4% to ₹2,575 crore in FY25, which was slower than revenue growth.

    Valuation multiples: P/E and P/B

    The upper band price of ₹900 puts Fractal Analytics at a post-FY25 P/E multiple of about 78.9x. This looks high next to traditional IT companies. Pre-IPO P/E sits at 65.5x with ₹13.74 EPS, while post-IPO calculations point to a P/E of 109.12x with ₹8.25 diluted EPS.

    The price-to-book value ratio stands at about 8.65x. This premium shows what investors will pay for Fractal’s AI expertise and growth potential.

    Comparison with industry peers

    Fractal Analytics’ valuation runs ahead of India’s traditional IT companies. TCS trades at a P/E of 22.17x, Infosys at 21.5x, and HCL Tech at 35.58x. This gap exists because Fractal stands out as a pure-play AI company in a market that has few listed AI firms.

    The premium price tag reflects investor faith that Fractal will grow faster than the IT industry’s 11% rate with its own 18% CAGR. The global AI software market’s 22.9% annual growth supports this outlook.

    Should You Invest in Fractal Analytics IPO?

    The Fractal Analytics IPO GMP shows investor enthusiasm, but making an investment decision needs a careful look at both rewards and risks.

    Strengths: market leadership, client base, innovation

    Fractal Analytics gives investors a way into the AI market, which will grow 18.9% each year through 2030. Being India’s first pure-play AI company to reach public markets, it commands a premium due to limited options that partly explains its valuation. The company serves over 100 Fortune 500 companies and boasts an impressive 121.3% Net Revenue Retention. Its top clients have stayed for more than 8 years on average. The company’s steady R&D investments have led to 24 patents and home-grown AI platforms like Cogentiq, which create strong competitive advantages.

    Risks: high OFS, client concentration, premium valuation

    The large Offer For Sale component (₹1,810.4 crore) means most money goes to existing shareholders instead of helping the company grow. The client concentration raises concerns as the top 10 clients bring in 54.2% of revenue, and one client alone contributes 8.2%. The valuation looks expensive at 78.9x post-FY25 P/E, much higher than what we see for TCS (22.17x) and Infosys (21.5x).

    SEBI and DRHP disclosures to consider

    The Fractal Analytics IPO DRHP points out key operational risks. Cybersecurity issues could hurt business operations and client relationships. Project delays and implementation problems might lead to higher costs or unhappy clients. The company also faces legal cases that involve its subsidiaries and two directors.

    Long-term potential vs short-term listing gains

    Fractal gives investors a chance to be part of the global AI growth story. Swastika Investmart believes the stock works best for “high-risk, growth-focused investors with a three-to-five-year investment horizon”. SBI Securities takes a more careful stance with a “Neutral” rating, citing “elevated valuation” compared to “modest growth metrics”. This IPO suits portfolios looking for focused AI exposure better than those seeking safe investments or quick listing gains.

    Conclusion

    Fractal Analytics’ IPO marks the most important milestone as India’s first pure-play AI company to enter the public markets. The substantial ₹2,833.90 crore offering, priced between ₹857 and ₹900 per share, has definitely caught investors’ eyes. The gray market premium has cooled from its original peak of over 20%. It still points to listing gains of 10-11%, which shows ongoing optimism about the company’s future.

    The company’s fundamentals look impressive against its premium valuation. Fractal showed remarkable financial progress and turned a ₹55 crore loss in FY24 into a ₹221 crore profit in FY25. The company’s roster of over 100 Fortune 500 clients and high retention rates definitely build confidence in its business model.

    Some risks need careful thought. Client concentration raises eyebrows with top 10 clients making up 54.2% of revenue. The high OFS component means existing investors will get most proceeds instead of funding company growth. The valuation at 78.9x P/E looks steep compared to traditional IT companies.

    Fractal Analytics ended up being a better fit for growth-focused investors who want exposure to the expanding AI market over a longer period. The premium valuation might not appeal to conservative investors or those looking for quick listing gains. You should match Fractal’s position in the ever-changing AI sector with your risk appetite and investment goals before making a decision.

    Frequently Asked Questions

    The IPO price band is fixed between ₹857 and ₹900 per equity share.

    The IPO opens on February 9, 2026, and closes on February 11, 2026.

    The GMP is currently in the range of ₹57 to ₹99 per share over the upper price band.

    Revenue rose from ₹2,196 crore in FY24 to ₹2,765 crore in FY25, with profitability turning positive.

    Key risks include a large OFS component, high client concentration, and premium valuation.

    Disclaimer: This blog is intended solely for educational and informational purposes and should not be construed as investment advice or a recommendation. While efforts have been made to ensure the accuracy and reliability of the information and data presented, no representation or warranty, express or implied, is made regarding its completeness or correctness. Readers are advised to independently verify all information and consult a qualified financial advisor before making any investment decisions. Investments in the securities market are subject to market risks. Please read all relevant offer documents and disclosures carefully before investing.,

  • Aye Finance IPO Guide: What Investors Should Know

    Aye Finance IPO Guide: What Investors Should Know

    Aye Finance Limited’s upcoming ₹1,010 crore IPO launch from February 9 to February 11, 2026, creates a buzz in the gray market. The book-building issue combines a fresh issue of 5.50 crore shares worth ₹710 crores and an offer for sale of 2.33 crore shares valued at ₹300 crores. Retail investors must invest a minimum of ₹14,964 for the standard lot size of 116 shares, with the price band set between ₹122 and ₹129 per share.

    The IPO gray market premium shows measured optimism among investors. Early February 2026 numbers reveal a gray market premium between ₹1 and ₹5. This points to an expected listing price of ₹130-₹134 when the shares debut on February 16, 2026 [-5]. The modest gray market price comes despite Aye Finance’s strong financial performance, with revenue jumping 40.42% from ₹1,071.75 crores in March 2024 to ₹1,504.99 crores in March 2025. Still, investors should consider the increase in Gross NPA from 2.5% in FY23 to 4.9% in H1 FY26.

    Aye Finance launches ₹1,010 Cr IPO with fresh issue and OFS

    Aye Finance plans to raise ₹1,010 crore through its public offering. This move represents a key milestone as the non-banking lender steps into capital markets. The mainboard IPO combines a fresh issue worth ₹710 crore through 5.50 crore shares and existing shareholders will sell 2.33 crore shares valued at ₹300 crore. Investors can participate in the company’s growth story as the NBFC lists on both BSE and NSE.For a deeper understanding of the business structure, operations, and financial background, readers can explore aye-finance-company.

    IPO opens on Feb 9 and closes on Feb 11, 2026

    Investors can bid for Aye Finance shares over three days from Monday, February 9 until Wednesday, February 11, 2026. The company will finalize share allotment on Thursday, February 12. Investors should receive their refunds and shares in demat accounts by Friday, February 13. The shares are expected to start trading on Monday, February 16, 2026.Eligible investors can Apply Now during the IPO window.

    The IPO allocation follows a structured approach. Qualified institutional buyers will get 75% of the shares, while non-institutional investors can access 15%. Retail investors have a 10% share in the public issue.

    Price band set at ₹122–₹129 per share

    The company has set its IPO price between ₹122 and ₹129 per share. At ₹129 per share, Aye Finance’s value stands at approximately ₹3,184 crore. Each share has a face value of ₹2.

    Market indicators point to an expected listing price of ₹134, suggesting a potential 3.88% premium based on current ipo gray market premium today. Early investors seem cautiously optimistic about the IPO’s prospects.

    Lot size fixed at 116 shares for retail investors

    Retail investors must buy at least 116 shares to participate. This means investing ₹14,964 at the upper price of ₹129 per share. The standardized lot size helps smaller investors participate meaningfully.

    Different investor categories have their own minimum requirements. Small non-institutional investors need to apply for 14 lots (1,624 shares), investing ₹209,496. Big non-institutional investors must buy at least 67 lots (7,772 shares), totaling ₹1,002,588.

    Retail investors can apply for up to 13 lots. This equals 1,508 shares and requires about ₹184,000.

    Anchor investors participate on Feb 6

    Aye Finance will allocate shares to anchor investors on Friday, February 6, 2026. This pre-IPO placement with institutional investors helps build market confidence.

    Anchor investors, typically established financial institutions and funds, commit to holding their shares for a set period. Their participation and agreed price often shape the ipo gray market premium and retail investor sentiment.

    Investment banks are managing the IPO, with listing planned on both major Indian exchanges. Current ipo gray market gmp indicators suggest reasonable valuation, though some investors remain cautious due to market conditions and sector-specific factors.

    Company highlights strong MSME lending model in RHP

    Aye Finance’s Red Herring Prospectus (RHP) highlights its specialized lending model. The company targets underserved micro-enterprises, which might explain the cautious yet positive ipo gray market premium today. Investors need to learn about the company’s core business strengths as they review this offering against ipo gray market price indicators.

    Focus on micro-scale MSMEs with secured and unsecured loans

    Aye Finance is a 10-year-old leader in small-ticket loans to micro-scale MSMEs. They serve businesses with annual turnover between ₹10 lakh and ₹1 crore. Their portfolio has both secured and unsecured financing options. These are custom-made for micro-enterprises that regular banks often ignore.

    The lender’s products consist of hypothecation loans (83.3% of AUM), mortgage loans (14.7%), and quasi-mortgage loans (2%) as of March 2025. The company takes a conservative approach by marking 57.3% of its portfolio as secured. This includes mortgage and hypothecation of underlying inventory and receivables. The remaining 42.7% is marked as unsecured.

    These financial solutions average around ₹1.25 lakh per loan. They help businesses with working capital needs and expansion across manufacturing, trading, dairy (livestock), and service segments. The portfolio spreads across trading (50.7%), livestock rearing (29.1%), manufacturing (10.7%), services (7.6%), and job work (1.9%) as of March 2025.

    Cluster-based underwriting and cash flow analysis

    Aye Finance stands out with its proprietary “cluster-based credit assessment” method. This approach tackles the challenge of thin-file documentation and missing credit history among micro-entrepreneurs. The company has fine-tuned this competitive edge over the last several years.

    The company doesn’t just rely on traditional documentation. They review creditworthiness based on business cash flows and margins. This happens through specific understanding of “business clusters” using observable data points. So far, they’ve given customized business loans worth over ₹5,000 crores to more than 350,000 customers.

    The company runs a “phygital” business model that blends digital technology with physical presence. They use a paperless system with analytics and monitoring tools that capture micro enterprises’ cash flows digitally. This smart risk selection method combines AI/ML algorithms and analytical scorecards. It makes credit available to businesses that couldn’t access formal lending before.

    Pan-India presence across 18 states and 3 UTs

    Aye Finance has grown into a major player with 568 branches across 18 states and 3 union territories in India. Their network now serves 586,825 active unique customers as of September 2025.

    The company’s assets under management (AUM) jumped by a lot from ₹2,721.55 crore in March 2023 to ₹6,027.62 crore by September 2025. Their disbursements rose from ₹2,357.09 crore in FY23 to ₹4,291.33 crore in FY25.

    The portfolio shows strong geographic spread. The top three states—Bihar (15%), Uttar Pradesh (14.7%), and Rajasthan (11.7%)—make up 41.4% of total exposure. The rest spreads across other regions. This wide reach makes Aye the only scaled, pan-India player offering unsecured small-ticket business loans to micro-enterprises.

    Use of SwitchPe platform for supply chain finance

    The RHP highlights Aye Finance’s SwitchPe platform. This credit-backed payment solution helps merchants manage their working capital better. The platform provides uninterrupted connectivity to well-priced suppliers and unsecured credit lines. This solves common supply chain issues that small businesses face.

    SwitchPe comes with paperless onboarding, zero joining fees, no foreclosure charges, and up to 14 days of interest-free credit. The platform builds on evidence-based learning from over 5 lakh happy merchants and their borrowing history with Aye Finance.

    SwitchPe was built to fix everyday small business problems. It offers a complete solution for retail supply chains. The platform works as a digital hyper-local marketplace. Here, merchants can find new distributors and vice versa. This creates extra value for Aye’s existing customers. After starting in select cities, Aye plans to roll out SwitchPe across 22 states where they have a strong presence.

    Aye Finance reports robust growth in AUM and customer base

    Financial indicators show Aye Finance’s impressive growth as the company gets ready for its market debut. The current IPO gray market sentiment looks promising. Investors are watching these metrics closely to assess the IPO gray market premium today.

    AUM grew from ₹2,721 Cr (FY23) to ₹6,027 Cr (H1 FY26)

    Aye Finance showed remarkable asset growth in recent years. The Assets Under Management (AUM) expanded from ₹2,721.55 crore in March 2023 to ₹6,027.62 crore by September 2025. This growth represents a reliable CAGR of 42.60% from FY23 through FY25. The company’s momentum stayed strong as AUM reached about ₹4,300 crore by March 2024 and climbed to ₹5,525 crore by March 2025.

    The lender’s disbursements also jumped significantly. They rose from ₹2,357.09 crore in FY23 to ₹4,291.33 crore in FY25. This growth lines up with what management predicted earlier about crossing the ₹6,000 crore AUM mark in FY26. Such steady growth has drawn attention in the IPO gray market, where premiums often reflect how confident investors feel about a company’s potential.

    Customer base doubled to 5.8 lakh+ in 2 years

    Aye Finance’s customer base grew alongside its financial success. The number of active unique customers jumped from 305,524 in March 2023 to 586,825 by September 2025. The customer base doubled in just two and a half years. This rapid growth shows the company’s strong presence in the MSME segment.

    The company serves its growing customer base through 568 branches across 18 states and three union territories. This network gives them a true pan-India presence. The company’s workforce grew too. They had 8,388 full-time employees by September 2024, which grew to 10,459 by September 2025. This suggests a major expansion to support their growing customer base.

    Revenue and PAT trends from FY23 to FY25

    Aye Finance’s revenue showed consistent strong growth. Total income climbed from ₹643.34 crore in FY23 to ₹1,071.75 crore in FY24, then reached ₹1,504.99 crore in FY25. The first half of FY26 brought in ₹863.02 crore. This impressive growth could boost the IPO gray market premium as listing nears.

    The Profit After Tax (PAT) saw dramatic improvements. It soared from ₹39.87 crore in FY23 to ₹171.68 crore in FY24—a 330% jump. PAT then settled at ₹175.25 crore in FY25, growing by about 2%. The company earned a PAT of ₹64.60 crore in the six months ended September 2025.

    Net Interest Income (NII) also trended upward. It grew from ₹368.52 crore in FY23 to ₹622.15 crore in FY24 and reached ₹857.96 crore in FY25, achieving a CAGR of about 52.56%.

    Net worth and borrowing metrics

    The company’s balance sheet looks increasingly strong. Net worth grew from ₹754.49 crore in FY23 to ₹1,232.65 crore in FY24, then reached ₹1,658.87 crore in FY25. By September 2025, the company’s net worth stood at ₹1,727.37 crore. This stronger capital base helped fuel their growth plans.

    Total borrowings grew accordingly. They rose from ₹2,296.16 crore in FY23 to ₹3,498.99 crore in FY24 and ₹4,526.33 crore in FY25, reaching ₹5,218.50 crore by September 2025. The Debt-to-Equity ratio stayed manageable at 3.02 as of September 2025, compared to 2.73 in March 2025.

    Return on Equity (ROE) numbers varied over time. They improved from 5.46% in FY23 to 17.28% in FY24, before settling at 12.12% in FY25. These financial basics could play a key role as investors assess the IPO gray market price before the public offering.

    RHP flags rising NPAs and unsecured loan exposure as key risks

    Aye Finance’s Red Herring Prospectus (RHP) explains several risk factors that investors should think over before entering the IPO gray market, despite its impressive growth metrics. The company’s modest IPO gray market premium today could in part reflect these concerns as it moves toward public offering.

    Gross NPA rose from 2.49% to 4.21% in 2 years

    The steady decline in Aye Finance’s asset quality should worry investors who track the IPO gray market price. The gross non-performing assets (NPA) ratio has steadily risen from 2.49% as of March 31, 2023 to 4.21% as of March 31, 2025. This trend continued into the current fiscal year, reaching 4.85% by September 30, 2025. The company’s pre-provisioning operating profit-to-credit cost ratio fell to 1.78x in FY25 from better levels of 2.7x in FY24 and 1.97x in FY23. The overall average collection efficiency also dropped to about 95% in FY25 from 98% in FY24.

    Unsecured loans form ~38% of AUM

    Much of Aye Finance’s portfolio consists of unsecured exposure. Unsecured loans made up 37.97% of total assets under management by September 2025. This number has changed over the years—41.47% (September 2024), 39.68% (FY25), 37.91% (FY24), and 30.26% (FY23). The unsecured segment brings higher credit risk, with the RHP noting a higher GNPA of 5.70%. First-time formal borrowers make up 37.17% of total advances as of September 30, 2025, which could lead to more defaults.

    Negative cash flows from operations in past years

    The RHP states that Aye Finance “has experienced negative cash flows from operating activities in the past”. This pattern raises questions about sustainability, particularly if economic conditions worsen. The company focuses on micro-enterprises with limited or informal financial records, which increases the chances of borrower defaults and could affect future cash flows negatively.

    Dependence on third-party data for underwriting

    Aye Finance heavily relies on “the accuracy and completeness of information provided by customers and certain third-party service providers”. Wrong, incomplete, or misleading information could hurt the assessment of borrower creditworthiness, collateral valuation, and title verification. This creates a weakness, especially since the company’s “cluster-based” underwriting approach needs reliable data.

    These risk factors challenge the growth story and could affect the new IPO gray market premium as investors balance opportunities with risks. The careful IPO gray market GMP might reflect these concerns along with broader market views about NBFCs serving the MSME sector.

    IPO gray market premium today shows cautious optimism

    The gray market for Aye Finance IPO shows cautious optimism among early investors. The IPO gray market premium helps us understand how the stock might perform when it lists.

    GMP stands at ₹1–₹5, suggesting 0.78% to 3.88% premium

    The IPO gray market premium today for Aye Finance shares is around ₹1. This small premium means investors might see gains of about 0.78% above the upper price band of ₹129. The premium has moved between ₹0 and ₹5 lately. Some sources reported a premium of ₹5 on February 4, which could mean gains of 3.88%.

    The current GMP shows balanced investor interest. Investors seem neither too excited nor too worried about the offering. The company’s 15-year old business model and growth story suggest this careful gray market price reflects both its strengths and risks.

    Estimated listing price around ₹130

    The expected listing price for Aye Finance shares is close to ₹130. This number comes from adding the current GMP to the issue’s upper price band of ₹129. Market watchers sometimes predicted higher prices up to ₹134 when the GMP briefly reached ₹5.

    GMP trends in the last week

    Aye Finance’s new IPO gray market premium has been quite volatile lately. The GMP started at zero (₹0) on February 2-3, then jumped to ₹5 on February 4. The premium then dropped to ₹1 and stayed there from February 5 through February 6.

    This quick drop from ₹5 to ₹1 is a big deal as it means that investors are paying attention to the risk factors in the company’s RHP, especially the rising NPAs and high unsecured loan exposure.

    Disclaimer on gray market trading

    The IPO gray market GMP numbers are not official and come from speculation. This market operates without any regulation and outside the control of stock exchanges and SEBI.

    These GMP values can change dramatically before the actual listing date. Making investment decisions based only on gray market premiums is risky. Financial experts always say you should do your research or talk to qualified professionals before using gray market indicators to make investment choices.

    What is Aye Finance and who are its key investors?

    Market watchers closely track the predicted IPO gray market activity of a financial institution that has come a long way. A look at Aye Finance’s background and investors helps explain current IPO gray market premium trends as investors review this upcoming listing.

    Founded in 1993, headquartered in Gurugram

    Aye Finance started its journey in 1993 and set up its headquarters in Gurugram. The company grew into a non-deposit taking NBFC that serves micro and small enterprises (MSEs) in India. The company became active in 2014 and has worked to help underbanked segments through technological breakthroughs.

    Backed by CapitalG, LGT Capital, Elevation Capital

    Aye Finance has secured major investments from leading global institutions. Elevation Capital V leads with a 16.19% stake, while LGT Capital owns 14.13%. On top of that, CapitalG (Alphabet’s investment arm), Alpha Wave India, and several other international investors have fueled the company’s growth.

    No promoter holding; professionally managed

    Aye Finance stands out by operating without traditional promoter holding. The company runs under professional management with co-founders Sanjay Sharma (Managing Director & CEO) and Vikram Jetley at the helm. Sanjay Sharma leads strategy and operations with his unmatched banking experience.

    Lead managers include Axis, JM Financial, IIFL

    Aye Finance picked Axis Capital, IIFL Capital, JM Financial, and Nuvama Wealth Management as book-running lead managers. These institutions oversee the offering that shows modest IPO gray market premium today. This reflects balanced investor sentiment toward this MSME lender.

    Conclusion

    Aye Finance’s ₹1,010 crore IPO gives investors a great chance to enter the MSME lending space. The company started by serving underbanked micro-enterprises and grew into a pan-India player with over 5.8 lakh customers, which shows its resilient business model. The company’s impressive AUM grew from ₹2,721 crore in FY23 to ₹6,027 crore by H1 FY26, proving its strong market reach.

    Investors should weigh these strengths against some key risks. The Gross NPA ratio jumped from 2.49% to 4.85% over two years, raising concerns about asset quality management. The portfolio’s 38% unsecured loan component needs a closer look due to its higher default risk profile.

    The gray market shows a modest premium of ₹1-₹5, which balances Aye Finance’s growth story with its challenges. This GMP points to a possible listing price of ₹130-₹134, a premium of about 0.78% to 3.88% over the upper price band.

    Retail investors must put in at least 116 shares (₹14,964). They’ll need to evaluate if the company’s innovative cluster-based underwriting model and wide branch network across 18 states make it worth investing. The IPO reserves 75% for qualified institutional buyers, 15% for non-institutional investors, and 10% for retail investors.

    Aye Finance ended up at a crucial point as it moves to public markets. Its proprietary credit assessment method and SwitchPe platform give it an edge, but changing ROE metrics and rising NPAs need careful study. Smart investors should look beyond gray market signals and do their homework as the February 16, 2026 listing date gets closer.

    Frequently Asked Questions

    The IPO price band is ₹122–₹129 per share. The retail lot size is 116 shares, requiring ₹14,964 at the upper band.

    AUM increased from ₹2,721 crore in FY23 to ₹6,027 crore by H1 FY26, reflecting strong growth momentum.

    Key risks include rising Gross NPAs, high unsecured loan exposure, past negative operating cash flows, and reliance on third-party data.

    Major investors include Elevation Capital V, LGT Capital, CapitalG, and Alpha Wave India.

    The GMP is around ₹1–₹5, indicating a possible listing price near ₹130–₹134.

    Disclaimer: This blog is intended solely for educational and informational purposes and should not be construed as investment advice or a recommendation. While efforts have been made to ensure the accuracy and reliability of the information and data presented, no representation or warranty, express or implied, is made regarding its completeness or correctness. Readers are advised to independently verify all information and consult a qualified financial advisor before making any investment decisions. Investments in the securities market are subject to market risks. Please read all relevant offer documents and disclosures carefully before investing.,
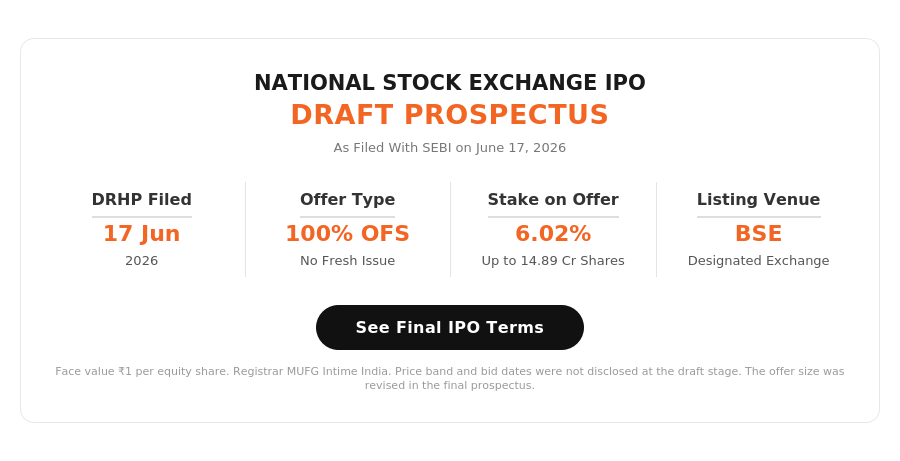
  • Amagi Media Labs IPO: Complete Guide to Price, Dates & Financials

    Amagi Media Labs IPO: Complete Guide to Price, Dates & Financials

    If you have ever streamed a free movie on your smart TV or watched a specialized sports channel on an app without a cable subscription, you have likely interacted with the technology behind Amagi Media Labs. As the global media landscape shifts aggressively from traditional cable to internet-based streaming, the “plumbing” that makes this transition possible has become big business.

    Amagi Media Labs is positioning itself at the center of this revolution. As a Software-as-a-Service (SaaS) unicorn, they provide the cloud technology that allows broadcasters and content owners to launch, distribute, and monetize channels across the globe. Now, they are bringing this growth story to the public markets.

    For retail investors, the upcoming Initial Public Offering (IPO) presents an opportunity to invest in the infrastructure of the streaming boom. However, with the company operational transitioning from a high-growth, high-burn phase into profitability, understanding the financial nuances is critical.

    In this detailed guide, we will break down the Amagi Media Labs IPO, analyzing the price band, the company’s path to profitability, and the risks and rewards you need to consider before adding this stock to your portfolio.

    IPO Snapshot: Key Dates and Numbers

    Before diving into the business model, let’s look at the essential details of the offer. Amagi Media Labs is looking to raise approximately ₹1,789 Crore through a mix of fresh equity and an Offer for Sale (OFS). Investors interested in participating can Apply now while reviewing the key dates and pricing structure outlined below.

    Here is the tentative schedule and pricing structure you need to know:

    • IPO Opening Date: Tuesday, January 13, 2026
    • IPO Closing Date: Friday, January 16, 2026
    • Price Band: ₹343 to ₹361 per share
    • Lot Size: 41 Shares
    • Total Issue Size: ₹1,789 Crore
    • Face Value: ₹5 per share
    • Tentative Listing Date: Wednesday, January 21, 2026

    Understanding the Issue Structure
    It is important for investors to distinguish where the money is going.

    • Fresh Issue (₹816 Crore): This capital goes directly into the company. Amagi plans to use ₹550 Crore of this for technology and cloud infrastructure expansion, specifically scaling their AI-led ad tech. The rest will fund inorganic growth (acquisitions) and general corporate purposes.
    • Offer for Sale (OFS): The remaining portion involves existing investors—such as Accel India, Norwest Venture Partners, and early shareholders—selling part of their stake. The company does not receive proceeds from this portion.

    What Does Amagi Media Labs Actually Do?

    Amagi is not a content creator; they are a technology enabler. They operate what is known as a “glass-to-glass” cloud platform. This means they handle the entire lifecycle of a video broadcast, from the camera lens (glass) to the viewer’s screen (glass).

    Traditionally, TV stations required massive, expensive hardware, satellites, and on-premise servers to broadcast content. Amagi replaces all of that with the cloud. They allow media companies to spin up new channels, distribute them to platforms like Roku or Apple TV, and insert targeted ads, all through a web-based dashboard.

    The Three-Sided Marketplace

    Amagi’s business model is robust because it serves three distinct groups, creating a network effect:

    1. Content Providers: Studios and networks (like Lionsgate, Fox, and NBC) use Amagi to manage and play out their video feeds.
    2. Distributors: Streaming platforms (like Roku, VIZIO, and Rakuten TV) use Amagi to receive content formatted perfectly for their apps.
    3. Advertisers: Brands use Amagi’s dynamic ad-insertion technology to place ads into these streams in real-time.

    As more content providers join, more distributors want to carry those channels. As viewership grows, advertisers are willing to pay more for ad slots. Amagi sits in the middle, monetizing every part of this flow.

    Revenue Model: How Amagi Makes Money

    For a retail investor, understanding how a SaaS company generates cash is vital, especially when evaluating long-term sustainability alongside factors like the Amagi Media Labs Share Price. Amagi has moved beyond simple subscription fees to a diversified revenue model.

    • Fixed Subscription Fees: Clients pay a monthly recurring fee to use the Amagi CLOUDPORT platform to manage and broadcast their channels. This provides steady, predictable cash flow.
    • Usage-Based Fees: Similar to a utility bill, some clients pay based on the hours of content they process or stream.
    • Revenue Share (Ad Tech): This is a high-growth area. Through its “Thunderstorm” product, Amagi inserts ads into streams. They take a cut of the ad revenue generated (based on impressions and fill rates).
    • Event-Based Pricing: For massive one-off events, like the Olympics or elections, Amagi charges specific fees for orchestration and dynamic ad management.

    Financial Health: From Burn to Profitability

    SaaS companies often run losses for years to capture market share. Amagi fits this profile but is currently at a turning point.

    Revenue Growth
    The company has demonstrated impressive top-line growth. Revenue from operations jumped from ₹680 Crore in FY23 to ₹1,162 Crore in FY25. This represents a Compound Annual Growth Rate (CAGR) of 30.7%.

    The Profitability Turnaround
    Historically, Amagi prioritized growth over profit, resulting in losses in FY23 and FY24. However, the data for FY25 and H1 FY26 shows a significant shift:

    • Gross Margins: Expanded to nearly 69.6% in H1 FY25. As they scale, their cost of delivering services (COGS) decreases relative to revenue.
    • EBITDA: The company transitioned from a negative EBITDA margin of -50% in FY23 to a positive 2.02% in FY25.
    • Net Profit: Amagi turned profitable in the first half of FY26, posting a Profit After Tax (PAT) of ₹64.70 million.

    Balance Sheet Strength
    A key indicator of safety for retail investors is debt. Amagi maintains a debt-free balance sheet. Their net worth has risen to ₹859 Crore, and the fresh issue will further fortify their cash reserves for future acquisitions or R&D.

    Industry Tailwinds: Why Now?

    The timing of this IPO aligns with a massive structural shift in the media industry.

    The Rise of FAST
    FAST stands for Free Ad-Supported Streaming TV. Consumers are experiencing “subscription fatigue” from paying for Netflix, Disney+, Hulu, and others. As a result, they are flocking to free, linear channels that look like traditional TV but are streamed over the internet.
    The FAST market is projected to double from $6.6 billion in 2024 to $13.3 billion by 2029. Amagi is a dominant player in enabling these FAST channels.

    Legacy Migration
    Believe it or not, 90% of global broadcast operations still rely on old-school, on-premise hardware. This is expensive and inflexible. Media companies are desperate to cut costs and are migrating to the cloud. Amagi’s cloud solutions can reduce Total Cost of Ownership (TCO) by 35-50%, making them an attractive partner during economic downturns.

    SWOT Analysis for Investors

    Before placing a bid, weigh the strengths against the potential risks.

    Strengths

    • Customer Stickiness: Amagi boasts a Net Revenue Retention (NRR) of 126.9%. This means that for every $100 a customer spent last year, they are spending $126.90 this year. Existing clients are growing with the platform.
    • Global Clientele: They serve 45% of the top 50 global media companies.
    • Technology Moat: With over 10 granted patents and AI capabilities for ad-yield optimization, their tech stack is difficult for competitors to replicate quickly.

    Weaknesses

    • Geographic Concentration: A massive 72.86% of their revenue comes from the Americas. While they are a global company, they are heavily dependent on the US economic climate.
    • Client Concentration: Losing a major partner like Roku or a top-tier studio could impact revenues significantly.
    • High Employee Costs: While decreasing as a percentage of sales, employee benefits still make up nearly 60% of expenses due to the high cost of tech talent.

    Opportunities

    • International Expansion: With under 2% of revenue coming from the Middle East and only 6.7% from Asia-Pacific, there is a massive runway to expand into emerging markets.
    • New Verticals: The technology used for TV can be adapted for e-sports, education, and healthcare streaming.

    Threats

    • Competition: Legacy hardware vendors are trying to build cloud solutions, and tech giants (like Amazon or Google) could theoretically build competing tools.
    • Ad Market Volatility: Since a portion of revenue is tied to ad impressions, a global recession that causes brands to cut ad spend would directly hurt Amagi’s bottom line.

    Conclusion

    Amagi Media Labs represents a classic “picks and shovels” play on the streaming industry. Rather than betting on which streaming service will win the content war, investing in Amagi is a bet on the infrastructure that powers all of them.

    The company checks several boxes for growth investors: high revenue growth, a debt-free balance sheet, expanding margins, and a clear path to profitability. The transition from loss-making to profit-generating in FY26 is a strong signal of operational maturity.

    However, the valuation and the risks associated with US market dependency should be considered. This IPO is best suited for investors with a moderate-to-high risk tolerance who believe in the long-term shift toward ad-supported streaming and cloud broadcasting.

    As always, ensure this investment aligns with your broader financial goals and portfolio diversification strategy.

    Frequently Asked Questions (FAQ)

    To participate in the IPO, you need to bid for a minimum of one lot. With a lot size of 41 shares and the upper price band at ₹361, the minimum investment would be ₹14,801.

    Yes, the company has recently turned a corner. While they posted losses in FY23 and FY24 due to heavy investment in growth, they reported a Net Profit of ₹64.70 million in the first half of FY26.

    Amagi competes with legacy broadcast hardware providers who are pivoting to the cloud, as well as niche SaaS players. However, Amagi distinguishes itself by offering an end-to-end “glass-to-glass” platform rather than just isolated solutions.

    Amagi is currently a growth-stage company. It is reinvesting its profits back into technology, infrastructure, and acquisitions to capture more market share. Therefore, it is unlikely to pay dividends in the near future.

    This is an industry term indicating that Amagi handles the video signal from the moment it is captured (the camera lens glass) to the moment it is viewed (the TV or phone screen glass), handling processing, distribution, and monetization in between.

    Disclaimer: This blog is intended solely for educational and informational purposes and should not be construed as investment advice or a recommendation. While efforts have been made to ensure the accuracy and reliability of the information and data presented, no representation or warranty, express or implied, is made regarding its completeness or correctness. Readers are advised to independently verify all information and consult a qualified financial advisor before making any investment decisions. Investments in the securities market are subject to market risks. Please read all relevant offer documents and disclosures carefully before investing.

  • Bharat Coking Coal IPO 2026: Comprehensive Review of Financials & Growth Potential

    Bharat Coking Coal IPO 2026: Comprehensive Review of Financials & Growth Potential

    India’s infrastructure ambitions are massive, and steel is the backbone of that growth. While many investors focus on steel manufacturers, smart retail investors often look upstream to the raw materials that make steel production possible. This brings us to the upcoming initial public offering (IPO) of Bharat Coking Coal Limited (BCCL). As a subsidiary of the state-owned giant Coal India Limited, BCCL holds a unique and dominant position in the energy sector.

    Scheduled to open for subscription in January 2026, this IPO represents a significant opportunity for the public to own a stake in India’s largest producer of coking coal. But is this public sector undertaking (PSU) a solid addition to your portfolio? To help you make an informed decision, we are breaking down the company’s business model, analyzing its financial health, and evaluating the long-term growth prospects.

    IPO Snapshot: Key Dates and Details

    Before analyzing the fundamentals, let’s look at the logistical details of the offer. The IPO is structured entirely as an Offer for Sale (OFS), meaning the promoter, Coal India Limited, is selling a portion of its stake to the public. BCCL itself will not receive proceeds from this issue.

    Here are the essential details you need to mark on your calendar:

    • IPO Open Date: January 9, 2026
    • IPO Close Date: January 13, 2026
    • Price Band: ₹21 to ₹23 per share
    • Lot Size: 600 Shares
    • Total Issue Size: ₹1,071 Crore
    • Tentative Listing Date: January 16, 2026
    • Listing Exchanges: BSE and NSE

    For retail investors, the entry point is accessible, with the price band set between ₹21 and ₹23, and interested investors can apply now during the offer period to participate in the listing.

    Company Overview: The Coking Coal Monopoly

    To understand the value of BCCL, you must understand the difference between thermal coal and coking coal. While thermal coal is used to generate electricity, coking coal is an irreplaceable ingredient in steel manufacturing.These fundamentals form the basis of the Bharat Coking Coal Ltd. IPO details for investors evaluating the company.

    Bharat Coking Coal Limited is the undisputed leader in this space. As of FY25, the company accounted for 58.50% of domestic coking coal production. More importantly, BCCL is the only source of prime coking coal in India. This gives the company a significant competitive moat.

    Operational Footprint

    BCCL operates primarily in the Jharia coalfield in Jharkhand and the Raniganj coalfield in West Bengal. These are historic mining zones with rich deposits. The company currently manages:

    • 34 Operational Mines: A mix of opencast, underground, and mixed projects.
    • 5 Operational Washeries: Located at Moonidih, Madhuband, Dahibari, Patherdih I, and Madhuband NLW.

    The company is also backed by a massive resource base of approximately 7.91 billion tonnes, providing high visibility for long-term production.

    Revenue Model

    BCCL generates revenue through three main channels:

    1. Raw Coal: Sales of coking coal to steel plants and non-coking coal to power plants.
    2. Washed Coal: Coal that has been processed to reduce ash content, fetching a higher price.
    3. By-products: Sales of middlings, slurry, and rejects.

    The clientele is impressive, consisting largely of Public Sector Undertakings (PSUs) and major power producers like SAIL, NTPC, and Damodar Valley Corporation.

    Industry Landscape: The Demand for Steel

    The investment case for BCCL is closely tied to India’s steel industry. The government has set an ambitious target to reach a crude steel capacity of 300 million tonnes per annum (MTPA) by FY31. Since coking coal is a non-substitutable input for steel, demand is expected to remain robust.

    Currently, India imports about 90% of its coking coal requirements, mostly from Australia and the USA. This high import dependence is a strategic vulnerability for the country. Under the “Atma-Nirbhar Bharat” (Self-Reliant India) initiative, the government is pushing hard for import substitution.

    This is where BCCL plays a critical role. By expanding its production and washing capabilities, BCCL aims to replace expensive imported coal with domestic supply. This macro-economic tailwind provides a long runway for growth.

    Financial Analysis: A Deep Dive

    For a retail investor, the numbers tell the real story. Let’s analyze BCCL’s financial performance over the last few years to gauge its stability and profitability.

    Revenue Trends

    BCCL has shown consistent sales performance.

    • FY23 Sales: ₹132,809 Million
    • FY24 Sales: ₹140,453 Million
    • FY25 Sales: ₹139,984 Million

    While sales were relatively flat in FY25, projections for the future are optimistic. Revenue is forecast to grow to ₹153,798 Million in FY26 and ₹172,995 Million in FY27. This growth is expected to be driven by increased production volumes and better realization per tonne.

    Profitability and Margins

    The company has seen a significant improvement in its operating margins.

    • EBITDA Margin: Jumped from 4% in FY23 to 15% in FY24, stabilising at 13% in FY25.
    • Net Profit: Rose from ₹6,647 Million in FY23 to ₹12,401 Million in FY25.

    It is worth noting that FY25 saw a dip in profit compared to FY24 (which was ₹15,644 Million). This was largely due to external headwinds, including excessive rainfall that hampered production and offtake. However, cost efficiency measures helped mitigate the impact.

    Balance Sheet Strength

    One of the most attractive features of BCCL for a risk-averse retail investor is its debt-free balance sheet. The company has no long-term borrowings and has successfully eliminated accumulated losses as of FY24. This financial resilience allows the company to invest in modernization without the burden of high interest payments.

    Key Ratios

    • Return on Net Worth (RoNW): Stood at 20.83% in FY25, indicating efficient use of shareholder equity.
    • Return on Capital Employed (ROCE): A healthy 30.13% in FY25, showing strong returns on the capital invested in the business.
    • Earnings Per Share (EPS): ₹2.7 in FY25, projected to rise to ₹3.3 in FY26 and ₹3.7 in FY27.

    SWOT Analysis

    Bharat Coking Coal IPO 2026

    Every investment carries risks and rewards. Here is a breakdown of BCCL’s position:

    Strengths

    • Market Dominance: Largest producer of coking coal in India.
    • Parentage: Backed by Coal India Limited, ensuring financial and technical support.
    • Integrated Operations: Strong rail and road connectivity in mining zones.
    • Financial Health: Zero long-term debt and strong cash flow generation potential.

    Weaknesses

    • Quality Issues: Domestic coal has high ash content, requiring washing/beneficiation before it can be used in steel production.
    • Geographic Concentration: Operations are concentrated in Jharia and Raniganj, making the company vulnerable to regional disruptions.
    • Legacy Issues: The Jharia coalfield faces environmental challenges, including underground mine fires and land subsidence.

    Opportunities

    • Washery Expansion: BCCL is adding 7.00 MTPA of new washery capacity. This will improve the quality of coal, making it more competitive against imports.
    • Import Substitution: As steel demand rises, domestic steelmakers are eager to source local coal to reduce costs.
    • Diversification: The company is expanding into Coal Bed Methane (CBM) and solar power, opening new revenue streams.

    Threats

    • Green Transition: The long-term global shift toward renewable energy and India’s net-zero 2070 target poses a structural risk to the coal industry.
    • Regulatory Changes: Stricter environmental norms could increase compliance costs.
    Bharat Coking Coal IPO 2026

    Every investment carries risks and rewards. Here is a breakdown of BCCL’s position:

    Strengths

    • Market Dominance: Largest producer of coking coal in India.
    • Parentage: Backed by Coal India Limited, ensuring financial and technical support.
    • Integrated Operations: Strong rail and road connectivity in mining zones.
    • Financial Health: Zero long-term debt and strong cash flow generation potential.

    Weaknesses

    • Quality Issues: Domestic coal has high ash content, requiring washing/beneficiation before it can be used in steel production.
    • Geographic Concentration: Operations are concentrated in Jharia and Raniganj, making the company vulnerable to regional disruptions.
    • Legacy Issues: The Jharia coalfield faces environmental challenges, including underground mine fires and land subsidence.

    Opportunities

    • Washery Expansion: BCCL is adding 7.00 MTPA of new washery capacity. This will improve the quality of coal, making it more competitive against imports.
    • Import Substitution: As steel demand rises, domestic steelmakers are eager to source local coal to reduce costs.
    • Diversification: The company is expanding into Coal Bed Methane (CBM) and solar power, opening new revenue streams.

    Threats

    • Green Transition: The long-term global shift toward renewable energy and India’s net-zero 2070 target poses a structural risk to the coal industry.
    • Regulatory Changes: Stricter environmental norms could increase compliance costs.

    Yes, BCCL is a wholly-owned subsidiary of Coal India Limited, which is a Maharatna PSU under the Ministry of Coal, Government of India.

    Thermal coal is burned to create steam for electricity generation. Coking coal (metallurgical coal) is baked in a furnace to create coke, which is used to smelt iron ore into steel. BCCL specializes in coking coal.

    This IPO is an Offer for Sale (OFS). This means existing shares held by the promoter (Coal India) are being sold to the public. The money goes to the promoter, not the company’s treasury.

    The minimum investment for a retail investor is one lot. With a lot size of 600 shares and a price band of ₹21-₹23, the minimum investment would be between ₹12,600 and ₹13,800.

    No, as of the latest financial reports, BCCL has a debt-free balance sheet with no long-term borrowings.

    Disclaimer: This blog is intended solely for educational and informational purposes and should not be construed as investment advice or a recommendation. While efforts have been made to ensure the accuracy and reliability of the information and data presented, no representation or warranty, express or implied, is made regarding its completeness or correctness. Readers are advised to independently verify all information and consult a qualified financial advisor before making any investment decisions. Investments in the securities market are subject to market risks. Please read all relevant offer documents and disclosures carefully before investing.