findocblog

Category: IPOs

  • Bonfiglioli Transmissions IPO Review: Price Band, Dates, Lot Size and Financials

    Bonfiglioli Transmissions IPO Review: Price Band, Dates, Lot Size and Financials

    The Bonfiglioli Transmissions IPO opens on 15 October 2026 and closes on 19 October 2026. The price band is ₹558 to ₹586 per share, the lot size is 25 shares, and the issue is a 100% offer for sale worth about ₹2,533.66 crore at the cap price. The company receives none of the money, because every share is sold by its parent, Bonfiglioli S.p.A.

    This review covers the issue details, what a retail application costs, the business, the financials, the P/E worked out at the price band, a peer comparison, where the money goes, the main risks and how to apply.

    Bonfiglioli Transmissions IPO Key Details

    Parameter Details
    IPO Dates 15 October 2026 to 19 October 2026
    Anchor Book 14 October 2026
    Face Value ₹10 per share
    Price Band ₹558 to ₹586 per share
    Lot Size 25 shares (minimum ₹14,650 at the cap price)
    Issue Type Book-built, 100% offer for sale
    Total Issue Size 4,32,39,042 shares, about ₹2,533.66 crore at the cap price
    Fresh Issue Nil
    Offer for Sale 4,32,39,042 shares by Bonfiglioli S.p.A.
    Employee Reservation 50,000 shares at ₹29 per share discount to the final offer price
    Listing Exchanges BSE and NSE
    Allotment Date 21 October 2026
    Refund and Credit to Demat 22 October 2026
    Listing Date 23 October 2026 (tentative)
    Registrar MUFG Intime India Private Limited
    Book Running Lead Managers Axis Capital, BNP Paribas, ICICI Securities, Jefferies India


    Business details come from the Draft Red Herring Prospectus (DRHP) dated 9 February 2026. The price band, dates and final offer size come from the company’s announcement as reported by Business Today on 12 October 2026.

    How the offer is split

    The offer is made under Regulation 6(1) of the SEBI ICDR Regulations. The percentages below apply to the net offer after the employee reservation.

    Category Share of net offer
    Qualified Institutional Buyers (QIB) Not more than 50%
    Non-Institutional Investors (NII) Not less than 15%
    Retail Individual Investors (RII) Not less than 35%


    Within the NII portion, one-third is for bids above ₹2,00,000 and up to ₹10,00,000, and two-thirds is for bids above ₹10,00,000.

    What a Retail Application Actually Costs

    • One lot is 25 shares. That is ₹13,950 at the floor price and ₹14,650 at the cap price.
    • Your bank blocks the amount at the cap price, so ₹14,650 is the minimum to keep aside for one lot.
    • SEBI caps a retail application at ₹2,00,000. At the cap price, 13 lots (325 shares) fit under that limit. That is ₹1,90,450.
    • A 14th lot takes the application to ₹2,05,100. That moves it into the small non-institutional (sHNI) category, which has its own allotment rules.

    About Bonfiglioli Transmissions

    The company was incorporated on 23 June 1998 as Bonfiglioli Deepak Private Limited and became a public company in September 2025. Its registered and corporate office is in Thirumudivakkam, Kancheepuram, Tamil Nadu. It makes gearboxes, gear motors and drive systems, the machinery parts that turn a motor’s fast spin into slow, powerful movement. Its customers are makers of industrial machines, construction equipment and wind turbines.

    Bonfiglioli S.p.A. of Italy owns 100% before the IPO. After selling 4,32,39,042 shares, it will hold about 77.00% of the 18,79,95,834 shares outstanding. This is my calculation from the DRHP and the final offer size.

    • Three business verticals. In CY 2024, Industry and Automation Solutions made up 41.56% of revenue from operations, Wind 32.16%, Off-Highway Mobility 23.38% and others 2.90%.
    • Wind depends on one product line. Yaw and pitch drives for wind turbines brought in 32.16% of CY 2024 revenue. Named wind customers include Suzlon, Nordex and Senvion.
    • Named customers elsewhere. These include JCB India, CNH Industrial and Hyundai Construction Equipment (Off-Highway Mobility), and GMM Pfaudler and Terex India (Industry and Automation).
    • Dealer network. There were 44 dealers at 30 September 2025. Of these, 36 sell on an exclusive basis and 16 have worked with the company for 20 years or more.
    • Three plants. They are at Thirumudivakkam and Mannur in Tamil Nadu and Talegaon in Maharashtra. Aggregate capacity utilisation rose from 63.67% in CY 2022 to 74.74% in the nine months to 30 September 2025.
    • Domestic and export mix. Customers in India gave 74.73% of CY 2024 revenue. The rest came from outside India.
    • Sales to group companies. Inter-company sales, mostly drives sold to related parties, were 15.42% of CY 2024 revenue from operations.

    Financial Performance

    The company’s year runs from 1 January to 31 December, so the table uses calendar years (CY). All figures are restated, for continuing operations, in ₹ crore, from the DRHP.

    Particulars CY 2022 CY 2023 CY 2024 9 months to 30 Sep 2025
    Revenue from operations 1,558.80 1,687.51 1,864.08 1,460.17
    Revenue growth Base year 8.26% 10.46% Not comparable
    EBITDA (excluding other income) 254.44 244.12 293.06 253.48
    EBITDA margin 16.32% 14.47% 15.72% 17.36%
    Profit after tax (PAT) 168.75 147.70 191.12 165.19
    PAT margin (on revenue from operations) 10.83% 8.75% 10.25% 11.31%
    Total equity 725.37 805.34 853.09 925.30
    Return on equity (average equity) 23.41% 19.30% 23.05% 18.58%
    Return on capital employed 27.04% 24.54% 30.28% 25.18%
    Net cash (cash and bank balances less borrowings and leases) 127.30 140.09 138.20 162.83


    Nine-month figures are not annualised. The DRHP calculates PAT margin on total income, so its figures differ slightly from the margins above, which use revenue from operations.

    Revenue grew about 9.35% a year between CY 2022 and CY 2024. PAT grew about 6.42% a year over the same two years, because CY 2023 was a weak year for profit. EBITDA margin has recovered from 14.47% to 17.36%.

    Working capital is where profit and cash can drift apart. The cash conversion cycle, the days between paying suppliers and collecting from customers, was steady at 81, 80, 79 and 79 days. But receivables rose 16.9% between 31 December 2024 and 30 September 2025, from ₹409.56 crore to ₹478.73 crore. Operating cash inflow in the nine months was ₹141.80 crore against PAT of ₹165.19 crore, about 86%.

    The company has no borrowings on its balance sheet at 30 September 2025. It has paid large dividends to its parent: ₹92.75 crore in the nine months to September 2025 and ₹68.93 crore in CY 2024.

    Newer numbers. The Red Herring Prospectus (RHP) carries later periods, which press and broker pages report as follows. For CY 2025, PAT was ₹237.87 crore. For the six months to 30 June 2026, revenue was ₹1,131.87 crore against ₹960.36 crore a year earlier, and PAT was ₹148.58 crore against ₹114.97 crore. Restated figures in the RHP can differ slightly from the DRHP.

    These are historical disclosures and do not indicate future performance.

    Valuation Metrics Explained

    Metric Value
    Basic and diluted EPS, CY 2022 ₹8.71
    Basic and diluted EPS, CY 2023 ₹7.62
    Basic and diluted EPS, CY 2024 ₹10.06
    Weighted average EPS (weights 1, 2, 3) ₹9.02
    Basic EPS, CY 2025 (RHP, as reported) ₹12.65
    Return on net worth, CY 2024 22.40%
    Weighted average return on net worth 21.19%
    Return on net worth, CY 2025 (RHP, as reported) 23.96%
    NAV per share, 30 June 2026 (RHP, as reported) ₹55.02
    Market capitalisation at the cap price ₹11,016.56 crore


    EPS and NAV in the DRHP are adjusted for the 1-for-2 bonus issue allotted on 25 January 2026. The DRHP bases return on net worth on year-end net worth, which is different from return on equity above.

    The formulas in plain words

    • EPS is profit after tax divided by the number of shares.
    • P/E is the share price divided by EPS. It shows how many rupees you pay for each rupee of yearly profit.
    • RoNW is profit divided by net worth, as a percentage.
    • NAV per share is net worth divided by the number of shares.

    Working out the P/E

    The DRHP leaves the P/E blank because the price band was fixed after filing. Using CY 2025 EPS of ₹12.65, the working is below.

    Measure At floor ₹558 At cap ₹586
    P/E on CY 2025 EPS 44.11x 46.32x
    P/E on CY 2024 EPS (₹10.06) 55.47x 58.25x
    Price to book on NAV of ₹52.82 (31 Dec 2025) 10.56x 11.09x

    The post-issue P/E is the same as the pre-issue P/E. This is a pure offer for sale, so no new shares are created and EPS does not fall. The shares only change owner. At the cap price, the market value of the company is ₹11,016.56 crore (18,79,95,834 shares times ₹586).

    How that compares with listed peers

    The table uses the RHP’s peer comparison, as reported by Chittorgarh and IPO Premium. Bonfiglioli’s P/E is at the cap price. Peer figures are for the year ended 31 March 2026, or 31 December 2025 for Schaeffler India.

    Company EPS, basic (₹) NAV per share (₹) P/E (x) RoNW (%)
    Bonfiglioli Transmissions 12.65 52.82 46.32 23.96
    Elecon Engineering 15.20 102.65 31.63 14.81
    Shanthi Gears 9.99 57.36 63.39 17.42
    Schaeffler India 73.60 386.94 53.74 19.02
    Timken India 55.16 403.31 57.66 13.68


    The four peers range from 31.63x to 63.39x, with an average of about 51.6x by my calculation. The DRHP showed an average of 44.66x on 31 December 2025 prices, so the peer set has become more expensive since filing.

    At 46.32x, Bonfiglioli sits below that average, and its RoNW of 23.96% is higher than every listed peer. The other side: Elecon, the closest peer in gearboxes, trades at 31.63x and earned a higher EBITDA margin (24.36% in the year to March 2025, against 15.72% for Bonfiglioli in CY 2024, per the DRHP). Peer years also differ from Bonfiglioli’s calendar year, and Schaeffler and Timken make bearings and other products as well.

    These ratios are shared for educational understanding, not as investment guidance.

    Objects of the Issue

    None of the money reaches the company. The whole offer is a sale by Bonfiglioli S.p.A., which receives the proceeds after offer expenses and taxes. The DRHP states that the objects are to carry out the offer for sale and to list the shares on BSE and NSE. The company expects listing to improve visibility and provide liquidity.

    Object Amount
    Fresh issue to the company Nil
    Offer for sale by Bonfiglioli S.p.A. About ₹2,533.66 crore at the cap price
    Debt repayment, capex or general corporate purposes Not applicable, as the company raises no money


    Because the company receives no proceeds, it does not need a monitoring agency. Bonfiglioli S.p.A. bears most offer expenses, apart from items such as listing fees and normal corporate advertising. The company reports no borrowings at 30 September 2025. A credit rating is Not disclosed in the DRHP sections reviewed.

    Strengths and Risk Factors

    Strengths Risks
    Revenue grew from ₹1,558.80 crore in CY 2022 to ₹1,864.08 crore in CY 2024, about 9.35% a year Top 10 customers rose from 39.81% of revenue in CY 2022 to 46.35% in the nine months to September 2025
    No borrowings and net cash of ₹162.83 crore at 30 September 2025 The licence to make most products and use the Bonfiglioli brand comes from Bonfiglioli S.p.A. for 6% of annual sales of those products, renews yearly and can be ended by either side with notice
    Capacity utilisation rose from 63.67% in CY 2022 to 74.74% in the nine months to September 2025 Yaw and pitch drives for wind turbines were 32.16% of CY 2024 revenue
    44 dealers, of which 36 are exclusive and 16 have 20 years or more with the company Top 10 suppliers were 41.92% of purchases, the largest is a related party at 14.99%, and there are no long-term supply agreements
    Return on capital employed of 30.28% in CY 2024 Raw materials and components were 63.08% of revenue in the nine months to September 2025, and 28.67% of purchases came from outside India
    Cash conversion cycle steady at 79 to 81 days over four periods Seven tax proceedings against the company involve ₹6.77 crore, and industry data comes from a report the company commissioned


    This table is a summary, not a substitute. Read the full Risk Factors section of the RHP, which begins on page 30 in the DRHP, and note that page numbers can differ in the RHP.

    How to Apply for the IPO via Findoc

    1. Log in to your Findoc account.
    2. Open the IPO section and select Bonfiglioli Transmissions.
    3. Enter your UPI ID and the quantity, in multiples of 25 shares.
    4. Place your bid within the ₹558 to ₹586 band, or choose the cut-off price.
    5. Approve the UPI mandate request on your UPI app before 5:00 PM IST on 19 October 2026.

    You can also apply through your bank’s ASBA facility. If you do not yet have a demat account, open one demat account before bidding closes on 19 October 2026.

    Checking Your Allotment

    Allotment is expected on 21 October 2026. You can check the status on the registrar’s website (MUFG Intime India), on BSE or on NSE. Keep your application number, PAN or demat account details ready. Refunds for unallotted bids and credit of shares to demat accounts are expected on 22 October 2026, ahead of the 23 October 2026 listing.

    Key Takeaways

    • The issue is a 100% offer for sale of 4,32,39,042 shares worth about ₹2,533.66 crore at the cap price, so the company gets no funds.
    • The price band is ₹558 to ₹586, the lot is 25 shares, and the maximum retail application is 13 lots, or ₹1,90,450.
    • Bidding runs from 15 October 2026 to 19 October 2026, with allotment on 21 October 2026 and listing on 23 October 2026 (tentative).
    • Revenue grew about 9.35% a year between CY 2022 and CY 2024, with no borrowings and net cash on the balance sheet.
    • The P/E is 46.32x at the cap price on CY 2025 earnings, against a peer average of about 51.6x, and RoNW is higher than all four listed peers.
    • Key risks are customer concentration, dependence on the parent’s licence and brand, wind-turbine exposure and supplier concentration.

    Investments in securities are subject to market risks. This is not investment advice; please read all related documents carefully before investing.

    Related Stock Market Insights

    Explore Trending Indices
    Bank Nifty Nifty Commodities
    BSE 100 BSE BANKEX
    BSE SENSEX BSE MIDCAP
    Nifty IT Nifty 100
    FINNIFTY Nifty Pharma
  • Zetwerk IPO Review: Price Band, Dates, Lot Size and Financials

    Zetwerk IPO Review: Price Band, Dates, Lot Size and Financials

    Zetwerk Manufacturing Businesses Ltd is raising up to ₹5,012.33 crore through a book-built IPO that opens on 15 October 2026 and closes on 19 October 2026. The price band is ₹143 to ₹151 per share, the lot size is 99 shares, and the minimum retail investment is ₹14,949 at the cap price. This review covers the issue details, financials, use of proceeds, valuation context, risks and how to apply.

    Zetwerk IPO Key Details

    Parameter Details
    IPO Dates 15 October 2026 to 19 October 2026
    Anchor Book 14 October 2026
    Face Value ₹1 per equity share
    Price Band ₹143 to ₹151 per share
    Lot Size 99 shares (minimum ₹14,949 at the cap price)
    Issue Type Book-built, fresh issue and offer for sale
    Total Issue Size Up to ₹5,012.33 crore (at the cap price)
    Fresh Issue Up to ₹2,830 crore
    Offer for Sale Up to 14,45,25,036 equity shares (about ₹2,182.33 crore at the cap price)
    Listing Exchanges BSE and NSE (NSE is the designated stock exchange)
    Allotment Date 21 October 2026 (tentative)
    Credit to Demat 22 October 2026 (tentative)
    Listing Date 23 October 2026 (tentative)
    Registrar KFin Technologies Limited
    Book Running Lead Managers Kotak Mahindra Capital, Morgan Stanley India, Goldman Sachs (India) Securities, Avendus Capital, JM Financial, HSBC Securities and Capital Markets (India), Pantomath Capital Advisors


    Reservation Split

    The offer is made under Regulation 6(2) of the SEBI ICDR Regulations, because the company does not meet the conditions of Regulation 6(1)(b). This is the route for companies that have not yet met the profitability track record, and under it a large share of the issue goes to institutions.

    Category Allocation
    Qualified Institutional Buyers (QIB) Not less than 75% of the net offer
    Non-Institutional Investors (NII) Not more than 15% of the net offer
    Retail Individual Investors (RII) Not more than 10% of the net offer
    Eligible employees 7,00,000 shares, at a discount of ₹14 per share


    What a Retail Application Actually Costs

    • One lot of 99 shares costs ₹14,157 at the floor price of ₹143 and ₹14,949 at the cap price of ₹151.
    • Your bank blocks funds at the cap price, even if you bid lower in the band.
    • The maximum retail application is 13 lots, which is 1,287 shares and ₹1,94,337 at the cap price.
    • A 14th lot would take the application to ₹2,09,286. That is above the ₹2 lakh retail limit, so it moves you into the small non-institutional category.

    About Zetwerk Manufacturing Businesses

    Zetwerk describes itself as a technology-led, asset-light manufacturing platform for industrial and consumer goods. It combines manufacturing capacity from third-party suppliers and its own facilities into what it calls a “universal factory”, run through its own software called Zetwerk OS. The company was incorporated in 2017 and has its registered office at #84/1, Vaishnavi Sovereign, Green Glen Layout, Bellandur, Bengaluru 560103. The promoters are Amrit Pratik Acharya (Managing Director and CEO) and Srinath Ramakkrushnan (Chief Operating Officer).

    • Two segments. Manufacturing Business (Energy, Precision and Capital Goods products) made up 58.91% of FY 2025-26 revenue. The Ecosystem Business (Terra91), which buys industrial commodities and supplies them to customers as a principal, made up 41.09%.
    • Mix is shifting. In the April to June 2026 quarter, the Ecosystem Business was 53.81% of revenue, higher than the Manufacturing Business at 46.19%.
    • Energy dominates manufacturing. Energy Products brought in ₹6,507.57 crore in FY 2025-26, about 69% of manufacturing segment revenue.
    • Scale of operations. 26 own manufacturing facilities across India, Spain, Germany and the USA, plus 6,979 third-party suppliers across 26 countries.
    • Named customers. Siemens Gamesa, Acer India, boAt, CG Power, NTPC Renewable Energy, Indian Oil Corporation, National Aluminium Company, Nordex Acciona, DRDO (LRDE) and the Indian Air Force are among those the company lists.
    • Geography. India contributed 82.54% of FY 2025-26 revenue and the USA 14.33%.

    Financial Performance

    Restated consolidated figures, converted from the RHP’s ₹ million to ₹ crore. Revenue, margins, EBITDA and the continuing-operations loss relate to continuing operations.

    Particulars (₹ crore) FY 2023-24 FY 2024-25 FY 2025-26 Q1 FY 2026-27 (Apr to Jun 2026)
    Revenue from operations 12,364.37 11,331.86 15,913.32 4,117.88
    Revenue growth Not disclosed in the RHP (8.35%) 40.43% 55.42% (against Q1 FY 2025-26)
    Gross margin 7.66% 12.06% 12.13% 12.05%
    Adjusted EBITDA 97.03 322.59 421.34 103.16
    Adjusted EBITDA margin 0.78% 2.85% 2.65% 2.51%
    EBITDA (restated) (293.54) 293.33 (353.53) 141.22
    Loss from continuing operations (852.53) (215.07) (964.39) (64.13)
    Total restated loss (917.95) (370.71) (1,606.17) (732.98)
    Net worth 4,065.31 4,418.59 4,691.21 3,959.69
    Total borrowings 1,232.10 1,746.55 1,936.16 1,942.19


    Revenue grew at about 13.45% a year between FY 2023-24 and FY 2025-26 (two years of growth, so the calculation uses a two-year period). Adjusted EBITDA has been positive for three years, but it excludes items such as share-based payments and exceptional items. Regular EBITDA and net profit are still negative for the full years, so read the two measures side by side.

    The “total restated loss” is larger than the “loss from continuing operations” in every period. The gap relates to discontinued operations, which the abridged prospectus does not break down. The full RHP explains them.

    Cash flow tells a separate story. Net cash used in operating activities was ₹281.54 crore in FY 2023-24, ₹386.28 crore in FY 2024-25 and ₹681.53 crore in FY 2025-26. Financing inflows of ₹1,789.31 crore in FY 2025-26 covered the gap. Growth so far has needed outside funding, which is why the debt repayment object matters.

    These are historical disclosures and do not indicate future performance.

    Valuation Metrics Explained

    Metric FY 2023-24 FY 2024-25 FY 2025-26 Q1 FY 2026-27 (not annualised)
    EPS, basic and diluted, continuing operations (₹) (4.86) (1.17) (6.69) (0.45)
    Return on Net Worth (RoNW) (21.00%) (4.76%) (21.11%) (1.74%)
    Net Asset Value per share (₹) 22.77 23.81 31.26 25.85


    The basics, in plain words

    • EPS = profit after tax divided by the number of shares. A negative EPS means a loss per share.
    • P/E = share price divided by EPS. It tells you how many rupees you pay for each rupee of yearly profit.
    • RoNW = profit divided by net worth. It shows how much profit the company earns on shareholders’ money.
    • NAV per share = net worth divided by the number of shares.

    Working out the Valuation

    The RHP leaves the price-dependent fields blank because the price band was fixed after filing. Here is what can be worked out at ₹151.

    • P/E: Not meaningful. EPS is negative in all four periods shown, so a P/E ratio cannot be calculated at either ₹143 or ₹151. A negative P/E should not be read as cheap.
    • Price to book: ₹151 divided by the FY 2025-26 NAV of ₹31.26 gives about 4.83 times. On the 30 June 2026 NAV of ₹25.85, it is about 5.84 times.
    • Market capitalisation: About ₹25,583 crore at the cap price, as stated in the company’s filing and reported by the press. Counting every fully diluted pre-offer share (153.77 crore) plus the fresh-issue shares gives about ₹26,049 crore. The difference is the way unvested options and similar items are counted.
    • Price to sales: ₹25,583 crore divided by FY 2025-26 revenue of ₹15,913.32 crore is about 1.61 times.

    How that Compares With Listed Peers

    The RHP states that there are no listed companies in India or globally that are comparable to Zetwerk in business and scale, so it does not provide a peer comparison of its KPIs. A fair comparison therefore needs your own judgement about which companies to use. The full “Basis for Offer Price” section of the RHP (page 248) has the details.

    What the numbers say, without a verdict: the company is valued at roughly 1.6 times revenue while reporting losses and a thin adjusted EBITDA margin of about 2.65%. Supporters point to the 40.43% revenue growth and a manufacturing order book of ₹13,062.40 crore. Sceptics point to the continuing losses and negative operating cash flow.

    These ratios are shared for educational understanding, not as investment guidance.

    Objects of the Issue

    Only the fresh issue of ₹2,830 crore goes to the company. The offer for sale of 14,45,25,036 shares (about ₹2,182.33 crore at the cap price) goes to the selling shareholders, not to Zetwerk. The fresh issue is about 56% of the total issue size.

    Object Amount from net proceeds (₹ crore)
    Repay or prepay borrowings of the company 1,300.00
    Repay or prepay borrowings of nine subsidiaries, through investments in them 860.00
    Unidentified acquisitions, other strategic acquisitions and general corporate purposes Balance, shown as [●] in the RHP
    Total [●]


    Both debt repayment amounts are planned for FY 2026-27. Together they come to ₹2,160 crore, which is about 76% of the fresh issue. The subsidiaries named are Sharp Tanks and Structurals, Terra91 International, Smile Electronics, Kryfs Power Components, Kryfs Transformers, Unimacts Global LLC, Zetwerk Manufacturing SG Pte. Ltd., Zap91 Solar India and Zet Town India.

    The RHP caps the spend on general corporate purposes and unidentified acquisitions together at 35% of the gross proceeds (₹990.50 crore on ₹2,830 crore), and each one individually at 25% (₹707.50 crore). Money for unidentified acquisitions is the least visible use of your capital, since the targets are not named.

    The abridged prospectus does not give the lender list, interest rates or the borrowing balance as on a recent date for the debt being repaid. Read “Objects of the Offer” on page 201 of the RHP for those details. It also does not disclose a credit rating.

    Strengths and Risk Factors

    Strengths Risks
    Revenue rose 40.43% to ₹15,913.32 crore in FY 2025-26 Loss from continuing operations of ₹964.39 crore in FY 2025-26, and losses in all three years
    Manufacturing order book of ₹13,062.40 crore at 30 June 2026, up about 53% from ₹8,534.70 crore a year earlier Top 10 customers were 35.90% of FY 2025-26 revenue, up from 22.37% in FY 2023-24
    Manufacturing segment EBITDA of ₹565.09 crore in FY 2025-26, a 6.03% margin Top 10 suppliers were 38.18% of total expenses in FY 2025-26
    26 own facilities and 6,979 third-party suppliers across 26 countries Net cash used in operations: ₹681.53 crore in FY 2025-26, the third year in a row of outflow
    Gross margin improved from 7.66% to 12.13% between FY 2023-24 and FY 2025-26 India is 82.54% and the USA 14.33% of revenue, so demand shifts in either market matter
    Adjusted EBITDA positive for three years, at ₹421.34 crore in FY 2025-26 The company says it has no firm long-term purchase commitments with many customers
    Customers across renewables, defence, aerospace, AI infrastructure and oil and gas Auditors included emphasis of matter and modifications under “Report on Other Legal and Regulatory Requirements” in all periods (no qualification to the financials)
    Positive revenue momentum in Q1 FY 2026-27: 55.42% growth 5 criminal, 30 tax and 12 statutory or regulatory proceedings against the company, plus 1 material civil case


    How to Apply for the Zetwerk IPO via Findoc

    1. Log in to your Findoc account.
    2. Open the IPO section and select Zetwerk Manufacturing Businesses Ltd.
    3. Enter your UPI ID and the quantity in multiples of 99 shares.
    4. Bid at a price within ₹143 to ₹151, or at the cut-off price.
    5. Approve the UPI mandate request on your UPI app before 5:00 PM on 19 October 2026.

    You can also apply through your bank’s ASBA facility. If you do not have a demat account yet, open a demat account before the issue closes on 19 October 2026.

    Checking Your Zetwerk IPO Allotment

    The basis of allotment is expected on 21 October 2026. Check on the KFin Technologies website (the registrar), on BSE or on NSE using your PAN, application number or DP ID and client ID. Refunds and the credit of shares to demat accounts are tentatively scheduled for 22 October 2026, with listing on 23 October 2026.

    Key Takeaways

    • The issue is up to ₹5,012.33 crore: a ₹2,830 crore fresh issue and an offer for sale of 14,45,25,036 shares.
    • The price band is ₹143 to ₹151, the lot is 99 shares, and a retail investor can apply for a maximum of 13 lots (₹1,94,337).
    • Bidding runs from 15 October to 19 October 2026, with listing tentatively on 23 October 2026.
    • FY 2025-26 revenue was ₹15,913.32 crore, up 40.43%, but the company reported a ₹964.39 crore loss from continuing operations.
    • P/E cannot be calculated as earnings are negative. Price to book is about 4.83 times at the cap price.
    • About 76% of the fresh issue goes to repaying debt. Customer concentration, losses and negative operating cash flow are the main risks.

    Investments in securities are subject to market risks. This is not investment advice; please read all related documents carefully before investing.

    Related Stock Market Insights

    Explore More Trending Stocks
    Adani Enterprises Share Price TVS Motor Company Share Price
    Yes Bank Share Price HDFC Bank Share Price
    Hindustan Unilever Share Price Kotak Mahindra Bank Share Price
    State Bank Of India Share Price ONGC Share Price
    Tata Motors Share Price Tata Steel Share Price
  • HD Fire Protect IPO Review: Price Band, Dates, Lot Size and Financials

    HD Fire Protect IPO Review: Price Band, Dates, Lot Size and Financials

    HD Fire Protect Limited’s IPO opens on 13 October 2026 and closes on 15 October 2026. The price band is ₹258 to ₹271 per share, the lot size is 55 shares, and the issue is a pure offer for sale of up to 2,62,84,500 equity shares worth about ₹678 crore to ₹712 crore. This page covers the issue details, three years of financials, how the P/E works out, who gets the money and the main risks, based on the Red Herring Prospectus (RHP) dated 5 October 2026.

    HD Fire Protect IPO Key Details

    Parameter Details
    IPO Dates 13 October 2026 to 15 October 2026
    Anchor Book 12 October 2026
    Face Value ₹5 per equity share
    Price Band ₹258 to ₹271 per share
    Lot Size 55 shares (minimum ₹14,905 at the cap price)
    Issue Type Book-built, offer for sale only
    Total Issue Size Up to 2,62,84,500 equity shares, about ₹678 crore to ₹712 crore across the price band
    Fresh Issue Not applicable
    Offer for Sale Up to 2,62,84,500 equity shares by two promoters
    Listing Exchanges BSE and NSE (BSE is the designated exchange)
    Allotment Date 16 October 2026 (tentative)
    Credit to Demat 19 October 2026 (tentative)
    Listing Date 21 October 2026 (tentative)
    Registrar MUFG Intime India Private Limited (formerly Link Intime India Private Limited)
    Book Running Lead Managers Ambit Private Limited, Anand Rathi Advisors Limited, IIFL Capital Services Limited


    The anchor and bidding dates are from the RHP. The price band and lot size are from the company’s announcement, confirmed on several broker and media pages. Allotment, credit and listing dates are tentative and come from secondary sources, so they may change.

    How the Issue Is Divided

    The offer is made under Regulation 6(1) of the SEBI ICDR Regulations, 2018. Of the net offer, reported splits are:

    Category Share of net offer
    Qualified Institutional Buyers (QIB) Not more than 50%
    Non-Institutional Investors (NII) Not less than 15%
    Retail Individual Investors (RII) Not less than 35%


    A small portion is also reserved for eligible employees. It is reported at up to ₹1.75 crore, with a discount of ₹25 per share to the offer price. The abridged prospectus does not state these employee terms, so please confirm them in the RHP.

    What a Retail Application Costs

    • One lot is 55 shares. It costs ₹14,190 at the floor price and ₹14,905 at the cap price.
    • Your bank blocks funds at the cap price, even if the final price is lower.
    • The maximum retail application is 13 lots, which is 715 shares and ₹1,93,765 at the cap price.
    • A 14th lot would cost ₹2,08,670. That is above the ₹2,00,000 retail limit, so the application would move to the small non-institutional category.

    About HD Fire Protect

    HD Fire Protect Limited (CIN U29270MH1997PLC107536) is an Indian maker of fire protection equipment and systems. It sells water, foam and gas-based fire suppression products to industrial buyers (oil and gas, power, pharma, data centres) and to commercial and residential buyers. Its registered office is in Mulund West, Mumbai, and its corporate office is in Wagle Estate, Thane.

    • Revenue comes from many product lines. In FY 2025-26, sprinklers, alarm valves and accessories were 33.95%, deluge valves and pre-action systems 21.85%, and foam equipment 18.71%.
    • Gas suppression systems brought in ₹4.90 crore in FY 2024-25 and nothing in FY 2025-26.
    • India gave 65.31% of FY 2025-26 revenue and exports 34.69%. The Middle East was the largest export region at 14.98%.
    • The company served 2,066 customers in FY 2025-26 and has supplied to over 90 countries since inception.
    • It runs two plants, at Jalgaon and Thane in Maharashtra, covering 8.50 acres. A warehouse at Wagle Estate, Thane, is expected by November 2026.
    • According to CRISIL, it was India’s second-largest fire protection equipment maker by revenue and the largest exporter by value in FY 2024-25. CRISIL puts India’s fire protection equipment market at ₹10,900 crore in FY 2025-26, growing 10% to 12% a year to ₹17,500 crore to ₹19,500 crore by FY 2030-31.

    Financial Performance (Restated)

    Particulars (₹ crore) Q1 FY 2026-27 (3 months, not annualised) FY 2025-26 FY 2024-25 FY 2023-24
    Revenue from Operations 109.05 489.28 432.80 372.95
    Operating EBITDA 29.73 150.46 138.01 106.63
    Operating EBITDA Margin 27.26% 30.75% 31.89% 28.59%
    Profit After Tax (PAT) 23.87 116.79 109.72 87.92
    PAT Margin (on total income, as the RHP defines it) 20.92% 23.12% 24.35% 22.43%
    Net Worth 401.02 377.15 397.23 343.41
    Total Borrowings Nil Nil Nil Nil
    Return on Net Worth 5.95% 30.97% 27.62% 25.60%
    Return on Equity 6.13% 30.17% 29.63% 28.41%
    Return on Capital Employed 8.36% 40.33% 39.63% 37.61%
    Net Cash from Operating Activities 47.20 92.49 98.31 63.77


    Over two years, revenue grew at about 14.5% a year, operating EBITDA at about 18.8% and PAT at about 15.3% (our calculations). The recent pace is slower. FY 2025-26 revenue grew 13.1% against 16.0% a year earlier, and PAT grew only 6.4% against 24.8%. The company has no borrowings in any period shown.

    Working capital is the part to watch. Inventory days were 85 in FY 2025-26 against 77 a year earlier. Receivable days rose from 45 to 57. The cash conversion cycle lengthened from 83 days to 102 days. Operating cash flow was ₹92.49 crore against PAT of ₹116.79 crore, so profit is converting to cash at a lower rate than before. The June 2026 quarter shows inventory days of 109 and a cash conversion cycle of 112 days, though those use a different formula for a short period.

    Net worth fell to ₹377.15 crore on 31 March 2026 from ₹397.23 crore a year earlier despite the profit. The summary does not explain why. These are historical disclosures and do not indicate future performance.

    Valuation Metrics Explained

    Metric FY 2025-26 FY 2024-25 FY 2023-24
    Basic EPS ₹6.66 ₹6.26 ₹5.01
    Diluted EPS ₹6.66 ₹6.26 ₹5.01
    Net Asset Value per Share ₹21.45 ₹22.59 ₹19.49
    Return on Net Worth 30.97% 27.62% 25.60%


    Weighted average EPS and weighted average RoNW are Not disclosed in the abridged prospectus.

    The formulas, in plain words

    • EPS is profit after tax divided by the number of shares. It is the profit earned per share.
    • P/E is the share price divided by EPS. It shows how many rupees you pay for each rupee of yearly profit.
    • RoNW is profit divided by net worth. It shows how much profit the company earns on shareholders’ money.
    • NAV is net worth divided by the number of shares. It is the book value behind each share.

    Working out the P/E

    The RHP leaves the price-dependent figures blank, because the price band was announced after it was filed. Here is how they work out, using FY 2025-26 diluted EPS of ₹6.66 and NAV of ₹21.45:

    Measure At ₹258 (floor) At ₹271 (cap)
    P/E 38.7 40.7
    Price to book value 12.0 12.6
    Market cap (17,52,30,000 shares) ₹4,521 crore ₹4,749 crore


    Because this is an offer for sale, no new shares are created. The share count and EPS stay the same after the issue, so the post-issue P/E equals the P/E above. Only the owners change.

    How that compares with listed peers

    IPO Watch and IPOji report the following peer figures from the RHP. Peer prices are closing prices on 30 September 2026. We have not seen the RHP’s own peer table, so please check it before relying on these.

    Company Diluted EPS P/E RoNW NAV
    HD Fire Protect (at ₹271) ₹6.66 40.7 30.97% ₹21.45
    Azad Engineering ₹20.57 145.65 8.74% ₹236.74
    KSB ₹15.54 55.68 16.11% ₹96.46
    Ingersoll-Rand (India) ₹81.10 51.39 20.36% ₹195.04
    Elgi Equipments ₹13.65 44.70 19.28% ₹70.41
    Kirloskar Pneumatic ₹39.45 17.18 20.36% ₹192.25


    The simple average of the five peer P/Es is about 62.9 and the middle value is 51.4 (our calculations). At the cap price, HD Fire Protect’s 40.7 sits below both, and its return on net worth is higher than any peer shown. Against that, the average is pulled up by Azad Engineering at 145.65, only Kirloskar Pneumatic is cheaper on P/E, and HD Fire Protect’s profit growth slowed to 6.4% in FY 2025-26. A lower P/E also does not by itself make a share cheap, because the peers differ in size and business mix.

    These ratios are shared for educational understanding, not as investment guidance.

    Objects of the Issue

    The company receives nothing from this IPO. The whole offer is a sale by two promoters, and the proceeds, after offer expenses and taxes, go to them in proportion to the shares they sell. The stated objects are to carry out the sale and to get the benefits of listing.

    Selling shareholder Shares offered Amount at ₹258 Amount at ₹271 Weighted average cost per share
    Harish Narshi Dharamshi Up to 89,83,700 ₹231.78 crore ₹243.46 crore ₹0.05
    Kusum Harish Dharamshi Up to 1,73,00,800 ₹446.36 crore ₹468.85 crore ₹0.09


    Amounts are before offer expenses and taxes. The promoters’ holding falls from 95.33% to about 80.32% after the sale (our calculation, assuming the offer is fully subscribed). The offer is 15.00% of post-offer capital. The company has no debt, so there is no repayment object. The expansion at Jalgaon and Thane is not funded from this issue. No credit rating is disclosed in the abridged prospectus.

    Strengths and Risk Factors

    Strengths Risks
    Return on capital employed of 40.33% in FY 2025-26 The issue is a 100% offer for sale, so the company gets no funds
    Zero borrowings in all periods shown PAT growth slowed to 6.4% in FY 2025-26 from 24.8%
    Operating EBITDA margin of 30.75% in FY 2025-26 Cash conversion cycle lengthened from 83 days to 102 days in a year
    2,066 customers in FY 2025-26, across several end industries Top 10 suppliers were 47.76% of total expenses, with no long-term supply contracts
    Exports were 34.69% of revenue, with 90+ countries served since inception The two Maharashtra plants gave 63.49% of FY 2025-26 revenue, so one region carries concentration risk
    Revenue rose from ₹372.95 crore to ₹489.28 crore in two years A joint statutory auditor resigned before finishing the term and was later appointed CFO


    Other disclosed risks include product failure leading to claims, regulatory certifications, under-use of capacity, and customer payment delays. Two criminal proceedings are pending against directors. No proceedings are pending against the company itself. The company has filed three tax cases worth ₹0.04 crore.

    How to Apply via Findoc

    1. Log in to your Findoc account.
    2. Open the IPO section and select the HD Fire Protect IPO issue.
    3. Enter your UPI ID and the number of lots. Quantity must be in multiples of 55 shares.
    4. Place your bid within ₹258 to ₹271.
    5. Approve the UPI mandate on your UPI app. The mandate end time is 5:00 PM IST on 15 October 2026.

    You can also apply through your bank’s ASBA facility. If you do not have a demat account, open a demat account before bidding closes on 15 October 2026.

    Checking Your Allotment

    Allotment is tentatively on 16 October 2026. Check the status on the website of MUFG Intime India Private Limited, or on the BSE and NSE allotment pages. You will need your application number, PAN or demat details. Refunds and demat credit are tentatively on 19 October 2026.

    Key Takeaways

    • The IPO opens on 13 October 2026 and closes on 15 October 2026. The price band is ₹258 to ₹271 and the lot size is 55 shares.
    • It is a pure offer for sale of up to 2,62,84,500 shares by two promoters. The company gets no money.
    • Revenue was ₹489.28 crore and PAT ₹116.79 crore in FY 2025-26, with no borrowings.
    • P/E at the cap price is about 40.7 on FY 2025-26 EPS, against a peer average of about 62.9 and a middle value of 51.4.
    • The maximum retail bid is 13 lots, or ₹1,93,765 at the cap price.
    • Key risks are slowing profit growth, a longer cash cycle, supplier and regional concentration and no proceeds to the company.

    Investments in securities are subject to market risks. This is not investment advice; please read all related documents carefully before investing.

    Related Stock Market Insights

    Current Open IPOs
    Green Asia Impex Ltd. IPO Shah Investor’s Home Ltd. IPO
    Acme Universal Ltd. IPO Pind Hospitality Ltd. IPO
    Acme Universal Safezone 9 Ltd. IPO Shivchem Agro Ltd. IPO
    Shree TNB Polymers Ltd IPO Papadmalji Agro Foods Ltd. IPO
    Vans Electro Engineerings Ltd. IPO Black Opal Consultants Ltd. IPO
  • Jio Platforms IPO Review: Price Band, Dates, Lot Size and Financials

    Jio Platforms IPO Review: Price Band, Dates, Lot Size and Financials

    Jio Platforms Limited is planning a fresh issue of up to 27 crore equity shares of face value ₹10 each. The price band, lot size and bidding dates have not been officially announced yet, because the Red Herring Prospectus (RHP) has not been filed. This page covers the issue structure, three years of restated financials, how to work out the P/E once the price band is out, the use of proceeds and the key risks, all from the Draft Red Herring Prospectus (DRHP) dated 19 June 2026.

    Jio Platforms IPO Key Details

    Parameter Details
    IPO Dates Not officially announced. Media reports point to 21 October to 23 October 2026 (tentative)
    Anchor Book Not officially announced. One media report says 19 October 2026 (tentative)
    Face Value ₹10 per equity share
    Price Band Not yet announced. To be disclosed in the RHP
    Lot Size Not yet announced
    Issue Type Book-built, fresh issue only
    Total Issue Size Up to 27,00,00,000 (27 crore) equity shares. Rupee size depends on the price band
    Fresh Issue Up to 27,00,00,000 equity shares
    Offer for Sale Not applicable
    Listing Exchanges BSE and NSE
    Allotment Date Not officially announced. One media report says 26 October 2026 (tentative)
    Credit to Demat Not yet announced
    Listing Date Not officially announced. One media report says 28 October 2026 (tentative)
    Registrar KFin Technologies Limited
    Book Running Lead Managers Kotak Mahindra Capital, Morgan Stanley India, BofA Securities India, Axis Capital, BNP Paribas, Citigroup Global Markets India, CLSA India, DAM Capital, Goldman Sachs (India) Securities, HDFC Bank, HSBC Securities and Capital Markets (India), ICICI Securities, IIFL Capital Services, Jefferies India, JM Financial, J.P. Morgan India, SBI Capital Markets, UBS Securities India, 360 ONE WAM


    Issue structure, face value, registrar and lead managers are from the DRHP dated 19 June 2026. The dates are from media reports of 6 October and 8 October 2026, not from the company, and schedules often shift. This page will be updated when the RHP is filed.

    How the Issue Is Divided

    The issue is made under Regulation 6(1) of the SEBI ICDR Regulations, 2018. Shares are reserved for QIBs, NIIs, RIIs, Eligible Employees and Eligible RIL Shareholders. The percentage split is Not disclosed in the DRHP summary and will be confirmed from the RHP (the DRHP covers it under “Issue Structure” on page 467).

    What a Retail Application Will Cost

    Retail investors can bid up to ₹2,00,000 in one application. Once the lot size and price band are announced, the numbers work like this:

    • One lot costs lot size multiplied by the price.
    • Your bank blocks funds at the cap price, even if the final price is lower.
    • Maximum retail lots equal ₹2,00,000 divided by the value of one lot at the cap price, rounded down to a whole number.
    • One lot above that limit moves your application into the small non-institutional category.

    The exact figures will be added after the price band is announced.

    About Jio Platforms

    Jio Platforms Limited (CIN U72900GJ2019PLC110816) has its registered office in Ahmedabad, Gujarat, and its corporate office in Ghansoli, Navi Mumbai. Its promoter is Reliance Industries Limited (RIL). The company describes itself as a technology platform built on digital connectivity, offering mobile and fixed broadband, entertainment, cloud, smart home and AI-based products to consumers and businesses.

    • Its subsidiary Reliance Jio Infocomm Limited (RJIL) had 52.44 crore customers on 31 March 2026, up from 48.82 crore a year earlier.
    • RJIL added 3.62 crore customers in FY 2025-26, against 0.64 crore in FY 2024-25.
    • ARPU for the March 2026 quarter was ₹214.0 per month, up from ₹206.2 a year earlier.
    • Monthly data use per customer was 42.3 GB in the exit quarter, against 33.6 GB a year earlier.
    • Monthly churn for the exit quarter was 1.67%, against 1.81% a year earlier.
    • The company reports a single segment under Ind AS 108, so there is no revenue split by business line.
    • Promoter RIL holds 66.43% before the issue. Jaadhu Holdings (a Meta Platforms affiliate) holds 9.98% and Google International LLC holds 7.73%.

    Financial Performance (Restated Consolidated)

    Particulars (₹ crore) FY 2025-26 FY 2024-25 FY 2023-24
    Revenue from Operations 1,46,885 1,28,218 1,09,558
    EBITDA 76,255 64,170 54,959
    EBITDA Margin 51.91% 50.05% 50.16%
    EBIT 49,007 40,032 32,856
    Profit After Tax (PAT) 30,049 26,109 21,423
    PAT Margin 20.46% 20.36% 19.55%
    Net Worth 3,34,013 3,04,022 2,77,866
    Total Borrowings 70,781 73,060 54,349
    Net Leverage (Net Debt to EBITDA) 0.36x 0.71x 0.88x
    Return on Average Net Worth 9.42% 8.97% 8.02%
    Return on Average Capital Employed 10.76% 12.50% 12.83%
    Net Cash from Operating Activities 77,556 68,156 57,662
    EBITDA less Cash Capex 42,071 19,902 1,449


    Over two years, revenue grew at about 15.8% a year, EBITDA at about 17.8% and PAT at about 18.4%. These are our calculations from the table. Revenue growth slowed from 17.0% in FY 2024-25 to 14.6% in FY 2025-26, while PAT growth slowed from 21.9% to 15.1%. Margins, however, held steady or improved.

    The cash picture changed more sharply. EBITDA less cash capex rose from ₹1,449 crore to ₹42,071 crore in two years, and net leverage fell from 0.88x to 0.36x. Operating cash flow of ₹77,556 crore was about 2.6 times PAT, which is common in a business with heavy depreciation. Return on average capital employed, however, slipped from 12.83% to 10.76%, because the capital base grew faster than operating profit.

    These are historical disclosures and do not indicate future performance.

    Valuation Metrics Explained

    Metric FY 2025-26 FY 2024-25 FY 2023-24
    Basic EPS ₹33.63 ₹29.21 ₹23.96
    Diluted EPS ₹33.59 ₹29.17 ₹23.93
    Net Asset Value per Share ₹373.66 ₹340.11 ₹310.85
    Return on Average Net Worth 9.42% 8.97% 8.02%


    Weighted average EPS and RoNW are Not disclosed in the DRHP summary, and market cap at the cap price depends on the price band.

    The formulas, in plain words

    • EPS is profit after tax divided by the average number of shares. It shows the profit earned per share.
    • P/E is the share price divided by EPS. It shows how many rupees you pay for each rupee of yearly profit.
    • RoNW is profit divided by net worth. It shows how much profit the company earns on shareholders’ money.
    • NAV is net worth divided by the number of shares. It is the book value behind each share.

    Working out the P/E

    The DRHP does not show the share price yet. The company decides the price band only after the DRHP is filed, so every figure that depends on the price is still left blank in the document. Once the price band is announced, you can work these figures out yourself in a few steps. Here is how, using the numbers we already know:

    • P/E at floor and at cap: divide each price by the FY 2025-26 diluted EPS of ₹33.59. Every ₹100 of share price equals about 2.98 times earnings.
    • Post-issue P/E: the fresh issue adds 27 crore shares to the existing 893.90 crore, giving 920.90 crore shares after the issue (assuming full subscription). Post-issue EPS is ₹30,049 crore divided by 920.90 crore, about ₹32.63, so post-issue P/E is the price divided by ₹32.63.
    • Price to book: divide the price by the NAV of ₹373.66.
    • Market cap: price multiplied by 920.90 crore shares. Every ₹100 of price equals about ₹92,090 crore.
    • Fresh issue proceeds: every ₹100 of price equals about ₹2,700 crore on 27 crore shares.

    How that compares with listed peers

    The DRHP carries a comparison with listed industry peers under “Basis for Issue Price”, including KPI comparisons. That table is not in the document we worked from, so we have not reproduced it. The peer comparison will be added from the RHP.

    These ratios are shared for educational understanding, not as investment guidance.

    Objects of the Issue

    The issue is a fresh issue only, so the money raised goes to the company and not to selling shareholders. Net proceeds will be used for two purposes:

    Object Amount
    Prepayment, in full or in part, of certain borrowings of RJIL Not yet disclosed. Price dependent
    General corporate purposes Not yet disclosed. Price dependent


    Total fund-based borrowings of the company and its subsidiaries were ₹71,529 crore on 31 March 2026. Lender names, interest rates and the share of that debt to be repaid are Not disclosed in the DRHP summary. SEBI rules cap general corporate purposes, and any unidentified acquisitions, at 25% of gross proceeds in total, but the company’s own split is Not disclosed in the DRHP summary. No credit rating is disclosed there either.

    The company also expects to gain a public market for its shares and the other benefits of listing.

    Strengths and Risk Factors

    Strengths Risks
    RJIL served 52.44 crore customers on 31 March 2026 Total borrowings of ₹71,529 crore on 31 March 2026, with debt covenants needing consent for mergers and dividends
    EBITDA margin of 51.91% in FY 2025-26 Monthly churn of 1.67% in the March 2026 quarter
    Net leverage fell from 0.88x to 0.36x in two years RoCE fell from 12.83% to 10.76% in two years
    Data traffic rose from 14,850 crore GB to 24,140 crore GB over two years The “Jio” trademark is also used by other Reliance Group companies, which the company does not control
    Operating cash flow of ₹77,556 crore in FY 2025-26 Reliance on a limited group of passive infrastructure providers for towers and optic fibre
    Monthly data use per customer rose from 28.7 GB to 42.3 GB in two years Licences and spectrum must be renewed or won at auction, and a failure would hurt operations


    Other disclosed risks include dependence on related-party agreements with RIL and Reliance Retail, cybersecurity and data breaches, and extensive regulation by TRAI and the Department of Telecommunications.

    Litigation is large in rupee terms. Matters against RJIL and other subsidiaries total about ₹10,811 crore, including 200 tax proceedings. GST input tax credit disputes of ₹6,767 crore are not treated as contingent liabilities. Matters against the promoter RIL total about ₹40,311 crore plus US$4.13 billion.

    This table is a summary. The full list is in the “Risk Factors” section starting on page 29 of the DRHP.

    How to Apply via Findoc

    1. Log in to your Findoc account or open a demat account.
    2. Open the IPO section and select the Jio Platforms IPO issue once bidding opens.
    3. Enter your UPI ID and the number of lots. Quantity must be in multiples of the lot size.
    4. Place your bid within the price band.
    5. Approve the UPI mandate on your UPI app before 5:00 PM IST on the closing date.

    You can also apply through your bank’s ASBA facility. If you do not have a demat account yet, open one before the bidding window closes.

    Checking Your Allotment

    The allotment date is not yet confirmed. Once it is, you can check status on the website of the registrar, KFin Technologies, or on the BSE and NSE IPO allotment pages. You will need your application number, PAN or demat account details. Refund and demat credit dates will be added once announced.

    Key Takeaways

    • The IPO is a fresh issue of up to 27 crore equity shares of face value ₹10, with no offer for sale.
    • Price band, lot size and official dates are not yet announced. Media reports suggest bidding around 21 to 23 October 2026.
    • Revenue was ₹1,46,885 crore and PAT ₹30,049 crore in FY 2025-26, with an EBITDA margin of 51.91%.
    • Diluted EPS is ₹33.59 and NAV is ₹373.66, so you can work out P/E and P/B as soon as the price band is out.
    • Proceeds go to prepaying RJIL debt and general corporate purposes. RIL’s stake falls from 66.43% to about 64.48% after the issue, assuming full subscription.
    • Key risks include debt, licence and spectrum renewal, churn, related-party dependence and a large litigation book.

    Investments in securities are subject to market risks. This is not investment advice; please read all related documents carefully before investing.

    Related Stock Market Insights

    Explore More Trending Stocks
    Adani Enterprises Share Price TVS Motor Company Share Price
    Yes Bank Share Price HDFC Bank Share Price
    Hindustan Unilever Share Price Kotak Mahindra Bank Share Price
    State Bank Of India Share Price ONGC Share Price
    Tata Motors Share Price Tata Steel Share Price
  • Vishal Nirmiti IPO Opens Today: Price Band ₹208-220

    Vishal Nirmiti IPO Opens Today: Price Band ₹208-220

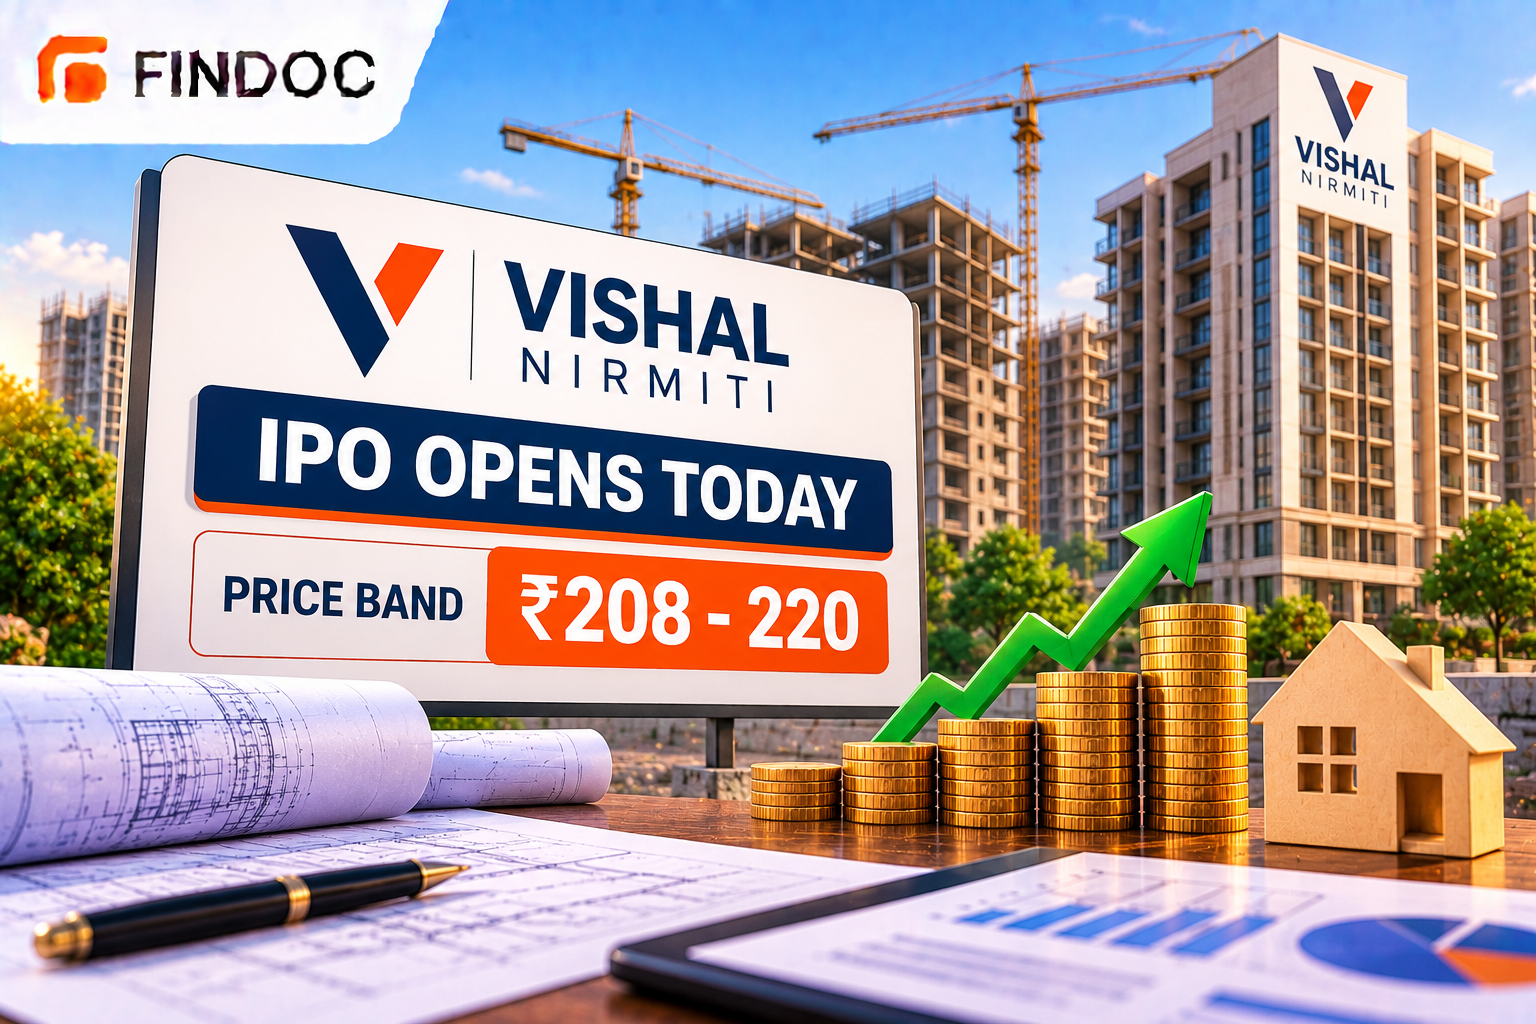
    Vishal Nirmiti Limited, a civil engineering, manufacturing and construction company, opened its ₹178 crore initial public offering (IPO) for subscription on Wednesday, 30 September 2026. The price band has been fixed at ₹208 to ₹220 per equity share, and bidding closes on Monday, 5 October 2026.

    The mainboard issue is a mix of a fresh issue and an offer for sale, and is set to list on both the BSE and NSE on a tentative date of 8 October 2026, joining a busy primary market calendar this week that includes several other mainboard and SME offerings opening around the same time.

    Vishal Nirmiti IPO Key Details

    The IPO comprises a fresh issue of 65.91 lakh shares aggregating up to ₹145 crore, and an offer for sale of 15 lakh shares aggregating up to ₹33 crore. The fresh issue size was raised from an originally planned ₹125 crore ahead of the offer opening.

    Parameter Details
    IPO Dates 30 September 2026 to 5 October 2026
    Price Band ₹208 to ₹220 per equity share
    Face Value ₹10 per equity share
    Lot Size 68 shares (minimum ₹14,960 at the cap price)
    Issue Type Book-built, fresh issue plus offer for sale
    Total Issue Size ₹178 crore
    Fresh Issue ₹145 crore (65.91 lakh shares)
    Offer for Sale ₹33 crore (15 lakh shares)
    Listing Exchanges BSE, NSE
    Allotment Date 6 October 2026 (tentative)
    Listing Date 8 October 2026 (tentative)

    At the upper end of the price band, the company is valued at a market capitalisation of about ₹580.60 crore. Saffron Capital Advisors is the book-running lead manager for the issue, with MUFG Intime India as the registrar.

    Key Valuation Metrics

    Vishal Nirmiti’s pre-issue earnings per share (EPS) stands at ₹12.61, while the post-issue EPS works out to ₹9.46, reflecting the dilution effect of the fresh shares issued. At the upper price band of ₹220, this implies a pre-issue price-to-earnings (P/E) ratio of 17.45 times and a post-issue P/E of 23.26 times.

    • The IPO’s fresh issue size was raised to ₹145 crore from a planned ₹125 crore.
    • Post-issue EPS of ₹9.46 is lower than the pre-issue EPS of ₹12.61, reflecting share dilution.
    • The post-issue P/E of 23.26 times is the relevant multiple for investors buying at the IPO price.
    • The offer for sale portion means a part of the proceeds goes to the selling shareholder, not the company.

    What Vishal Nirmiti Does

    Vishal Nirmiti operates in the civil engineering, manufacturing and construction space. Companies in this sector typically undertake infrastructure-linked projects, ranging from building construction to specialised civil engineering works, depending on their specific area of focus and client base.

    Since detailed segment-wise revenue information was not covered in the sources reviewed for this piece, investors are encouraged to review the company’s red herring prospectus (RHP) for a full breakdown of its business segments, client concentration and revenue mix before applying. The RHP typically discloses order book size, project execution timelines and any client or geographic concentration risks that could affect future revenue, details that matter more for a construction-linked business than for many other sectors given the lumpy, project-based nature of revenue recognition.

    How to Apply for the Vishal Nirmiti IPO

    Retail investors applying for the Vishal Nirmiti IPO can bid for one lot of 68 shares, or in multiples of 68, up to the retail investment limit. At the upper end of the price band, one lot costs ₹14,960. Bids can be placed through UPI via a broker, or through ASBA using net banking, where the bid amount is blocked in the applicant’s bank account rather than debited immediately.

    For the Vishal Nirmiti IPO, demat account setup and UPI mandate approval should be completed in advance of bidding, since allotted shares are credited only to a demat account. Delays in mandate approval can affect an application’s validity if not completed within the bidding window. Investors bidding at the cut-off price agree to pay whatever the final price turns out to be within the announced band, which removes the need to guess the eventual issue price precisely..

    What Investors Should Watch Next

    • Subscription numbers across retail, non-institutional and qualified institutional investor categories as the issue progresses
    • Grey market premium trends ahead of the 6 October allotment date
    • The final listing-day performance relative to the ₹220 upper price band
    • Broader primary market sentiment, given the muted listings seen in some recent IPOs this month

    Investors who open demat account online to participate in mainboard IPOs can use the 30 September to 5 October bidding window to review the company’s financials and apply if the offer fits their investment approach. Those tracking the issue on a trading platform may also want to watch subscription data as it updates through the week, since retail and institutional demand patterns often diverge in the early sessions of a book-built offer.

    Related Stock Market Insights

    Current Open IPOs
    Green Asia Impex Ltd. IPO Shah Investor’s Home Ltd. IPO
    Srit India Ltd. IPO Pind Hospitality Ltd. IPO
    Acme Universal Safezone 9 Ltd. IPO Shivchem Agro Ltd. IPO
    Shree TNB Polymers Ltd IPO Papadmalji Agro Foods Ltd. IPO
    Vans Electro Engineerings Ltd. IPO Black Opal Consultants Ltd. IPO
  • Elevate Campuses IPO Review: Price Band, Dates, Lot Size and Financials

    Elevate Campuses IPO Review: Price Band, Dates, Lot Size and Financials

    Elevate Campuses Limited’s ₹2,100 crore IPO is open from 23 September 2026 to 25 September 2026, in a price band of ₹343 to ₹362 per share, with a lot size of 41 shares. The issue is entirely a fresh issue with no offer for sale, so every rupee reaches the company. This article covers the issue structure, what a retail application costs, the company’s financials, and the valuation math the offer document leaves blank.

    Key IPO Details

    Parameter Details
    IPO Dates 23 September 2026 to 25 September 2026
    Anchor Book 22 September 2026, ₹945 crore raised from anchor investors
    Face Value ₹1 per equity share
    Price Band ₹343 to ₹362 per equity share
    Lot Size 41 shares (minimum ₹14,842 at the cap price)
    Issue Type Book-built, entirely a fresh issue, no offer for sale
    Total Issue Size ₹2,100 crore (5,80,11,049 equity shares)
    Fresh Issue ₹2,100 crore
    Offer for Sale Not applicable
    Listing Exchanges BSE, NSE
    Allotment Date 28 September 2026 (tentative)
    Credit to Demat 29 September 2026 (tentative)
    Listing Date 30 September 2026 (tentative)
    Registrar KFin Technologies Limited
    Book Running Lead Managers JM Financial Limited, IIFL Capital Services Limited, Morgan Stanley India Company Private Limited

    Sources: The company’s Draft Red Herring Prospectus dated 29 September 2025, and live price band and date announcements verified against multiple financial news sources on 23 September 2026. Bidding, allotment and listing schedules are tentative and can shift.

    One flag: the DRHP filed in September 2025 proposed a fresh issue of up to ₹2,550 crore. The issue that opened is ₹2,100 crore, ₹450 crore smaller, consistent with (but not confirmed as) the Pre-IPO Placement the DRHP said it might consider. Check the final RHP’s cover page for confirmation.

    Reservation Split

    Category Reservation
    Qualified Institutional Buyers (QIB) Not less than 75% of the net issue
    Non-Institutional Investors (NII) Not more than 15% of the net issue
    Retail Individual Investors (RII) Not more than 10% of the net issue

    This split applies because the issue is made under Regulation 6(2) of the SEBI ICDR Regulations, since the company does not meet the profitability track record under Regulation 6(1)(a), pushing QIB allocation to the higher 75% floor instead of the usual 50%.

    What a Retail Application Actually Costs

    • One lot (41 shares) at the floor price of ₹343 costs ₹14,063.
    • One lot at the cap price of ₹362 costs ₹14,842. Funds get blocked at the cap price regardless of which price you bid at.
    • The maximum a retail investor can apply for is 13 lots, worth ₹1,92,946, staying under the SEBI cap of ₹2,00,000 for retail applications.
    • A 14th lot would cost ₹2,07,788, which crosses ₹2 lakh and moves the application into the small non-institutional investor (sNII) category instead of retail.

    About the Company

    Incorporated in 2005 in Bengaluru as Woodstock Ambience Private Limited, renamed Good Host Spaces in 2018 and Elevate Campuses in September 2025 ahead of listing, the company is registered in Lower Parel, Mumbai. Its promoters, Genius Bidco Holdings Pte. Ltd. and Genius Rajkot Investment Holdings Pte. Ltd., are ultimately controlled by funds of Hillhouse Investment. Elevate owns, operates and manages on-campus student accommodation for higher education institutions (HEIs) under the Good Host Spaces and ScholarZ brands, and separately owns K-12 school assets in India and Dubai.

    Facts that matter to an investor:

    • As of 31 August 2025, per the DRHP, the Owned Portfolio comprised five student accommodation campuses (16,934 beds) across four Indian cities, plus 16 K-12 Assets in eight Indian cities and two in Dubai. The Managed Portfolio added 14 more campuses (49,338 beds).
    • Occupancy across the Owned Portfolio averaged 99.47% in Academic Year 2024-25, well above the CBRE Report’s estimated 85-90% national average for this segment.
    • Revenue is concentrated: three HEIs contributed 89.00%, 88.60% and 87.50% of revenue from operations in FY2025, FY2024 and FY2023 respectively, with one HEI in Haryana alone accounting for 51.40% of FY2025 revenue and Manipal University Jaipur (MUJ) for 31.60%.
    • K-12 is a new line for this company. Historically, 100% of the Balance Sheet Date Group’s revenue from operations came from student accommodation; the K-12 exposure arrives through the acquisitions this IPO is partly funding.
    • The company has entered a concession agreement with IIT Madras and, through its recent Dubai acquisitions (of what the DRHP refers to as Souk HIS and Souk NLCS UAE), holds two K-12 school assets in Dubai, its first assets outside India.

    Financial Performance

    Restated consolidated figures from the DRHP, converted to ₹ crore. These are the last three audited years disclosed in the DRHP (year ended 31 March each year); they predate the company’s FY 2025-26 results, on which the actual price band was likely set.

    Particulars (₹ crore) FY2025 FY2024 FY2023
    Total Income 394.13 362.61 300.92
    Revenue from Operations 369.81 347.00 292.50
    Revenue growth 6.57% 18.63% Not disclosed in the RHP
    EBITDA 259.32 220.13 186.64
    EBITDA margin (of Total Income) 65.80% 60.71% 62.02%
    Profit after tax (PAT) 52.65 39.69 29.00
    PAT margin (of Total Income) 13.36% 10.95% 9.64%
    Net worth 702.71 655.77 576.99
    Return on Net Worth (RoNW) 7.49% 6.05% 5.03%
    Return on Adjusted Capital Employed 10.02% 9.72% 9.78%
    Net Debt 695.29 730.31 839.98
    Net Debt to EBITDA 2.68x 3.32x 4.50x

    Revenue grew at a two-year CAGR of 12.44%, EBITDA at 17.87%, and PAT at 34.74%, so profit outgrew revenue and margins expanded rather than merely held. Leverage eased too: net debt to EBITDA improved from 4.50x in FY2023 to 2.68x in FY2025.

    Working capital runs light: trade receivables were just ₹2.37 crore and inventories ₹0.996 crore as of March 2025, since revenue comes from long-term lease-like contracts with HEIs and K-12 operators rather than goods sold on credit. The real balance sheet exposure is the property and finance-lease assets behind those contracts, not receivables risk.

    These are historical disclosures and do not indicate future performance.

    Valuation Metrics Explained

    Metric Value
    Basic EPS (FY2025) ₹23.81
    Diluted EPS (FY2025) ₹23.81
    Weighted average diluted EPS (FY2023-25) ₹20.04
    RoNW (FY2025) 7.49%
    Weighted average RoNW 6.60%
    Net Asset Value (NAV) per share (31 March 2025) ₹317.90
    Market capitalisation at the cap price ₹7,201.21 crore (see note below)

    EPS is profit divided by the number of shares. P/E is the share price divided by EPS, showing how many years of current profit you’re paying for. RoNW is profit divided by net worth (equity), showing how efficiently the company turns shareholder money into profit. NAV is net worth divided by shares outstanding, an accounting measure of what each share is backed by.

    Working out the P/E

    The DRHP leaves every P/E field blank, because it was filed before the price band existed. Using the FY2025 diluted EPS of ₹23.81 against the announced band:

    • P/E at the floor price (₹343): 14.41 times
    • P/E at the cap price (₹362): 15.21 times
    • Price to book at the floor: 1.08 times NAV
    • Price to book at the cap: 1.14 times NAV

    A meaningful post-issue P/E needs FY 2025-26 earnings, since the company completed several acquisitions (ScholarZ, two Dubai K-12 assets) during that year and is funding more with this issue’s proceeds. Those audited figures are not in the DRHP supplied for this review, and secondary sources report post-issue P/E anywhere from roughly 15 times to over 90 times depending on the year and share count used. Given how widely these disagree, none is reproduced here as fact; the filed RHP’s own Basis for Issue Price section carries the audited number.

    How that compares with listed peers

    The company states plainly in its DRHP that no listed Indian peer combines K-12 ownership and organised on-campus student accommodation at its scale. So no peer P/E, RoNW or NAV table exists for this issue, which the company’s own risk factors flag: investors have no market benchmark to judge whether the price band is rich or cheap. These ratios are shared for educational understanding, not investment guidance.

    Objects of the Issue

    Because this is entirely a fresh issue with no offer for sale, all of the money raised goes to the company rather than to selling shareholders.

    Object Amount (as per DRHP)
    Payment of purchase consideration for K-12 Entities and Campuses ₹1,100 crore
    Repayment/prepayment of borrowings (Company and subsidiaries GHS Shoolini, GHS Sonipat, Souk HIS UAE, Souk NLCS UAE) ₹750 crore
    Inorganic growth (unidentified acquisitions) and general corporate purposes Not disclosed in the RHP (capped at 35% of gross proceeds combined; each sub-object capped at 25%)

    Two things worth knowing about the largest object. First, the K-12 assets are currently owned by entities that are, per the DRHP’s own wording, affiliates of the company’s promoters, since both the K-12 HoldCos and Genius Bidco/Genius Rajkot trace back to Hillhouse Investment. This is a related-party purchase, and the company’s own risk factors flag that roughly 43.14% of gross proceeds go toward it. Second, it is priced off an independent valuer’s report dated 23 September 2025 rather than a market transaction: an aggregate enterprise value of ₹1,824.62 crore, translating to an aggregate equity value, as of 30 June 2025, of ₹1,106.68 crore.

    On the debt object: the company and named subsidiaries had ₹1,432.10 crore of outstanding borrowings as of 31 August 2025, of which the ₹750 crore being repaid addresses about 52%. The company’s long-term credit rating stood at A+ as of 31 March 2025, improved from A a year earlier.

    The residual for general corporate purposes and unidentified acquisitions is not disclosed in the RHP available for this review. If the ₹1,100 crore and ₹750 crore amounts carry over unchanged into the final ₹2,100 crore issue (down from ₹2,550 crore in the DRHP), roughly ₹250 crore would remain for that bucket, smaller than the ₹700 crore implied by the original plan. This is arithmetic, not a confirmed RHP figure, and should be checked against the actual filed document.

    Strengths and Risk Factors

    Strengths Risk Factors
    Largest institutionalised on-campus student accommodation platform in India by capacity as of 31 August 2025, about 1.7 times the next-largest player and 5 times the third-largest (CBRE Report) Three HEIs supplied 89.00% of FY2025 revenue; one HEI in Haryana alone supplied 51.40%
    Also the largest institutional owner of K-12 school assets in India, about twice the next-largest owner (CBRE Report) 100% of historical revenue came from the student accommodation segment; K-12 contribution is new and unproven at scale
    99.47% average occupancy across the Owned Portfolio in AY2024-25, versus an estimated 85-90% national average 43.14% of gross issue proceeds fund a related-party acquisition from promoter-affiliated K-12 HoldCos
    Serves only about 0.83% of an 11.45-million-student addressable market, per the CBRE Report, indicating room to grow Employee attrition of 21.43%, 18.35% and 33.33% in FY2025, FY2024 and FY2023
    No listed Indian peer combines this business mix, giving it category leadership No listed Indian peer also means no market benchmark exists to sanity-check the asking price
      Company was non-compliant with the Companies Act’s minimum-shareholder requirement for over a year (April 2024 to July 2025); an adjudication application is pending with the MCA
      Promoter Genius Bidco’s entire shareholding is encumbered in favour of an external lender (Deutsche Bank AG, Singapore branch)
      The County and Woodstock student accommodation assets stood vacant as of August-September 2025

    This table summarises the DRHP’s own disclosures and is not a substitute for reading the full Risk Factors section, which runs to roughly 33 numbered factors starting on page 39 of the DRHP.

    How to Apply via Findoc

    1. Log in to your Findoc trading account.
    2. Go to the IPO section and select the Elevate Campuses IPO.
    3. Enter your UPI ID, and the quantity in multiples of 41 shares (the lot size).
    4. Place your bid within the ₹343 to ₹362 price band.
    5. Approve the UPI mandate request in your UPI app within the stated window.

    You can also apply through the bank ASBA route if you prefer not to use UPI. If you do not yet have a demat account, you will need one before the issue closes on 25 September 2026.

    Checking Your Allotment

    Allotment is expected to be finalised on 28 September 2026 (tentative). You can check status on the registrar KFin Technologies’ website, or directly on the BSE and NSE IPO allotment pages, using your PAN, application number or demat client ID. Refunds for unsuccessful or partial allotments, and share credit for successful ones, are expected around 29 September 2026, ahead of the tentative listing on 30 September 2026.

    Key Takeaways

    • Entirely a fresh issue of ₹2,100 crore at ₹343-362 per share, lot size 41 shares, bidding open 23-25 September 2026.
    • Maximum retail application is 13 lots (₹1,92,946); a 14th lot pushes you into the sNII category.
    • FY2023-25 revenue grew at a 12.44% CAGR while PAT grew faster at 34.74%, with leverage easing.
    • At FY2025 EPS, the issue prices at 14.41 to 15.21 times earnings and 1.08 to 1.14 times book value; no updated FY2025-26 figures were available in the DRHP reviewed here.
    • No listed Indian peer exists, so there is no market benchmark for this valuation.
    • Key risks: customer concentration in a handful of HEIs, a related-party acquisition consuming 43.14% of proceeds, and a prior shareholder-count compliance lapse.

    This article is for educational and informational purposes only and is not investment advice or a recommendation to buy or sell any security. Investments in securities are subject to market risks; please read all scheme and offer-related documents carefully, including the company’s Red Herring Prospectus, before investing. 

    Also Check Market Data
    Penny Stocks Penny Stocks Under ₹1
    Penny Stocks Under ₹10 Penny Stocks Under ₹5
    Stocks Under ₹20 FMCG Stocks
    Automobile Stocks Information Technology Stocks
    Bank Stocks High Return Penny Stocks
  • Varmora Granito IPO Review: Price Band, Dates, Lot Size and Financials

    Varmora Granito IPO Review: Price Band, Dates, Lot Size and Financials

    The Varmora Granito IPO opens today, 22 September 2026, and closes 24 September 2026. The price band is ₹140 to ₹148 per share, the lot size is 101 shares, and the total issue size is ₹708.02 crore. This article covers the dates, the lot economics, three years of financials, the valuation against listed peers, and the key risks, all traced to the Red Herring Prospectus (RHP) dated 16 September 2026.

    Key Details

    Parameter Details
    IPO Dates 22 September 2026 to 24 September 2026
    Anchor Book 21 September 2026 (₹212.41 crore raised from 17 anchor investors)
    Face Value ₹2 per equity share
    Price Band ₹140 to ₹148 per equity share
    Lot Size 101 shares (₹14,140 at floor, ₹14,948 at cap)
    Issue Type Book-built, fresh issue and offer for sale
    Total Issue Size ₹708.02 crore
    Fresh Issue ₹320 crore
    Offer for Sale ₹388.02 crore (up to 2,62,17,634 shares by Katsura Investments)
    Listing Exchanges BSE and NSE (NSE is the Designated Stock Exchange)
    Allotment Date 25 September 2026
    Credit to Demat 28 September 2026
    Listing Date 29 September 2026 (tentative)
    Registrar KFin Technologies Limited
    Book Running Lead Managers JM Financial Limited, Goldman Sachs (India) Securities Private Limited, SBI Capital Markets Limited

    Source and currency: the offer structure, promoters, BRLMs and dates come from the RHP dated 16 September 2026 and the anchor allotment notice dated 21 September 2026. The price band and lot size come from the price band advertisement published alongside the RHP. All dates other than the bid open and close are tentative and can shift with the basis of allotment.

    Reservation Split

    The offer is made under Regulation 6(1) of the SEBI ICDR Regulations, 2018.

    Category Share of the Net Offer
    Qualified Institutional Buyers (QIB) Not more than 50%
    Non-Institutional Investors (NII) Not less than 15%
    Retail Individual Investors (RII) Not less than 35%

    Within the QIB portion, up to 60% can go to anchor investors. Of the anchor book, 40% is reserved for domestic mutual funds and life insurance companies and pension funds at or above the anchor allocation price. On 21 September 2026, 17 anchor investors were allotted 1,43,51,775 shares at ₹148 (the cap price), raising ₹212.41 crore. ICICI Prudential Mutual Fund, Goldman Sachs India Equity Portfolio and Bandhan Mutual Fund each took 11.77% of the anchor book.

    What a Retail Application Actually Costs

    • One lot at the floor price (₹140): 101 shares × ₹140 = ₹14,140
    • One lot at the cap price (₹148): 101 shares × ₹148 = ₹14,948

    Funds are blocked at the cap price regardless of where you bid within the band, so budget ₹14,948 per lot.

    Maximum retail application: SEBI caps a Retail Individual Investor at ₹2,00,000 per application. At ₹14,948 a lot, 200000 ÷ 14948 = 13.37, so the most a retail investor can apply for is 13 lots (1,313 shares), worth ₹1,94,324. A 14th lot would cost ₹2,09,272, which pushes the application past the retail cap and into the small non-institutional investor (sNII) category, with a different allotment process.

    About the Company

    Varmora Granito Limited was incorporated on 18 November 2003 as Varmora Granito Private Limited and converted to a public company on 14 May 2025. Its registered office is at 8-A, National Highway, Dhuva, Taluka Wankaner, Rajkot, Gujarat, and its corporate office is in Ahmedabad. It manufactures and markets glazed vitrified tiles (GVT), polished vitrified tiles (PVT), ceramic tiles, sanitaryware, bath fittings and tile adhesives.

    • Manufacturing: Eight in-house manufacturing facilities, all in the Morbi cluster of Gujarat, plus around 304 third-party contract manufacturers as of 31 March 2026. In-house facilities supplied 81.72% of revenue from operations in FY26, up from 66.83% in FY24, a genuine shift toward in-house control over quality and margins.
    • Product mix: GVT and technical products made up 73.98% of revenue from operations in FY26, up from 65.54% in FY24. The company says it was the first in the industry to launch digitally printed wall tiles (2010) and homogenous-body slabs (2006), and the first in Asia to commercialise Integrated Stone Technology (2024), through a technology partnership with the Italian equipment maker SACMI Imola S.C. These claims are sourced to an industry report commissioned by the company (the Technopak Report) and are not independently verified here.
    • Distribution: A pan-India, franchise-led network of exclusive brand outlets (EBOs) and multi-brand outlets (MBOs), reported at 305 EBOs and 2,758 MBOs across 988 cities, alongside a B2B channel serving architects, builders and contractors, and exports to more than 100 countries.
    • Group structure: Wholly-owned subsidiaries Covertek Ceramica Private Limited and Varmora Sanitarywares Private Limited (formerly a LLP), and Simola Tiles LLP, are the entities whose borrowings the fresh issue proceeds will help repay. A joint venture, Allemby Ceramics Private Limited, is developing a facility in Tezpur, Assam.
    • Employees: Around 1,153 permanent employees as of 31 March 2026.
    • Promoters: Bhavesh Vallabhdas Varmora (Chairman and Managing Director), Hiren R Varmora and Pramodkumar Parsotambhai Patel hold 51.3% pre-issue. None of the promoters is selling shares in this offer; the entire offer for sale is by Katsura Investments, an affiliate of Carlyle Group.

    Financial Performance

    Restated consolidated figures, ₹ crore.

    Particulars FY26 FY25 FY24 2-yr CAGR
    Total Income 1,562.53 1,492.68 1,472.58 3.01%
    Revenue growth (YoY) 4.68% 1.36% – –
    Gross Margin 37.92% 38.95% 35.26% –
    EBITDA 221.56 198.29 150.33 21.40%
    EBITDA Margin 14.18% 13.28% 10.21% –
    Profit After Tax (PAT) 55.09 30.77 44.94 10.72%
    PAT Margin 3.53% 2.06% 3.05% –
    Net Worth 810.22 743.20 703.36 7.33%
    Return on Equity (RoE) 6.80% 4.14% 6.39% –
    Total Borrowings 357.95 505.16 412.89 –
    Debt-to-Equity 0.44 0.68 0.59 –

    Margins are calculated on total income, matching the RHP’s own definitions. Two things stand out. First, EBITDA grew faster (21.40% CAGR) than revenue (3.01% CAGR), so margin expansion, not volume growth, is doing the work; the EBITDA margin rose from 10.21% in FY24 to 14.18% in FY26. Second, PAT dipped sharply in FY25 (₹30.77 crore, against ₹44.94 crore in FY24) before recovering to ₹55.09 crore in FY26, so the two-year PAT CAGR of 10.72% masks a non-linear path, not a smooth climb.

    Borrowings and the debt-to-equity ratio have come down from their FY25 peak, which the debt repayment planned from this issue continues.

    These are historical, restated disclosures and do not indicate how the business will perform after listing.

    Valuation Metrics Explained

    Metric FY26
    EPS (Basic) ₹3.08
    RoNW 7.79%
    Net Asset Value (NAV) per share ₹39.52

    EPS (Basic) is PAT divided by the weighted average number of equity shares outstanding during the year. RoNW is PAT divided by net worth (a net worth defined for this purpose in the RHP’s Basis for Offer Price section, which is not the same figure as total equity on the balance sheet). NAV per share is net worth divided by the number of equity shares outstanding. P/E is the offer price divided by EPS.

    Working Out the P/E

    The RHP itself leaves the P/E column blank, because the price band is fixed after the document is filed. Using the FY26 basic EPS of ₹3.08 against the announced band:

    • P/E at the floor price (₹140): 140 ÷ 3.08 = 45.45x
    • P/E at the cap price (₹148): 148 ÷ 3.08 = 48.05x
    • Price to book at the cap price: 148 ÷ 39.52 = 3.74x (3.54x at the floor)

    A post-issue P/E, which spreads the same FY26 profit over a larger share count after the fresh issue, works out to roughly 54x at the cap price. Treat this one figure as approximate: it depends on the exact pre-offer share count, which this article could not independently confirm from the RHP’s Capital Structure section. A press estimate puts the post-issue market capitalisation at approximately ₹3,345 crore at the cap price; an independent calculation from the figures verified here gives roughly ₹2,970 crore. Both are approximate for the same reason.

    How That Compares With Listed Peers

    The RHP’s own peer table, using FY26 figures:

    Company Revenue from Operations (₹ cr) Face Value (₹) EPS (Basic) (₹) P/E (x) RoNW NAV per share (₹)
    Varmora Granito Limited 1,512.46 2 3.08 45.45–48.05* 7.79% 39.52
    Kajaria Ceramics Limited 4,830.36 1 30.48 35.24 15.89% 191.11
    Somany Ceramics Limited 2,789.84 2 19.80 24.94 8.79% 202.11
    Asian Granito India Limited 1,858.06 10 0.70 87.36 1.23% 51.36
    Orient Bell Limited 691.45 10 8.46 39.97 3.78% 222.78

    *Varmora’s own P/E is blank in the RHP; the range shown is calculated in this article at the floor and cap price, not disclosed by the company.

    Read plainly: at the cap price, Varmora is asking for a P/E (48.05x) close to the peer average of roughly 47x, sitting above Kajaria (35.24x) and Somany (24.94x), below Asian Granito (87.36x), and just above Orient Bell (39.97x). But its RoNW (7.79%) is well below Kajaria’s (15.89%) and Somany’s (8.79%), and its NAV per share (₹39.52) is a fraction of every peer’s. In plain terms, the issue is priced closer to a market leader’s multiple while its return on net worth trails the two most comparable, similarly-sized peers. The counter-argument is that FY26 profit recovered sharply from FY25 and margins are expanding, so a one-year RoNW snapshot may understate the trend. Neither point settles the question; it is for the reader to weigh alongside their own view of the tile industry’s growth.

    These ratios are shared for educational understanding, not as investment guidance.

    Objects of the Issue

    The ₹388.02 crore offer-for-sale portion goes entirely to Katsura Investments, the selling shareholder; none of it reaches the company. Only the ₹320 crore fresh issue funds the business.

    Object Amount
    Repayment/pre-payment of borrowings (of the Company and, through investment, its subsidiaries Covertek Ceramica, Varmora Sanitarywares and Simola Tiles LLP) ₹245 crore
    General corporate purposes Balance (~₹75 crore)

    The ₹245 crore earmarked for debt repayment is about 68% of the company’s total FY26 borrowings of ₹357.95 crore, so this is a partial, not full, deleveraging. The RHP’s own capital structure and financial indebtedness sections (which give the lender-wise breakdown, interest rates and the SEBI ICDR cap on unidentified general corporate spending) could not be retrieved for this article; a credit rating agency (CRISIL Ratings Limited) has been appointed to monitor use of proceeds, but no specific rating figure was available to confirm here.

    Strengths and Risk Factors

    Strengths Risk Factors
    In-house manufacturing rose from 66.83% (FY24) to 81.72% (FY26) of revenue from operations, tightening control over quality and cost. 81.72% of FY26 revenue came from manufacturing facilities that are all located in the Morbi region of Gujarat; Cyclone Biparjoy disrupted operations there for about three weeks in FY24.
    GVT and technical products, the company’s premium segment, grew to 73.98% of FY26 revenue from operations, from 65.54% in FY24. GVT and technical products alone are 73.98% of revenue, so any slowdown in demand for this specific segment has an outsized effect.
    EBITDA margin expanded from 10.21% (FY24) to 14.18% (FY26), a 397 basis-point gain in two years. Debt-to-equity, while down from FY25, still stood at 0.44x in FY26, and the business is capital-intensive with ongoing expansion plans.
    The company reports 305 EBOs and 2,758 MBOs across 988 cities and exports to over 100 countries, reducing dependence on any one region. Reliance on 304 third-party contract manufacturers as of 31 March 2026 for part of production not covered in-house.
    None of the three promoters is selling in this offer; the entire offer for sale is by the financial investor Katsura Investments. Outstanding legal proceedings and certain auditor observations under the Companies (Auditor’s Report) Order are disclosed for FY24, FY25 and FY26; this article has not reviewed their individual materiality.

    This is a summary, not a substitute for the “Risk Factors” section of the RHP (page 19 onward), which lists more than 50 numbered risks in full.

    How to Apply

    1. Log in to your broker’s app or your bank’s net banking.
    2. Open the IPO section and select Varmora Granito Limited.
    3. Enter the number of lots (multiples of 101 shares) and your bid price, or select the cut-off price.
    4. Enter your UPI ID, or confirm your ASBA-linked bank account.
    5. Submit the application and approve the UPI mandate request in your UPI app before 5:00 pm on the bid closing date.

    Bank ASBA (Application Supported by Blocked Amount) through net banking is the alternative route to a broker app. If you do not yet have a demat account, you will need to open a demat account before 24 September 2026 to apply.

    Checking Your Allotment

    The basis of allotment is expected on 25 September 2026. You can check your status:

    • On the registrar’s website, KFin Technologies, at its IPO status page.
    • On the BSE or NSE website, under the IPO allotment section.
    • Inside your broker’s app, under orders or IPO history.

    You will need your PAN, application number, or DP/Client ID. Refunds for unsuccessful or partial applications, and the credit of shares for successful ones, are both expected on 28 September 2026, ahead of the tentative listing on 29 September 2026.

    Key Takeaways

    • The issue runs 22 to 24 September 2026, priced at ₹140 to ₹148, in a 101-share lot.
    • It is a ₹708.02 crore offer: ₹320 crore fresh issue and ₹388.02 crore offer for sale by Katsura Investments; the promoters are not selling.
    • FY26 total income was ₹1,562.53 crore and PAT was ₹55.09 crore, with PAT dipping in FY25 before recovering in FY26.
    • At the cap price, the implied P/E is 48.05x on FY26 basic EPS, close to the four-peer average of roughly 47x, while RoNW (7.79%) trails the two closest-sized listed peers.
    • Debt-to-equity has improved from 0.68x (FY25) to 0.44x (FY26), and roughly 68% of FY26 borrowings would be repaid from this issue.
    • Manufacturing is concentrated entirely in Gujarat’s Morbi region, and over 70% of revenue depends on one product category (GVT and technical tiles).

    Investments in securities are subject to market risks. This is not investment advice; please read all related documents carefully before investing.

    Explore More Trending Stocks
    Adani Enterprises Share Price TVS Motor Company Share Price
    Yes Bank Share Price HDFC Bank Share Price
    Hindustan Unilever Share Price Kotak Mahindra Bank Share Price
    State Bank Of India Share Price ONGC Share Price
    Tata Motors Share Price Tata Steel Share Price
  • Jindal Supreme (India) IPO Details: Price Band, Dates, Lot Size and Financials

    Jindal Supreme (India) IPO Details: Price Band, Dates, Lot Size and Financials

    Jindal Supreme (India) Limited has opened a ₹124.88 crore mainboard IPO at a price band of ₹88 to ₹93 per share. Bidding runs from 16 September 2026 to 18 September 2026, the lot size is 161 shares, and the minimum retail application at the cap price is ₹14,973. The shares are proposed to list on both BSE and NSE, with 23 September 2026 as the tentative listing date.

    This review covers the issue structure, what a retail application actually costs, three years of restated financials, the valuation ratios worked out from the announced price band, the objects of the issue and the risk factors disclosed in the prospectus.

    Jindal Supreme IPO Key Details

    Parameter Details
    IPO Dates 16 September 2026 to 18 September 2026
    Anchor Book 15 September 2026
    Face Value ₹10 per equity share
    Price Band ₹88 to ₹93 per equity share
    Lot Size 161 shares (minimum ₹14,973 at the cap price of ₹93)
    Issue Type Book-built, 100% book building, fresh issue plus offer for sale
    Total Issue Size Up to 1,34,28,000 equity shares, about ₹118.17 crore at ₹88 and ₹124.88 crore at ₹93
    Fresh Issue Up to 1,07,41,149 equity shares, about ₹99.89 crore at the cap price
    Offer for Sale Up to 26,86,851 equity shares by VVJ Enterprise Private Limited, about ₹24.99 crore at the cap price
    Listing Exchanges BSE and NSE. NSE is the designated stock exchange
    Allotment Date 21 September 2026 (tentative)
    Refund Initiation 22 September 2026 (tentative)
    Credit to Demat 22 September 2026 (tentative)
    Listing Date 23 September 2026 (tentative)
    Registrar Bigshare Services Private Limited
    Book Running Lead Manager Sarthi Capital Advisors Private Limited

    All share counts, financial figures and object amounts on this page come from the company’s Red Herring Prospectus dated 7 September 2026 and its abridged prospectus. The price band, lot size and the allotment, refund, credit and listing dates were announced after the RHP was filed and have been taken from the exchange and lead manager disclosures. IPO schedules can shift, so treat every date after the closing date as tentative until the registrar confirms it.

    How the issue is split between investor categories

    The offer is being made under Regulation 6(1) of the SEBI ICDR Regulations, 2018, which is the profitability route. That regulation fixes the reservation pattern below.

    Investor Category Share of the net offer
    Qualified Institutional Buyers (QIB) Not more than 50%
    Non-Institutional Investors (NII or HNI) Not less than 15%
    Retail Individual Investors (RII) Not less than 35%

    An anchor portion of 40,28,400 shares, about ₹37.46 crore at ₹93, was allotted on 15 September 2026. That is 30% of the total offer and it is carved out of the QIB portion. After removing the anchor shares, 93,99,600 shares are left for the public bidding categories. If you see a figure of 93,99,600 on a broker page labelled as the issue size, this is what it refers to, not the full 1,34,28,000 share offer.

    What a retail application actually costs

    The lot size is 161 shares. That works out to two very different numbers at the two ends of the band.

    • One lot at the floor price of ₹88 is ₹14,168
    • One lot at the cap price of ₹93 is ₹14,973

    Almost every retail applicant bids at the cut-off price, which means the application goes through at the cap. Your bank blocks the full ₹14,973 under the UPI mandate or ASBA, and refunds the difference only if the final issue price is set below ₹93.

    Maximum retail application. SEBI caps a retail individual investor at ₹2,00,000 per application. At ₹14,973 a lot, 13 lots fit under that ceiling. That is 2,093 shares and ₹1,94,649. A 14th lot would take the application to ₹2,09,622, which crosses the cap and moves the bid into the small non-institutional (S-HNI) category, where allotment works on a proportionate draw rather than the retail lottery.

    About Jindal Supreme (India) Limited

    Jindal Supreme (India) Limited was incorporated in 1974 and is registered in Hisar, Haryana. It makes steel pipes and tubes, and it sells them to infrastructure and industrial buyers. The product range covers mild steel (MS) black pipes and tubes, galvanised pipes and tubes, metal beam crash barriers, which are the steel guard rails along highways, and GI tubular poles used in rural electrification.

    Facts an investor should note from the prospectus:

    • One plant, one location. The registered office and the only manufacturing facility are both at 9th KM, O P Jindal Marg, Hisar Cantt, Hisar, Haryana.
    • The revenue mix is shifting fast. Galvanised pipes fell from 44.25% of total revenue in FY 2023-24 to 26.54% in FY 2025-26. Crash barriers, which the company only started making in April 2024, reached 17.41% of revenue in FY 2025-26. GI tubular poles started in April 2025 and reached 4.66%.
    • Volumes have been flat. Total sales were 98,351 MT in FY 2023-24, 96,400 MT in FY 2024-25 and 1,01,100 MT in FY 2025-26. The revenue growth of FY 2025-26 came more from mix and realisation than from tonnage.
    • Customer spread is wide, supplier spread is not. The top five clients were 14.47% of revenue from operations in FY 2025-26. The top ten suppliers were 76.23% of purchases in the same year.
    • Sells across 24 states, with Haryana the largest single market at 28.55% of revenue in FY 2025-26.
    • One reporting segment, manufacturing and selling of steel tubes.

    Financial Performance

    Restated figures, converted from ₹ lakh to ₹ crore. FY 2025-26 is the year ended 31 March 2026. Q1 FY 2026-27 is the three months ended 30 June 2026 and is not comparable with a full year.

    Particulars (₹ crore) Q1 FY 2026-27 FY 2025-26 FY 2024-25 FY 2023-24
    Revenue from operations ₹190.94 ₹675.39 ₹586.40 ₹645.44
    Revenue growth Not comparable 15.18% (9.15%) Not disclosed in the RHP
    Total income ₹191.09 ₹675.94 ₹604.74 ₹650.88
    EBITDA ₹13.76 ₹41.63 ₹25.92 ₹21.11
    EBITDA margin 7.20% 6.16% 4.42% 3.27%
    Profit after tax ₹8.28 ₹22.53 ₹24.27 ₹12.87
    PAT margin (on total income) 4.33% 3.33% 4.01% 1.98%
    Net worth ₹105.02 ₹96.82 ₹74.64 ₹50.31
    Return on net worth 8.20% 26.28% 38.85% 27.98%
    Return on capital employed 6.14% 16.78% 22.37% 13.92%
    Total borrowings ₹92.46 ₹119.87 ₹95.84 ₹104.92
    Debt to equity 0.88 1.24 1.28 2.09

    Read across the row rather than down the column. Revenue from operations has gone nowhere over three years, a 2.29% compound annual growth rate from FY 2023-24 to FY 2025-26, with an actual fall of 9.15% in between. What has moved is profitability. EBITDA margin has almost doubled from 3.27% to 6.16%, which is what you would expect when a pipe maker adds higher value products like crash barriers and poles to a commodity black pipe base.

    Profit after tax tells a more awkward story. It fell 7.17% in FY 2025-26 even as revenue rose 15.18%. The reason is other income. Total income in FY 2024-25 was ₹604.74 crore against revenue from operations of ₹586.40 crore, a gap of ₹18.34 crore that did not repeat at the same size in FY 2025-26. Operating profit improved. Reported profit did not.

    The working capital picture is the part most IPO pages skip. Restated cash flow disclosures in the prospectus show net cash from operating activities of ₹(5.69) crore in FY 2025-26, against a reported profit after tax of ₹22.53 crore in the same year. Negative operating cash flow alongside positive accounting profit means the profit was absorbed into receivables and inventory rather than collected in cash. The company itself lists past negative cash flows from operating, investing and financing activities as risk factor 7 in its prospectus. Borrowings also climbed from ₹95.84 crore to ₹119.87 crore in that year before falling back to ₹92.46 crore by 30 June 2026.

    These are historical disclosures. They do not indicate how the company will perform in future.

    Valuation Metrics Explained

    Metric Value
    Basic and diluted EPS, FY 2025-26 ₹5.59
    Basic and diluted EPS, Q1 FY 2026-27 ₹2.05
    Return on net worth, FY 2025-26 26.28%
    Net asset value per share, 30 June 2026 ₹26.07
    Net asset value per share, 31 March 2026 ₹18.53
    Post-issue share count 5,10,23,769 shares
    Market capitalisation at ₹93 About ₹474.52 crore
    Market capitalisation at ₹88 About ₹449.01 crore

    In plain words:

    • EPS (earnings per share) is profit after tax divided by the number of shares. It tells you how much profit each share earned.
    • P/E (price to earnings) is the share price divided by EPS. It tells you how many years of current earnings you are paying for.
    • RoNW (return on net worth) is profit after tax divided by average shareholders’ funds. It tells you how hard the company’s own capital is working.
    • NAV (net asset value) per share is net worth divided by the number of shares, sometimes called book value.

    Working out the P/E

    The RHP leaves every P/E field blank as [●], because a prospectus is filed before the price band is fixed. Once the band was announced, the ratios can be calculated. Using the FY 2025-26 diluted EPS of ₹5.59:

    Ratio At ₹88 (floor) At ₹93 (cap)
    Pre-issue P/E on FY 2025-26 EPS 15.74 times 16.64 times
    Post-issue P/E on FY 2025-26 profit 19.93 times 21.06 times
    Price to book on 30 June 2026 NAV of ₹26.07 3.38 times 3.57 times

    The post-issue figure is calculated by spreading FY 2025-26 profit after tax of ₹22.53 crore over the enlarged post-issue count of 5,10,23,769 shares, which gives a post-issue EPS of ₹4.42. Only the fresh issue adds new shares. The offer for sale simply moves existing shares from a promoter group entity to public investors, so it does not dilute earnings per share.

    A post-issue P/E of around 14.33 times is circulating on several IPO aggregator sites. That figure is arrived at by taking the June 2026 quarter’s profit of ₹8.28 crore and multiplying it by four to annualise it, which assumes the strongest quarter in the company’s disclosed history repeats three more times. The 21.06 times figure above uses an audited full year instead. Both are arithmetically correct. They answer different questions, and it is worth knowing which one you are reading.

    How that compares with listed peers

    This is the peer table the company itself discloses. Peer P/E is based on BSE closing prices as on 11 August 2026 and FY 2025-26 earnings.

    Company Revenue from operations (₹ crore) EPS (₹) P/E RoNW
    Jindal Supreme (India) Limited ₹675.39 ₹5.59 Not applicable, unlisted 26.28%
    Vibhor Steel Tubes Limited ₹1,149.35 ₹4.64 23.06 4.57%
    Sambhv Steel Tubes Limited ₹2,413.24 ₹1.81 65.55 18.35%
    Hi-Tech Pipes Limited ₹4,200.07 ₹3.77 22.31 6.07%

    The peer average P/E works out to 36.97 times, with a high of 65.55 and a low of 22.31.

    On the pre-issue multiple of 16.64 times, Jindal Supreme is asking for less than the lowest listed peer while reporting the highest return on net worth in the table. On the post-issue multiple of 21.06 times it sits just under Hi-Tech Pipes. The counter-argument is that it is also the smallest company in the group by revenue, it runs on a single plant, its three year revenue growth is close to flat, and its FY 2025-26 return on net worth of 26.28% is measured on a net worth that is a fraction of its peers’, which flatters the ratio. A low multiple can reflect a fair discount for scale and concentration rather than a bargain.

    These ratios are shared for educational understanding, not as investment guidance.

    Objects of the Issue

    Only the fresh issue money reaches the company. The offer for sale portion, up to 26,86,851 shares and about ₹24.99 crore at the cap price, goes to the selling shareholder VVJ Enterprise Private Limited, a promoter group entity. The company receives nothing from that part.

    Object Amount (₹ crore)
    Repayment or pre-payment, in full or in part, of certain outstanding borrowings ₹71.00
    General corporate purposes To be finalised at the time of pricing
    Total net proceeds To be finalised at the time of pricing

    The debt repayment is the substance of this issue. The company had total borrowings of ₹92.46 crore as at 30 June 2026, so the ₹71.00 crore earmarked here would clear about 76.79% of the borrowings outstanding on that date. It is also 71.08% of the gross fresh issue proceeds at the cap price of ₹93. The lender-wise list and the interest rate range are set out in the Objects of the Offer section of the RHP on page 92 and are not reproduced in the abridged prospectus.

    General corporate purposes is left blank pending the final price. The company has disclosed that the amount used for general corporate purposes will not exceed 25% of the gross proceeds, which is the SEBI ICDR ceiling.

    The prospectus does not disclose a credit rating for the issue.

    Strengths and Risk Factors

    Every entry below carries a specific number or fact from the prospectus rather than an adjective.

    Strengths Risk Factors
    EBITDA margin improved from 3.27% in FY 2023-24 to 6.16% in FY 2025-26 Revenue from operations grew at a 2.29% CAGR over FY 2023-24 to FY 2025-26, and fell 9.15% in FY 2024-25
    Return on net worth of 26.28% in FY 2025-26 is the highest in the disclosed peer table Profit after tax fell 7.17% in FY 2025-26 despite revenue rising 15.18%
    Debt to equity improved from 2.09 in FY 2023-24 to 0.88 as at 30 June 2026, before the IPO proceeds are applied Operations run from a single manufacturing facility at Hisar, Haryana, and any shutdown there affects the whole business
    ₹71.00 crore of the fresh issue is earmarked for debt repayment, about 76.79% of the ₹92.46 crore borrowings as at 30 June 2026 Top 10 suppliers accounted for 76.23% of purchases in FY 2025-26, so any supply delay is concentrated
    New products added recently: crash barriers reached 17.41% of revenue in FY 2025-26 and GI tubular poles 4.66% Production costs depend on mild steel coil, hot rolled coil and galvanising material prices, which are volatile
    Revenue generated across 24 states, reducing dependence on any single market Haryana alone was 28.55% of revenue in FY 2025-26, so regional disruption carries weight
    Promoters have not pledged or encumbered any of their shareholding The company reports past negative cash flows from operating, investing and financing activities
    No qualifications in the statutory auditor’s report on the restated financials Three GST intimations under Rule 88D alleging excess input tax credit of ₹564 lakh in total have been replied to, with no show cause notice issued as on the prospectus date

    This table is a summary, not a substitute. The full risk factors section begins on page 24 of the Red Herring Prospectus and runs to considerably more than ten items. Read it before applying.

    How to Apply for the Jindal Supreme IPO through Findoc

    1. Log in to your Findoc trading account.
    2. Open the IPO section and select Jindal Supreme (India) Limited from the list of open issues.
    3. Enter the quantity in multiples of the lot size of 161 shares, and a bid price between ₹88 and ₹93, or tick the cut-off price box to bid at ₹93.
    4. Enter your UPI ID linked to the bank account you want the funds blocked in.
    5. Submit the bid. A mandate request will arrive in your UPI app.
    6. Approve the mandate before the cut-off. Funds stay blocked in your account until allotment.

    The UPI mandate end time on the closing date of 18 September 2026 is 5:00 PM IST.

    If you prefer not to use UPI, you can apply through bank ASBA in your net banking, where your bank blocks the amount directly.

    If you do not have a demat account yet, you will need one before you can apply, and the issue closes on 18 September 2026.

    Checking your allotment

    Allotment is expected to be finalised on 21 September 2026. Once it is published you can check it in three places:

    • The registrar Bigshare Services Private Limited’s allotment page
    • The BSE IPO allotment page
    • The NSE IPO bid verification page

    You will need your PAN, your application number or your demat account number. Refunds and demat credit are both expected on 22 September 2026, and listing on 23 September 2026.

    Key Takeaways

    • ₹124.88 crore book-built mainboard issue at the cap price, made up of a ₹99.89 crore fresh issue and a ₹24.99 crore offer for sale by a promoter group entity.
    • Price band ₹88 to ₹93, lot size 161 shares, one lot is ₹14,973 at the cap price, and the maximum retail application is 13 lots or ₹1,94,649.
    • Bidding from 16 to 18 September 2026, tentative allotment 21 September, tentative listing on BSE and NSE on 23 September 2026.
    • FY 2025-26 revenue from operations of ₹675.39 crore, profit after tax of ₹22.53 crore, EBITDA margin of 6.16% and return on net worth of 26.28%.
    • Pre-issue P/E of 16.64 times and post-issue P/E of 21.06 times on FY 2025-26 earnings, against a disclosed peer average of 36.97 times and a peer low of 22.31 times.
    • Main risks: a single manufacturing location, flat three year revenue, a fall in profit in FY 2025-26, supplier concentration of 76.23%, and past negative operating cash flow.


    Disclaimer: This article is for educational and informational purposes only. It is not investment advice and it is not a recommendation to subscribe to, buy, sell or hold any security. Investments in the securities market are subject to market risks. Read all the related documents carefully before investing.

  • Hero Motors IPO Review: Price Band, Dates, Lot Size and Financials

    Hero Motors IPO Review: Price Band, Dates, Lot Size and Financials

    Hero Motors Limited, an automotive powertrain and transmission company promoted by the Munjal family, is launching a ₹1,000 crore mainboard IPO at a price band of ₹79 to ₹84 per share. The issue opens on 16 September 2026, closes on 18 September 2026, and is expected to list on the BSE and NSE on 23 September 2026. Here is a closer look at the issue structure, the business, the financial track record and the disclosed risks, so you can read the offer before you apply.

    Hero Motors IPO: Key Details

    Parameter Details
    IPO Dates 16 September 2026 to 18 September 2026
    Anchor Book 15 September 2026
    Face Value ₹10 per share
    Price Band ₹79 to ₹84 per share
    Lot Size 178 shares (minimum ₹14,952 at the cap price)
    Issue Type Book-built, fresh issue plus offer for sale
    Total Issue Size ₹1,000 crore
    Fresh Issue ₹600 crore
    Offer for Sale ₹400 crore
    Listing Exchanges BSE and NSE (BSE is the Designated Stock Exchange)
    Allotment Date 21 September 2026
    Credit to Demat 22 September 2026
    Listing Date 23 September 2026 (tentative)
    Registrar KFin Technologies Limited
    Book Running Lead Managers ICICI Securities, DAM Capital Advisors, JM Financial

    Issue details are as per the Red Herring Prospectus dated 9 September 2026 and the price band announcement of 10 September 2026. Schedules for IPOs are tentative and can shift, so confirm the final terms in the RHP before you apply.

    Who gets how much

    The offer is made under Regulation 6(1) of the SEBI ICDR Regulations, so the reservation split is:

    Investor Category Reservation
    Qualified Institutional Buyers (QIB) Not more than 50% of the net offer
    Non-Institutional Investors (NII) Not less than 15%
    Retail Individual Investors (RII) Not less than 35%

    What a retail application actually costs

    One lot is 178 shares. At the floor price of ₹79 that is ₹14,062, and at the cap price of ₹84 it is ₹14,952. Applications are blocked at the cap price, so plan for ₹14,952 per lot.

    SEBI caps a retail individual investor’s application at ₹2 lakh. At ₹84 per share that works out to a maximum of 13 lots, or ₹1,94,376. A 14th lot would take the application to ₹2,09,328 and push you into the small non-institutional (sHNI) category instead.

    About Hero Motors Limited

    Hero Motors was incorporated in April 1998 and has its registered office in Ludhiana, Punjab, with a corporate office in Noida, Uttar Pradesh. The company designs, develops, manufactures and supplies engineered powertrain solutions to automotive original equipment manufacturers (OEMs) in India, Europe, the United States and the ASEAN region.

    The business runs across two reporting segments:

    • Powertrain Solutions, covering gears and transmission (G&T) and bike powertrain (BPT) for e-bikes and micro-mobility. This contributed 53.67% of FY 2025-26 revenue.
    • Alloys and Metallics (A&M), covering sheet metal and tubular assemblies and components for automotive OEMs. This contributed 46.33%.

    Other points from the RHP worth knowing:

    • Customers include BMW, Ducati, Hero MotoCorp, enviolo, Formula Motorsport, HWA and Hummingbird EV.
    • As of 31 March 2026, it operated six manufacturing facilities across India, the United Kingdom and Thailand. The Indian plants are at Ludhiana, Punjab and Gautam Buddha Nagar, Uttar Pradesh.
    • Revenue from electric mobility applications rose to 23.00% of revenue in FY 2025-26, from 12.03% in FY 2023-24.
    • Research and development spending was 7.54% of revenue in FY 2025-26, which is well above the peer set disclosed in the RHP.
    • International customers accounted for 41.36% of FY 2025-26 revenue, with Europe alone at 33.59%.

    Financial Performance (FY 2023-24 to FY 2025-26)

    All figures below are from the Restated Consolidated Financial Information in the RHP, converted from ₹ million to ₹ crore.

    Metric FY 2025-26 FY 2024-25 FY 2023-24
    Revenue from Operations ₹1,188.35 crore ₹1,089.59 crore ₹1,064.39 crore
    Revenue Growth 9.06% 2.37% 0.93%
    Gross Profit ₹495.46 crore ₹452.16 crore ₹419.37 crore
    Gross Margin 41.69% 41.50% 39.40%
    EBITDA ₹147.78 crore ₹114.00 crore ₹86.28 crore
    EBITDA Margin 12.44% 10.46% 8.11%
    Profit After Tax (PAT) ₹41.17 crore ₹32.80 crore ₹17.04 crore
    PAT Margin 3.46% 3.01% 1.60%
    Total Equity (Net Worth) ₹481.01 crore ₹426.01 crore ₹374.82 crore
    Return on Equity 8.56% 7.70% 4.54%
    Return on Capital Employed 19.77% 18.84% 23.23%
    Net Debt to Adjusted EBITDA 2.24 times 2.79 times 1.72 times

    The pattern here is modest topline growth with sharp margin repair. Revenue grew at a two-year CAGR of about 5.7% from FY 2023-24 to FY 2025-26, while PAT grew at roughly 55% CAGR off a small base. EBITDA margin expanded by more than four percentage points over the same period.

    Two things to watch on the working capital side: receivable days stretched from 67 in FY 2023-24 to 78 in FY 2025-26, and inventory days sat at 64. Longer collection cycles mean accounting profit and cash generation can move apart, so track cash flow from operations in the first few quarterly results after listing.

    These are historical disclosures. They do not indicate future performance.

    Valuation Metrics Explained

    Valuation ratios tell you what you are paying for each rupee of earnings and book value.

    Ratio Value
    Basic EPS (FY 2025-26) ₹1.15
    Diluted EPS (FY 2025-26) ₹1.14
    Weighted Average Diluted EPS (3 years) ₹0.85
    Return on Net Worth (FY 2025-26) 8.53%
    Weighted Average RoNW (3 years) 7.58%
    Net Asset Value per share (31 March 2026) ₹12.72
    Market Cap at cap price About ₹3,815 crore

    Key formulas

    • EPS (Earnings Per Share) = Net profit after tax ÷ Weighted average number of shares
    • P/E Ratio = Share price ÷ EPS
    • RoNW = Net profit after tax ÷ Net worth × 100
    • NAV per share = Net assets ÷ Number of shares outstanding

    Working out the P/E

    The RHP leaves the P/E blank because the price band was fixed after it was filed. Using the disclosed FY 2025-26 diluted EPS of ₹1.14:

    • P/E at the floor price of ₹79 works out to about 69.3 times
    • P/E at the cap price of ₹84 works out to about 73.7 times

    On a post-issue diluted basis the multiple is higher still, because the fresh issue adds roughly 7.14 crore new shares. Post-issue EPS on FY 2025-26 earnings comes to about ₹0.91, putting the P/E at the cap price near 92 times.

    Price to book at the cap price is about 6.6 times the 31 March 2026 NAV of ₹12.72.

    How that compares with listed peers

    The RHP discloses this peer set, using closing prices on the BSE as on 7 September 2026 and FY 2025-26 diluted EPS.

    Company FY 2025-26 Revenue Diluted EPS NAV per share P/E RoNW
    Hero Motors Limited ₹1,188.35 crore ₹1.14 ₹12.72 Not applicable 8.53%
    Sona BLW Precision Forgings ₹4,449.46 crore ₹10.30 ₹93.93 76.50 10.77%
    UNO Minda ₹19,657.59 crore ₹20.75 ₹113.77 59.84 19.59%
    Varroc Engineering ₹8,890.49 crore ₹14.73 ₹80.45 56.15 18.70%
    Endurance Technologies ₹14,595.88 crore ₹67.66 ₹442.54 40.84 15.29%
    CIE Automotive India ₹9,406.47 crore ₹21.69 ₹164.65 17.68 13.18%

    The RHP puts the peer group average P/E at 50.20 times, with a high of 76.50 and a low of 17.68.

    Read this table honestly. Hero Motors is asking for a multiple at the top end of its peer range while posting the lowest RoNW, the lowest PAT margin and the smallest revenue base in the set. The counter-argument is the EV revenue mix and the R&D intensity, which are both well ahead of peers. Whether that justifies the premium is a judgement call, and it is yours to make.

    These ratios are shared for educational understanding, not as investment guidance.

    Objects of the Issue

    The company receives nothing from the ₹400 crore offer for sale. Only the ₹600 crore fresh issue proceeds come to Hero Motors, and the RHP earmarks them as follows:

    Object Amount
    Repayment or prepayment of certain outstanding borrowings ₹190 crore
    Capital expenditure for capacity expansion at the Gautam Buddha Nagar, Uttar Pradesh facility ₹200 crore
    Inorganic growth through unidentified acquisitions and general corporate purposes Balance of net proceeds

    On the debt repayment, the RHP discloses standalone outstanding borrowings of ₹289.55 crore as on 31 July 2026 across facilities from Axis Bank, Kotak Mahindra Bank and ICICI Bank, with effective interest rates between 6.65% and 8.10%. The ₹190 crore repayment covers 44.49% of that.

    On the acquisitions line, note the SEBI ICDR caps the company has disclosed: inorganic growth and general corporate purposes together cannot exceed 35% of gross fresh issue proceeds, general corporate purposes alone cannot exceed 25%, and unidentified acquisitions alone cannot exceed 25%. Money set aside for acquisitions that have not been identified yet is, by definition, the least visible use of your capital in this issue.

    The capex at Gautam Buddha Nagar is scheduled across three financial years: ₹66 crore in FY 2026-27, ₹60 crore in FY 2027-28 and ₹74 crore in FY 2028-29.

    The company’s bank facilities carry a CRISIL A+/Stable long-term rating and CRISIL A1 short-term rating, reaffirmed on 24 August 2026.

    Strengths and Risk Factors

    A fair reading of any IPO means putting the pitch and the disclosed risks side by side.

    Strengths Risk Factors
    Fully integrated powertrain player serving global OEMs including BMW, Ducati and Hero MotoCorp Top 10 customers made up 72.89% of FY 2025-26 revenue, so losing one account matters
    EV-linked revenue almost doubled in share, from 12.03% in FY 2023-24 to 23.00% in FY 2025-26 41.36% of revenue comes from international customers, with Europe alone at 33.59%, exposing the business to a slowdown or regulatory change in one region
    R&D spend at 7.54% of revenue, materially higher than every listed peer disclosed in the RHP Raw materials were 54.99% of revenue in FY 2025-26, so input cost swings hit margins directly
    EBITDA margin expanded from 8.11% to 12.44% over three years Demand is tied to the e-bike and two-wheeler cycle in India and overseas, which is cyclical
    Six manufacturing sites across India, the UK and Thailand, close to customer bases Receivable days rose from 67 to 78, and net debt to adjusted EBITDA stood at 2.24 times
    CRISIL A+/Stable bank facility rating, reaffirmed in August 2026 No definitive long-term supply agreements with all suppliers; most raw material is bought on purchase orders
    Promoter group holding of about 73.97% before the issue One customer undertook a product recall in FY 2025-26, claiming a faulty product supplied by the company

    Go through the full risk factors section of the Red Herring Prospectus, which begins on page 21, before making any decision. The list above is a summary, not a substitute.

    How to Apply for the Hero Motors IPO via Findoc

    1. Log in to your Findoc trading and demat account.
    2. Go to the IPO section on the Findoc platform or app.
    3. Select “Hero Motors IPO” from the list of active issues.
    4. Enter your UPI ID, the quantity in multiples of 178 shares, and a bid price within the ₹79 to ₹84 band.
    5. Approve the UPI mandate request in your linked banking app to block the funds.

    Bank ASBA through net banking is the other route, where your bank blocks the amount in your account instead of a UPI mandate.

    If you do not have an account yet, you can complete your demat account signup before the issue closes on 18 September 2026.

    Checking your allotment

    Basis of allotment is expected on 21 September 2026. You can check your status in three places using your PAN, application number or DP/Client ID:

    • KFin Technologies, the registrar for this issue
    • The BSE website
    • The NSE website

    Refunds and unblocking of funds for unsuccessful applications happen around 22 September 2026, with shares credited to successful applicants the same day.

    Key Takeaways

    • Hero Motors IPO is a ₹1,000 crore book-built issue, made up of a ₹600 crore fresh issue and a ₹400 crore offer for sale.
    • The price band is ₹79 to ₹84 per share, with a lot of 178 shares and a minimum retail application of ₹14,952.
    • Bidding runs from 16 to 18 September 2026, with listing on the BSE and NSE expected on 23 September 2026.
    • FY 2025-26 revenue was ₹1,188.35 crore with PAT of ₹41.17 crore, and EBITDA margin improved to 12.44% from 8.11% two years earlier.
    • At the cap price, the P/E works out to roughly 73.7 times on FY 2025-26 diluted EPS, against a disclosed peer average of 50.20 times.
    • Customer concentration, export dependence on Europe and rising receivable days are the main disclosed risks.

    Reads more:

    Disclaimer: This article is for educational and informational purposes only and is not investment advice, nor a recommendation to buy, sell or subscribe to any security. Investments in securities markets are subject to market risks. Read all the related documents carefully before investing, including the Red Herring Prospectus. Past performance is not indicative of future results. IPO schedules, price bands and issue terms are subject to change. All figures in this article are taken from the Hero Motors Limited Red Herring Prospectus dated 9 September 2026 and are current as of 15 September 2026. Please consult a SEBI-registered investment adviser before making any investment decision.

  • Pranav Constructions Debuts at 33% Premium on NSE

    Pranav Constructions Debuts at 33% Premium on NSE

    Pranav Constructions shares listed at ₹165 on the NSE on 15 September 2026, a 33.06% premium over the ₹124 issue price. The stock then gave up most of that gain within the first hour of trade as early investors booked profits.

    How the Listing Day Played Out

    The Mumbai-based redevelopment company opened at ₹165 on the NSE and at ₹162 on the BSE, a premium of 30.65% on the BSE side. Both prices were measured against the final issue price of ₹124 per share.

    An investor who received one lot of 120 shares was sitting on a notional gain of about ₹4,920 at the NSE opening price. That is calculated as (₹165 minus ₹124) multiplied by 120 shares.

    The gain did not hold. The stock touched a high of ₹165.10 on the NSE and then fell to ₹133.80. On the BSE it moved between ₹164.50 and ₹129.60, and was quoting at ₹136.45 around 10:22 AM IST, up 9.52% over the issue price.

    Listing Day Snapshot NSE BSE
    Issue price ₹124 ₹124
    Listing price ₹165 ₹162
    Listing premium 33.06% 30.65%
    Intraday high ₹165.10 ₹164.50
    Intraday low ₹133.80 ₹129.60

    Prices as reported from exchange data on the morning of 15 September 2026. Intraday levels change through the session.

    The Grey Market Had Signalled a Bigger Pop

    Ahead of the debut, Pranav Constructions IPO was commanding a grey market premium of ₹53 to ₹55 per share. That pointed to a listing somewhere in the 43% to 45% range.

    Grey market premium, or GMP, is the unofficial price at which unlisted shares change hands before listing. It is not published by the NSE or BSE, it is not regulated, and it frequently misses the actual opening price.

    This listing is a clean example of that gap. The actual premium came in at 33.06%, several percentage points below what the grey market was indicating a day earlier.

    Inside the 121 Times Subscription

    The ₹351.03 crore issue was subscribed 121 times overall on the net offer when bidding closed on 9 September 2026. Investors placed bids for 2,71,80,46,080 shares against 2,24,63,137 shares available in the net offer.

    Institutional money drove the book. Qualified institutional buyers bid 267.81 times their reserved portion, while the two non-institutional buckets came in at 243.41 times and 170.83 times.

    Investor Category Times Subscribed
    Qualified institutional buyers (excluding anchors) 267.81
    Non-institutional, above ₹10 lakh 243.41
    Non-institutional, ₹2 lakh to ₹10 lakh 170.83
    Retail individual investors 45.47

    Source: Basis of Allotment advertisement issued by the company, dated 11 September 2026.

    In rupee terms the book attracted bids worth roughly ₹33,872 crore against an issue of ₹351.03 crore. Close to 79.57% of the final demand came in at ₹124, the top of the ₹118 to ₹124 price band, with another 20.26% placed at cut-off.

    How Thin the Retail Odds Were

    Retail investors were allotted 1,27,38,817 shares spread across 1,06,156 successful applicants. In the base retail category of one lot, the allotment ratio worked out to 116 applicants for every 4,503, which is roughly one in every 39 applications.

    Institutions faced no such lottery. Qualified institutional buyers received 45,29,357 shares across just 140 successful applicants, allotted on a proportionate basis.

    The company had also raised ₹84.24 crore on 4 September 2026 by allotting 67,94,034 shares to 14 anchor investors at ₹124 each. Allotment was finalised on 10 September 2026 and shares were credited to the demat account of successful applicants before the 15 September listing.

    What Pranav Constructions Actually Does

    Pranav Constructions is a pure-play redevelopment developer operating under the PCPL brand, focused on the Municipal Corporation of Greater Mumbai region and predominantly on the Western Suburbs.

    Redevelopment means taking over an ageing housing society building, demolishing it, rehousing the existing members in a new structure, and selling the additional units the extra construction rights allow. The developer’s profit sits in those free-sale units.

    As of 31 March 2026, the company had 65 redevelopment projects in its portfolio. That covered 28 completed projects, 20 under construction and 17 upcoming ones, across economical, mid and mass, and aspirational housing segments.

    Brokerage firm Antique, in a note carried ahead of the listing, pointed to an average project construction cycle of about 26 months and described the model as asset-light, while flagging that the concentration in one municipal region remains a live risk.

    FY26 Financials and Valuation at the Issue Price

    The company reported growth in both the top line and the bottom line for the financial year ended 31 March 2026.

    Metric FY26 FY25
    Revenue from operations ₹761.60 crore ₹636.27 crore
    Total income ₹763.93 crore ₹638.24 crore
    Profit after tax ₹71.32 crore ₹62.25 crore
    EBITDA ₹130.83 crore ₹98.54 crore
    Total borrowings ₹258.44 crore ₹196.50 crore

    Figures from the company’s prospectus dated 9 September 2026 and post-listing disclosures on 15 September 2026.

    Net worth stood at ₹246.70 crore and total assets at ₹1,799.19 crore as on 31 March 2026. Basic and diluted earnings per share were ₹8.18, net asset value per share was ₹28.30, and return on net worth for FY26 was 33.78%.

    On valuation, the prospectus put the price to earnings ratio at the upper band of ₹124 at 15.16 times, against an industry peer group average of 113.46 times. The P/E ratio simply divides the share price by earnings per share, and shows how much investors are paying for every ₹1 of profit.

    Applying the same FY26 EPS of ₹8.18 to the NSE listing price of ₹165 works out to about 20.2 times. At the ₹136.45 level seen shortly after listing, it works out to roughly 16.7 times. These are simple calculations on last year’s earnings, not forecasts.

    Where the Fresh Issue Money Goes

    Of the ₹351.03 crore raised, the fresh issue of 2,54,51,612 shares accounts for ₹315.60 crore and goes to the company. The offer for sale of 28,56,869 shares worth ₹35.43 crore went to the selling shareholder, BioUrja India Infra, not into the business.

    The company has earmarked the fresh issue proceeds for funding redevelopment expenses on certain under construction and upcoming projects. This covers government and statutory approvals, the purchase of additional floor space index, and compensation paid to society members for alternate accommodation and hardship.

    Floor space index, or FSI, is the limit on how much floor area can be built on a plot. Buying extra FSI lets a developer construct more saleable area on the same land.

    The balance is set aside for repayment or prepayment of certain borrowings, and for acquiring future redevelopment projects and general corporate purposes. Promoter holding falls from 63.35% before the issue to 49.03% after it.

    Risks Disclosed in the Prospectus

    The offer document lists several risks that continue to apply now that the stock is listed.

    • Revenue from operations is heavily concentrated, with the MCGM region contributing 99.70% in FY26, 99.69% in FY25 and 99.50% in FY24.
    • Operating cash flow was negative in both of the last two years, at an outflow of ₹41.19 crore in FY26 and ₹92.60 crore in FY25.
    • Total borrowings have risen from ₹99.34 crore in FY24 to ₹258.44 crore in FY26.
    • Supplier and contractor dependence is high, with the top 10 suppliers accounting for 61.78% of material costs and the top 10 contractors for 47.10% of contractor payments in FY26.
    • Delays in redevelopment projects can trigger RERA penalties and extended displacement compensation payable to society members.
    • Redevelopment agreements with co-operative housing societies carry the risk of irregularities in land title or land use.

    What to Watch From Here

    The first thing to follow is whether the price settles above or below the ₹124 issue price once listing day volatility passes. Anyone tracking that movement in real time will need an online trading platform with live NSE and BSE quotes.

    Beyond price, the operational markers matter more over the next few quarters. Those include the pace of conversion from the 17 upcoming projects into construction, approval timelines with the MCGM, the direction of the borrowing figure, and whether operating cash flow turns positive.

    The first quarterly results as a listed company, for the quarter ending September 2026, will be the next real checkpoint on whether the FY26 growth rate is holding up.

    Investments in securities are subject to market risks. This article is for information only and is not investment advice.