findocblog

Category: Uncategorized

  • Suryoday SFB Shares Jump 5% on Strong Q2 FY27 Business Update

    Suryoday SFB Shares Jump 5% on Strong Q2 FY27 Business Update

    Suryoday Small Finance Bank’s shares rose up to 5% on October 5, 2026 after its Q2 FY27 business update showed 35% deposit growth, 34.6% advance growth and a sharp fall in gross NPAs to 2.9%, signalling improved asset quality and funding stability for the lender.

    Shares Rise as Q2 Metrics Beat Expectations

    Suryoday Small Finance Bank (NSE: SURYODAY) saw its stock climb as much as 4.6% to an intraday high of ₹150.19 on Monday, October 5, 2026, following the release of its provisional business metrics for the July–September 2026 quarter. The previous close was ₹143.55, and the move came alongside a broader set of bank Q2 updates that lifted several banking stocks on the same day.

    The rally was driven by a combination of strong liability-side growth and a marked improvement in asset quality, two factors that matter especially for small finance banks, where funding costs and credit risk can swing sentiment quickly.

    What Changed in Q2 FY27

    Suryoday SFB’s regulatory filing for Q2 FY27 highlighted multiple growth and risk metrics:

    • Gross advances: Up 34.6% year-on-year (YoY) to ₹14,972 crore, after accounting for a ₹591 crore write-off.
    • Total deposits: Up 35% YoY to ₹16,184 crore, underlining robust liability growth.
    • Disbursements: Up 27.4% YoY to ₹3,095 crore, reflecting continued loan-book momentum.
    • CASA deposits: Up 26.8% YoY to ₹3,142 crore; CASA ratio stood at 19.4% as of September 30, 2026.
    • Gross NPA (GNPA): Fell 360 basis points quarter-on-quarter (QoQ) to 2.9% in Q2 FY27 from 6.5% in Q1 FY27.

    The sharp QoQ drop in GNPA is the standout number: it reduces the near-term credit-risk overhang and improves the bank’s risk profile ahead of its full quarterly results.

    Why Asset-Quality Improvement Matters

    For small finance banks, asset quality is a key valuation lever. A GNPA print of 2.9% down from 6.5% just one quarter earlier suggests better collections, tighter underwriting or both, and can support re-rating if sustained.

    At the same time, deposit growth of 35% YoY strengthens the funding base, which is critical for an SFB that relies heavily on retail and small-business liabilities. The CASA ratio of 19.4% remains modest by banking standards, indicating scope for improvement in low-cost deposits, but the absolute growth in CASA (to ₹3,142 crore) is a positive sign.

    Market Reaction and Price Context

    Suryoday SFB’s market capitalisation stood at around ₹1,534.83 crore as of October 5, 2026, placing it among the smaller listed SFBs where quarterly asset-quality swings can have a disproportionate impact on sentiment.

    Recent price context:

    • Intraday high (Oct 5, 2026): ₹150.19
    • Previous close: ₹143.55
    • 1-month performance: Down ~5%
    • YTD performance: Up ~2%
    • 52-week high: ₹218 (July 24, 2026)
    • 52-week low: ₹115.41 (February 24, 2026)

    The stock had been under pressure over the past month, so the Q2 business update provided a clear positive trigger for a relief rally.

    Governance Move: New Chief Risk Officer

    In a separate but relevant development, Suryoday SFB’s board appointed Alok Pathak as Chief Risk Officer, effective October 1, 2026, for a three-year term. This appointment, disclosed in an October 1 filing, reinforces the bank’s focus on risk management at a time when asset-quality trends are being closely watched by investors.

    While not a direct driver of Monday’s price move, the CRO appointment adds a governance layer that may support confidence in the sustainability of the improved GNPA trajectory.

    What Investors Should Track Next

    The key question for investors is whether the Q2 improvements can be maintained:

    • GNPA sustainability: Can the bank keep GNPA near current levels or lower in Q3 and beyond?
    • CASA trajectory: Any improvement in the CASA ratio would help lower funding costs and support margins.
    • Disbursement pace: Continued 20–30% YoY disbursement growth would validate loan-demand strength in its core segments.

    Provisional business updates often precede full quarterly results, and markets typically use them to adjust expectations ahead of the official earnings release.

    How Investors Can Participate

    For investors looking to trade or accumulate positions in small finance bank stocks like Suryoday SFB, participation requires the basic market infrastructure: open a demat account with a SEBI-registered broker and, for active traders, a linked trading account to manage entries and exits around such news-driven moves.

    Given the intraday volatility that can accompany business-update announcements, risk management position sizing, stop-loss discipline and awareness of liquidity is as important as the headline numbers.

    Related Stock Market Insights

    Explore Trending Indices
    Bank Nifty Nifty Commodities
    BSE 100 BSE BANKEX
    BSE SENSEX BSE MIDCAP
    Nifty IT Nifty 100
    FINNIFTY Nifty Pharma
  • August Auto Sales: M&M Sales Jump 42%, Bajaj Up 28%

    August Auto Sales: M&M Sales Jump 42%, Bajaj Up 28%

    Indian automakers kicked off September by reporting strong August 2026 wholesale numbers, with Mahindra & Mahindra posting 42% overall growth and Bajaj Auto up 28%, as the sector heads into the festive season with SUV and two-wheeler demand running well ahead of last year.

    Mahindra & Mahindra Leads With SUV Strength

    Mahindra & Mahindra’s overall auto sales for August 2026 stood at 1,07,648 vehicles, a 42% year-on-year jump including exports. Within this, the utility vehicle segment sold 59,257 units domestically, up 50%, and 61,167 units including exports. Domestic commercial vehicle sales came in at 27,415 units, a 22% increase.

    Dr Velusamy R, President of Automotive Business at Mahindra & Mahindra, said demand remained strong across the portfolio, with the updated Scorpio-N and BE 6 SPORTEQ drawing a strong market response, and that the company expects to build on this momentum through the festive season.

    The scale of M&M’s growth stands out even against a broadly positive August for the industry. A 50% jump in domestic UV sales, in particular, points to sustained demand for SUVs, a segment that has been the primary growth engine for the Indian passenger vehicle industry over the past several years, as buyers have steadily traded up from smaller hatchbacks and sedans.

    Bajaj Auto And Two-Wheeler Makers Post Strong Growth

    Bajaj Auto reported a 28% jump in total sales to 5,35,764 units in August 2026, up from 4,17,616 units a year earlier. JSW MG Motor India posted a 14% year-on-year rise in wholesales to 7,508 units, compared with 6,578 units in August 2025. Two-wheelers remain the largest volume segment in the Indian auto market by unit count, so double-digit growth from a large player like Bajaj Auto is a meaningful signal for overall industry health heading into the festive quarter, which typically accounts for a disproportionate share of annual two-wheeler sales.

    August 2026 Sales At A Glance

    Company August 2026 Sales YoY Growth
    Mahindra & Mahindra (overall) 1,07,648 units +42%
    M&M Utility Vehicles (domestic) 59,257 units +50%
    M&M Commercial Vehicles (domestic) 27,415 units +22%
    Bajaj Auto (total) 5,35,764 units +28%
    JSW MG Motor India 7,508 units +14%
    Escorts Kubota (tractors, total) 10,072 units +19.1%
    SML Mahindra 1,175 units +40%

    Tractors And Commercial Vehicles

    Escorts Kubota’s agri-machinery business sold 10,072 tractors in August, up 19.1% from 8,456 units a year ago, with domestic tractor sales rising 20.5% to 9,523 units. Export tractor volumes were largely flat at 549 units against 554 units a year earlier. Tractor demand is closely tied to rural cash flows and monsoon performance, so a near-20% jump suggests reasonably healthy farm-sector sentiment heading into the second half of the fiscal year. Smaller commercial vehicle maker SML Mahindra reported a 40% jump in sales to 1,175 units, a smaller base but a similarly strong growth rate.

    Maruti Suzuki, Tata Motors Numbers Awaited

    Shares of Maruti Suzuki were trading around 1.4% lower ahead of the release of its August sales data, while investors also awaited numbers from Tata Motors, Hero MotoCorp, TVS Motor, Ashok Leyland and Eicher Motors, all of which were due to report their monthly business updates through the day. As India’s largest passenger vehicle maker by volume, Maruti Suzuki’s numbers are typically viewed as the bellwether for the broader passenger vehicle segment, and analysts will be comparing its August performance against the sharp growth already reported by M&M in the SUV category.

    Why This Matters For The Festive Season

    August sales figures are watched closely because they sit just ahead of India’s main festive buying period, when consumer purchase decisions typically accelerate. Manufacturers, dealers and analysts use these early wholesale numbers, vehicles dispatched from factories to dealerships, as a leading indicator of both current retail demand and dealer inventory positioning ahead of the peak selling window. A strong August, as reported by M&M, Bajaj Auto and the tractor makers, generally gives dealers confidence to build inventory for the festive period rather than staying conservative.

    Early numbers from M&M, Bajaj Auto and the tractor makers point to healthy underlying demand heading into that window, though a fuller sector picture will only emerge once the remaining large-cap auto names, including Maruti Suzuki and Tata Motors, which together account for a large share of India’s passenger vehicle market, report their own figures later in the day.

    Investors tracking the Nifty Auto index through the rest of the session can do so via an online trading platform, while anyone looking to act on today’s numbers directly in individual auto counters will need an active demat and trading account to place those trades.

    This report is for informational purposes only and does not constitute investment advice. Sales figures are as reported by the respective companies on September 1, 2026.

    Explore Trending Stocks
    Adani Enterprises Share Price Adani Green Energy Share Price
    Adani Power Share Price Aditya Infotech Share Price
    Ambuja Cement Share Price Apollo Tyres Share Price
    Asahi India Glass Share Price Reliance Industries Share Price
    Ather Energy Share Price Bajaj Finance Share Price
  • India economy outlook: RBI holds rates as markets eye inflation

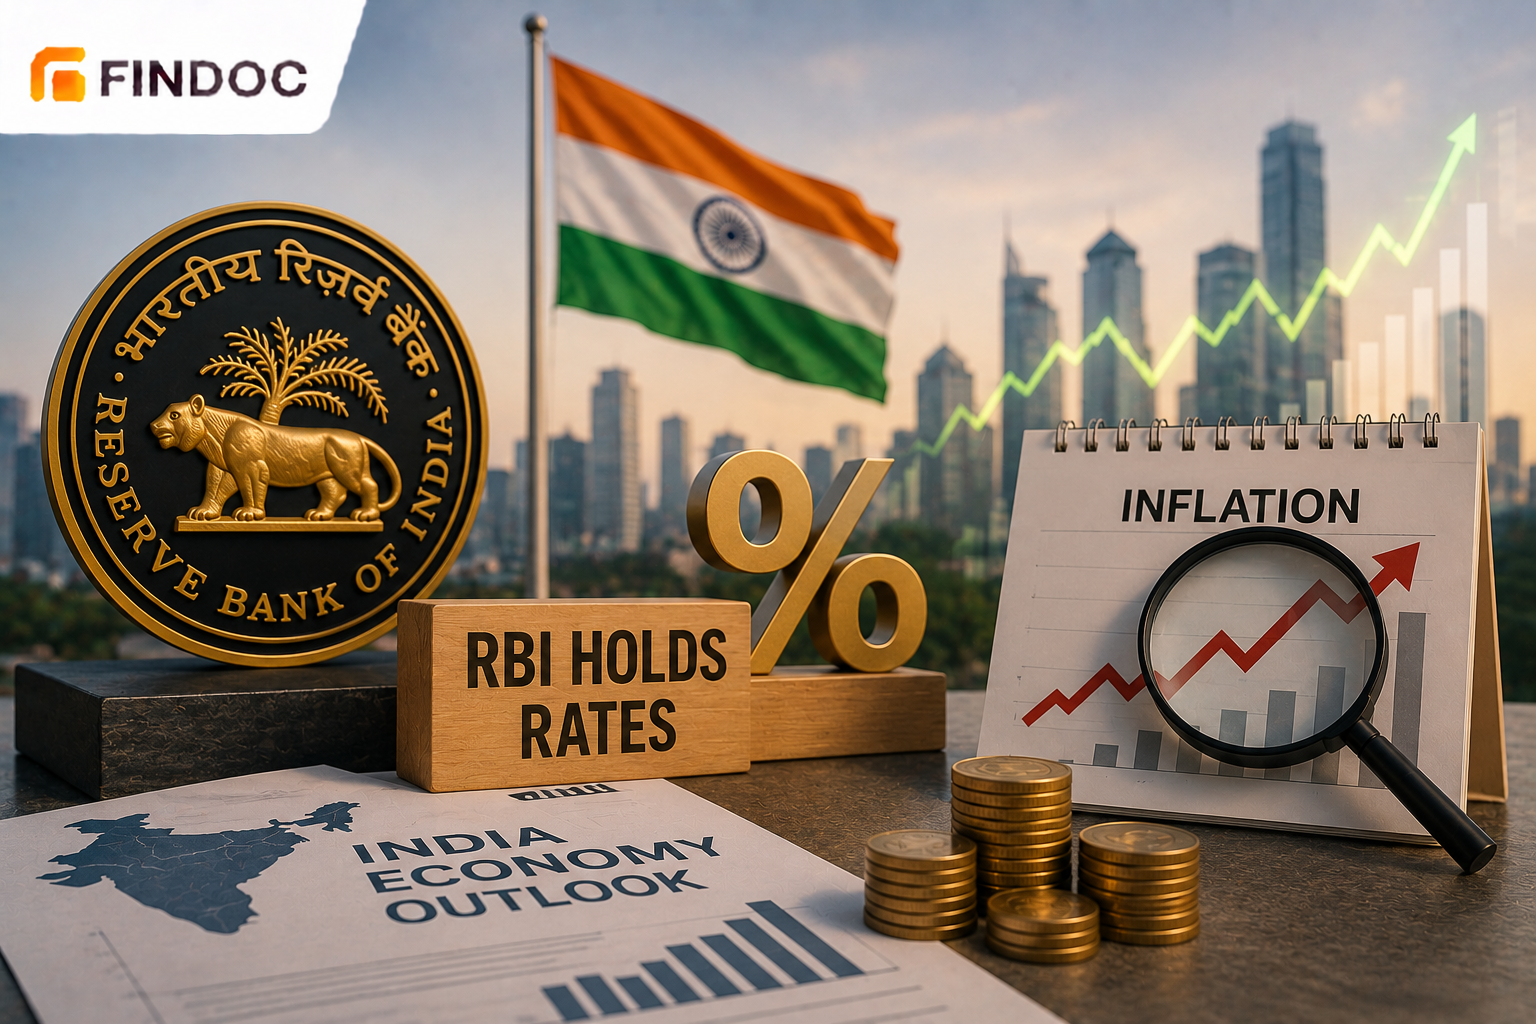
    India economy outlook: RBI holds rates as markets eye inflation

    India’s macroeconomic backdrop remains broadly supportive, with growth holding above 6% even as inflation risks persist and the Reserve Bank of India (RBI) maintains a cautious stance on rates. Real GDP projections for FY27 remain robust, but the central bank’s tolerance for price pressures is narrowing, making monetary policy, rupee stability, and global risk sentiment key drivers for domestic markets. Equity benchmarks are oscillating near record highs, reflecting resilience among large-cap financials and consumption names, even as foreign flows and commodity prices inject volatility into the near-term outlook.

    Key Highlights

    • RBI keeps repo rate unchanged at 5.25%, maintains neutral stance on liquidity
    • Real GDP growth for 2026-27 projected at 6.6% amid resilient domestic demand
    • CPI inflation for 2026-27 pegged at 5.1%, above the 4% medium-term target
    • Sensex and Nifty 50 recover from intraday lows as rupee stabilises and oil softens
    • Maharashtra, Tamil Nadu, Uttar Pradesh and Karnataka remain key growth engines by state GDP

    Macroeconomic Trends and RBI Monetary Policy

    The June Monetary Policy Committee (MPC) meeting underscored the RBI’s strategy of preserving growth while keeping a firm watch on inflation expectations. The policy repo rate was left unchanged at 5.25%, with the Marginal Standing Facility and Bank Rate held at 5.50% and the Standing Deposit Facility at 5.00%. The MPC reiterated a neutral stance, signalling flexibility in managing liquidity rather than committing to an explicit tightening or easing bias. The decision follows a series of steady policy meetings, underlining the RBI’s preference for stability in the current environment of mixed global cues and lingering supply-side price pressures.

    On growth, the RBI projects real GDP expansion of 6.6% for 2026-27, down marginally from an earlier estimate of 6.9%, but still signalling strong momentum relative to most major economies. The quarterly distribution — 6.6% in Q1, 6.3% in Q2, 6.5% in Q3 and 6.8% in Q4 — suggests an expectation of modest consolidation in the middle of the year followed by a pickup into the fiscal year-end, in line with typical investment and government spending cycles. Domestic consumption, public capex and a gradual recovery in private investment are assumed to remain the primary growth drivers, while net exports face headwinds from global demand softness.

    On prices, the RBI has projected CPI inflation for 2026-27 at 5.1%, implying that headline inflation will stay above the formal 4% target but within the 2-6% tolerance band. The central bank’s recent communication highlights food and fuel as key sources of risk, alongside imported inflation linked to currency movements and global commodity prices. This inflation profile, combined with robust but not overheated growth, argues for a prolonged pause rather than an imminent rate cut cycle. Several street economists now expect the RBI to be one of the last major central banks to ease policy rates, with many pencilling in a data-dependent, gradual normalisation rather than a sharp pivot.

    Policy Rate / Facility Rate
    Policy Repo Rate 5.25%
    Marginal Standing Facility / Bank Rate 5.50%
    Standing Deposit Facility 5.00%
    Real GDP Growth Projection (FY2026-27) 6.6%
    CPI Inflation Projection (FY2026-27) 5.1%

    Market Reaction, Rupee Dynamics and Sectoral Trends

    Equity markets have absorbed the RBI’s cautious stance with relative resilience. Recent trading sessions saw the Sensex rebound by roughly 400 points from intraday lows, while the Nifty 50 regained levels above 24,250, helped by a mix of local buying and easing concerns over global risk sentiment. The recovery has been broad-based, with financials, large-cap IT and select consumption stocks leading gains, although periodic profit-taking and rotation into defensives remain notable as investors weigh valuations against macro risks. Retail participation has grown significantly as access to a reliable trading platform has become more widespread, enabling a broader investor base to engage with these market movements in real time.

    Analysts attribute the market’s ability to pare losses to three main factors: a stabilising rupee, softer crude oil prices, and expectations that policy changes on capital gains for foreign portfolio investors (FPIs) in government securities could enhance foreign appetite for Indian assets. A more stable currency reduces imported inflation risk, while lower oil prices improve corporate margin visibility and the overall current account position. For FPIs, potential rationalisation of tax treatment on government securities would make rupee debt comparatively more attractive, particularly against the backdrop of India’s inclusion in major global bond indices.

    At the sectoral level, banking and financial services remain central to the macro narrative. Healthy credit growth, improving asset quality indicators, and adequate capital buffers position large private banks and select public sector lenders to benefit from sustained GDP expansion. Meanwhile, consumption-oriented companies in staples and discretionary segments are sensitive to inflation trajectories; elevated food prices or fuel costs could compress real incomes and temper volume growth, although middle- and upper-income demand remains resilient. Export-facing sectors such as IT and pharmaceuticals track global conditions more closely, with currency moves providing an additional lever for earnings. Domestic cyclical plays capital goods, cement, and infrastructure are anchored by the government’s continued focus on capex, even as private capex intentions remain somewhat uneven across industries.

    Growth Distribution, State GDP Data and Investor Watchpoints

    India’s aggregate growth story continues to be underpinned by a handful of large states with deep industrial and services bases. Recent data place Maharashtra at the top of the state GDP league table, with an economic output estimated at approximately ₹49.3 lakh crore, contributing around 13.46% of national GDP. Tamil Nadu, Uttar Pradesh and Karnataka follow, with GDPs of about ₹33 lakh crore, ₹30 lakh crore and ₹29 lakh crore respectively. For institutional investors, these regional dynamics matter in terms of infrastructure pipelines, urbanisation trends and state-level policy ecosystems that affect corporate earnings and project execution. Those looking to gain exposure to these growth themes can open demat account through SEBI-registered brokers to access listed instruments across relevant sectors.

    State Estimated State GDP Share of National GDP (Approx.)
    Maharashtra ₹49.3 lakh crore ~13.46%
    Tamil Nadu ₹33 lakh crore —
    Uttar Pradesh ₹30 lakh crore —
    Karnataka ₹29 lakh crore —

    Key areas for investors to watch in the coming months include:

    • Inflation path: The trajectory of CPI, particularly food and fuel components, will be crucial in shaping real consumption growth and the RBI’s room to manoeuvre on rates.
    • Rupee performance: Currency stability against the US dollar and other majors will influence imported inflation, FPI flows, and the relative attractiveness of Indian equities and bonds.
    • Policy signals: Any change in the RBI’s stance from neutral, alterations in liquidity management, or tax/regulatory measures affecting FPIs and domestic institutions could trigger re-pricing across asset classes.
    • Global backdrop: Developments in global monetary policy cycles, commodity prices, and geopolitical risks will continue to feed into risk sentiment, especially given India’s integration into global indices and portfolios.
    • State-level execution: Progress on large infrastructure projects, industrial policy initiatives, and fiscal positions of major states like Maharashtra, Tamil Nadu, Uttar Pradesh and Karnataka will shape medium-term corporate earnings trajectories, particularly in sectors such as construction, power, logistics, and manufacturing.

    Market Outlook

    Looking ahead, India’s economy appears positioned to remain one of the fastest-growing major markets, even as the balance of risks shifts more visibly towards inflation and global uncertainties. The OECD has recently reaffirmed this relative strength, projecting GDP growth of 7.6% for 2025-26, moderating to 6.1% in 2026-27 and 6.4% in 2027-28, in line with the RBI’s own medium-term view of sustained but gradually moderating expansion. For institutional investors, the key implication is that India is likely to offer a blend of growth and relative macro stability, albeit with pockets of volatility driven by global liquidity cycles, commodity swings and domestic policy adjustments.

    Monetary policy is likely to stay on hold in the near term, with the RBI prioritising credibility on inflation over aggressive growth support. This stance should help anchor expectations but could also restrain leverage-driven segments if borrowing costs remain elevated for longer. Equity valuations, particularly in frontline indices, already reflect a significant part of the growth narrative, which means active investors will need to discriminate sharply between sectors and stocks based on earnings visibility, balance sheet strength and sensitivity to interest rates and currency moves. A considered approach to stock investment in this environment requires careful analysis of both macro signals and company-level fundamentals.

    Conclusion

    For India-focused institutional investors, the current environment demands a nuanced approach. Macroeconomic indicators stable-to-strong GDP growth, controlled but above-target inflation, and a cautious RBI support a constructive medium-term view on Indian equities and credit, especially relative to many emerging market peers. At the same time, elevated valuation multiples in key indices, lingering inflation risks, and the possibility of episodic global risk-off events argue for disciplined portfolio construction and selective risk-taking.

    The most attractive opportunities are likely to emerge in areas where structural growth drivers intersect with improving balance sheets and regulatory support: high-quality financials, infrastructure-linked plays, and select consumption and manufacturing names leveraged to rising incomes and policy-led capex. Monitoring inflation data, RBI communication, rupee trends and fiscal signals from both the Centre and large states will be critical to calibrating exposure. In this backdrop, India remains a core allocation candidate in emerging market portfolios, but one that increasingly rewards investors who combine macro awareness with bottom-up rigour and a clear tolerance.

    Also Explore
    Top Gainers Today Top Losers Today
    Top Performers Under Performers
    Advances & Declines Heat Map
    ADR Prices Bulk Deals Today
    Penny Stocks Penny Stocks Under ₹1
  • Indian IT stocks under pressure as weak guidance tempers Q1 optimism

    Indian IT stocks under pressure as weak guidance tempers Q1 optimism

    India’s information technology majors opened the week on a cautious note, with investors weighing mixed Q1 earnings, soft FY27 guidance and an uncertain global demand environment against early signs of deal pipeline stabilisation. Large-cap IT stocks underperformed the broader market in early trade, even as upbeat results from Tech Mahindra last week had briefly lifted sentiment across the sector. With the rupee weakening, pricing power limited, and BFSI and tech spending in the US and Europe still uneven, institutional investors are reassessing positions in Infosys, TCS, Wipro, HCLTech and the broader Nifty IT basket.

    Key Highlights

    • Nifty IT underperforms frontline indices amid renewed concerns on FY27 growth and deal ramp-ups
    • Infosys, TCS, Wipro and HCLTech trade mixed after soft commentary and cautious guidance from tier-I peers
    • Tech Mahindra Q1 beat on revenue and margins offers a rare positive surprise in an otherwise muted earnings season
    • Rupee weakness past 96 against the US dollar offers near-term margin support but underscores macro risk
    • Budget proposal to expand safe harbour thresholds to ₹2,000 crore seen as structurally positive for Indian IT services

    Indian IT Sector: Cautious Sentiment Despite Selective Q1 Beats

    In early trade, Indian equity benchmarks slipped, with the Sensex down over 450 points and the Nifty 50 dragged lower primarily by financials, even as IT stocks, which had helped drive gains late last week, showed signs of fatigue. Recent market action suggests that the short-lived rally triggered by better-than-expected numbers from Tech Mahindra and select mid-cap IT names is giving way to a more sober reassessment of the earnings and demand cycle across the sector.

    Analysts tracking tier-I IT firms warn that the current financial year is unlikely to deliver a decisive turnaround. Several brokerages have indicated that leading services providers may struggle even to reach the mid-point of their FY27 growth guidance, reflecting a softer-than-expected demand outlook for the first half of the year. Commentaries from global clients continue to point to prolonged decision cycles, delayed ramp-ups and ongoing cost-optimisation priorities, especially in key verticals such as BFSI, retail and hi-tech.

    The macro backdrop is adding another layer of complexity. The rupee has weakened, recently logging its sharpest weekly drop since May, as elevated crude prices and strong merchant dollar demand revive concerns about India’s external balances. A softer currency typically supports operating margins for export-heavy IT firms, but it also signals broader risk aversion and raises the risk of near-term equity volatility. For IT, this means a modest FX tailwind to earnings, but little relief on the fundamental question of when discretionary tech spending will fully normalise. Retail participation has grown significantly as access to a reliable trading platform has become more widespread, bringing greater scrutiny to sector-level developments such as these.

    Stock-Specific Moves: Infosys, TCS, Wipro and HCLTech in Focus

    Investors in Infosys, TCS, Wipro and HCLTech are parsing early Q1 trends and peer prints for clues on the rest of the year. While detailed Q1 numbers from these four bellwethers are staggered through the ongoing earnings season, commentary from managements and sell-side analysts suggests a continuation of the pattern seen over the past 18–24 months: relatively resilient large outsourcing and cost-takeout deals, but persistent weakness in high-margin discretionary projects and transformation programmes.

    Tech Mahindra has been the standout among large-cap IT names so far this season. The company reported a consolidated net profit of around ₹1,465 crore for the first quarter, up approximately 28% year-on-year and over 8% sequentially. Revenue from operations grew about 18% on a year-on-year basis to roughly ₹15,712 crore, reflecting a broad-based recovery across key verticals and geographies. The margin and growth beat has prompted some analysts to argue that the worst may be over for telecom and enterprise-focused portfolios, although they caution that sustainability will hinge on deal conversions and execution over the next two quarters.

    In contrast, Wipro’s print has been more measured, reinforcing the theme of gradual, rather than sharp, improvement. The company posted a modest 1% year-on-year rise in June-quarter net profit to about ₹3,352 crore, while revenue grew 11%. The numbers are not weak in absolute terms, but for a stock that has derated materially from its pandemic-era highs, investors are looking for clearer evidence of operating leverage, better utilisation and stronger commentary on large deal inflows. For Infosys, TCS and HCLTech, the street focus in the immediate term is on:

    • Growth in key verticals such as BFSI, manufacturing and hi-tech
    • Net new large deal total contract value (TCV) and the timing of ramp-ups
    • Commentary on pricing, wage-cost management and pyramid optimisation
    • Any revisions to FY27 revenue and margin guidance bands

    Large-Cap Indian IT: Relative Positioning and Key Metrics

    Below is a comparative snapshot of key tier-I Indian IT services players, focusing on how institutional investors are currently framing the trade across each name in the context of stock investment decisions within Indian equities.

    Company Current Market Positioning Key Watch Factors
    Infosys High-beta play on demand recovery; strong capabilities in digital and cloud but higher sensitivity to discretionary spending cuts Stabilisation in large North American client budgets; improvement in margin band discipline
    Tata Consultancy Services (TCS) Sector bellwether with the most diversified client base and relatively stable execution metrics Premium valuation supported by consistency of payout, lower volatility and strong order book visibility
    Wipro In the midst of a multi-year portfolio and operational reset; valuation at a discount to top-tier peers Proof of sustainable growth inflection beyond cost actions
    HCLTech Beneficiary of strong engineering and infrastructure services credentials Resilience via annuity and product-linked revenues in a slow discretionary environment
    Tech Mahindra Q1 performance marks a notable positive surprise after a period of underperformance and client-specific challenges Potential re-rating contingent on sustaining double-digit revenue growth and margin expansion

    From a sector perspective, Nifty IT remains highly sensitive to global risk sentiment, particularly US tech earnings and macro data that shape enterprise IT budgets. Elevated volatility in US tech indices, combined with heightened investor scrutiny of AI-related capex and returns, is feeding into Indian IT valuations. While the structural story around AI, cloud and digital remains intact, the near-term is dominated by questions around when AI-related deal flow will scale meaningfully enough to offset pressure in legacy and discretionary segments.

    Market Outlook: What Institutional Investors Should Watch

    For Indian IT, the next two quarters will be critical in determining whether FY27 turns out to be a transition year or the beginning of a more durable upcycle. Key data points for institutional investors include:

    • Large deal TCV and conversion rates at Infosys, TCS, Wipro and HCLTech, especially in the $100 million-plus segment
    • The trajectory of US and European macro indicators, including recession probabilities, which directly influence discretionary tech budgets
    • Management commentary on AI and automation-led deals, including monetisation models and impact on pricing and margins
    • Currency trends and any Reserve Bank of India signals on liquidity and interest rates that may influence capital flows into Indian equities

    Structurally, the recent Union Budget proposal to raise the safe harbour threshold for eligible IT services from ₹300 crore to ₹2,000 crore is viewed as a positive for compliance certainty and ease of doing business, especially for mid-sized and captive service units. Investors looking to participate in this segment can open demat account through SEBI-registered brokers to access listed IT securities on Indian exchanges. Over the medium term, such policy support, combined with India’s cost and talent advantages, should help the sector defend its global market share even in a slower growth environment.

    Conclusion

    Indian IT remains at a complex juncture: valuations have corrected from peak levels, offering selective entry opportunities, but the earnings recovery is still uneven and highly contingent on global capex cycles. Large caps such as Infosys, TCS, Wipro and HCLTech provide liquidity and relative safety, yet differentiation will increasingly hinge on execution in AI, cloud, engineering and platform-based services. For institutional investors, the message from the latest numbers and commentary is clear: this is a stock-picking market within Indian tech, not a blanket sector trade. Monitoring deal wins, guidance credibility and margin discipline will be crucial in separating potential compounders from value traps in the next phase of the IT cycle.

    Explore IT Stocks
    Coforge Share Price LTM Share Price
    Mphasis Share Price Oracle Finl. Service Share Price
    Persistent Systems Share Price Info Edge (India) Share Price
    Mindtree Share Price Larsen & Toubro Share Price
    Netweb Technologies Share Price KPIT Technologies Share Price
  • Oil price spike puts spotlight on India’s energy earnings and policy

    Oil price spike puts spotlight on India’s energy earnings and policy

    A renewed surge in crude oil prices and robust quarterly earnings from Reliance Industries have refocused market attention on India’s energy complex, just as geopolitical tensions escalate and domestic demand remains resilient. With Brent trading higher on supply concerns, Indian refiners, upstream producers and gas utilities are navigating a complex mix of margin tailwinds, export levies and regulatory overhangs. For institutional investors, the sector now sits at the intersection of earnings upgrades, policy risk, and potential inflation pressure for the Reserve Bank of India (RBI) and the rupee.

    Key Highlights

    • Reliance Industries’ Q1 FY27 energy EBITDA rebounds sharply on strong refining margins.
    • Brokerages turn more bullish on RIL, with upside targets of 35–40% from current levels.
    • Crude spike raises margin prospects for refiners but increases risk of fuel price intervention.
    • ONGC and upstream plays gain from higher realizations but face subsidy and windfall-tax uncertainty.
    • Energy equities drive sectoral leadership on Nifty and Sensex, but volatility remains elevated.

    Energy Earnings Drive Indian Market Leadership

    Reliance Industries has emerged as the bellwether for India’s energy narrative this earnings season, with its oil-to-chemicals (O2C) and exploration & production businesses posting a strong rebound in profitability in Q1 FY27. Motilal Oswal highlighted that consolidated EBITDA rose 8% quarter-on-quarter to roughly INR 4,75,000 crore (INR 475 billion), an 11% year-on-year expansion and ahead of their estimate of INR 4,61,000 crore, driven by a strong rebound in energy (O2C + E&P) profitability. On a recurring basis, other broker estimates peg quarterly EBITDA at a record around INR 54,067 crore, up about 10% year-on-year, underlining the role of energy in powering overall group earnings.

    A detailed review of segment performance shows that Reliance’s O2C EBITDA grew in the high-teens sequentially, supported by resilient refining margins and product spreads despite volatility in crude benchmarks. Analysts noted that O2C segment EBITDA grew about 17% quarter-on-quarter, while oil and gas EBITDA rose around 19%, offsetting relative softness in retail earnings. Profit after tax for the quarter has been reported in the INR 23,000–23,200 crore range, representing a mid-single-digit year-on-year growth, even as the base was elevated. This earnings momentum in core energy businesses has led several foreign and domestic brokerages to reiterate overweight calls on the stock.

    On the market side, Reliance shares were trading around INR 1,327–1,330 in morning trade on Monday, largely flat versus the previous close, as investors digested the Q1 print and awaited management commentary on capex and policy developments. Some global houses see substantial upside from current levels: Goldman Sachs reportedly projects up to 41% potential upside, while domestic brokerage targets centre around INR 1,550, citing improving energy margins and continued strength in digital services. Reliance remains the single largest weight on both the Nifty 50 and the Sensex, and its energy-driven beat is supporting sectoral sentiment even as broader indices open with a slight negative bias amid weak global cues and higher crude. Investors looking to participate in this market movement can open demat account through SEBI-registered brokers to access energy sector equities.

    Oil Price Dynamics, ONGC and Policy Risks

    The latest uptick in crude prices, linked in part to escalating US–Iran tensions and supply anxieties, has had an immediate impact on Indian market expectations. Pre-market commentary suggests Nifty opening largely flat to marginally negative, with support zones identified at 24,300 and 24,190, and resistance at 24,385 and 24,480. For the energy sector, the crude move remains a double-edged sword: it tends to support gross refining margins and upstream realizations, while raising the spectre of fuel price-control measures, higher windfall taxes, and imported inflation that could complicate RBI’s rate path and weigh on INR.

    For upstream heavyweights such as Oil and Natural Gas Corporation (ONGC), higher crude and gas prices typically translate into better realizations and improved cash flows. However, past cycles have shown that government decisions on windfall profit taxes, export duties and subsidy-sharing for under-recoveries can materially alter the earnings trajectory, especially when global prices spike sharply. Recent commentary around Reliance’s O2C performance noted that export levies and the potential return of China as a large buyer in the oil market could complicate sourcing strategies and margin management for Indian refiners, underscoring that the current earnings tailwind is not without risk.

    The refining complex in India, led by Reliance, Indian Oil Corporation, Bharat Petroleum Corporation and Hindustan Petroleum Corporation, benefits from strong demand for middle distillates and petrochemicals both domestically and in export markets. Reliance’s latest quarter shows that refining flexibility and complex configuration allowed it to grow O2C earnings despite crude supply pressures. Yet, any aggressive rise in domestic pump prices could trigger consumer backlash and pressure on the government to reintroduce or tighten price caps. Equally, the Ministry of Finance has in previous episodes adjusted special duties on export of diesel, petrol and aviation turbine fuel to temper domestic inflation, a risk that remains on the radar as Brent trades higher.

    From a macro standpoint, sustained high crude prices can feed into India’s current account deficit and imported inflation, compelling the RBI to maintain a relatively hawkish stance on liquidity and rates. That in turn affects equity valuations, particularly for capital-intensive energy and infrastructure names. Currency markets also react sensitively; a widening energy import bill can exert depreciation pressure on INR, though so far the rupee has been buffered by strong services exports and steady capital flows. Institutional investors are therefore watching the interplay between oil prices, energy earnings, RBI commentary and INR trajectory to calibrate their positioning across the Nifty Energy basket and related sectors.

    Energy Sector: Key Drivers and Investor Watchpoints

    The following table provides a structured overview of the key drivers and risk factors across major segments of India’s listed energy sector.

    Segment Key Companies Current Drivers Key Risks
    Integrated Energy (O2C + E&P) Reliance Industries Record recurring EBITDA ~INR 54,000 crore in Q1 FY27; O2C and E&P EBITDA up mid- to high-teens sequentially Export levies, crude supply disruptions, policy intervention on fuel pricing
    Upstream Producers ONGC, Oil India Higher crude realizations; improved gas price formula outcomes Windfall profit taxes, subsidy-sharing obligations with OMCs
    Oil Marketing Companies (OMCs) IOC, BPCL, HPCL Refining spreads; domestic petrol and diesel marketing margins Pump price controls, export duties if crude remains elevated
    Gas and Utilities GAIL, City Gas Distributors Structural policy push towards cleaner fuels; domestic gas allocation benefits LNG import price volatility; near-term earnings tied to global gas benchmarks

    From a macro and policy overlay perspective, the Brent and LNG price trajectory remains the primary determinant of margin outlook across the entire energy value chain. The RBI’s inflation and rate stance, given higher energy input costs, continues to influence sector valuations and INR movement, adding a layer of complexity to stock investment decisions within the Nifty Energy basket.

    Market Outlook

    Looking ahead, the Indian energy sector presents a nuanced mix of cyclical upside and structural uncertainty. On the cyclical side, strong refining margins, recovering petrochemical spreads and firm upstream realizations are driving earnings upgrades, as evidenced by Reliance’s Q1 beat and improved energy segment profitability. Brokerages remain overweight on large integrated players, expecting continued strength into Q2 FY27 provided crude remains within a manageable band and product spreads stay favourable.

    However, investors must closely monitor three key variables. First, the trajectory of global crude and gas prices in the wake of Middle East tensions and OPEC+ decisions; a sharp and prolonged spike would raise the probability of domestic policy intervention and higher export levies. Second, the RBI’s evolving stance on inflation, liquidity and policy rates; sustained energy-driven price pressures could delay any easing and compress valuation multiples for capital-heavy names. Third, rupee dynamics and capital flows; any combination of a wider current account deficit and risk-off global sentiment could amplify volatility in energy equities, especially those with large foreign institutional ownership.

    For diversified portfolios, overweight exposure to integrated energy plays like Reliance, balanced with selective positions in upstream producers and gas utilities, appears to be the preferred institutional strategy at this stage. That strategy, however, needs to be actively managed against policy announcements on fuel pricing and taxation, as well as global developments that may alter commodity curves. Access to a reliable trading platform has become increasingly important for institutional and retail participants managing dynamic positions across this segment.

    Conclusion

    India’s energy sector has moved back to the centre of the market narrative, powered by strong earnings prints from its largest private-sector player and a renewed spike in global crude prices. Reliance Industries’ Q1 FY27 performance underlines the earnings leverage embedded in complex refining and integrated energy operations, even in a period of supply disruption and policy uncertainty. At the same time, the sector sits squarely within the macro policy zone: higher oil can quickly translate into inflation pressure, currency risk, and regulatory intervention.

    For institutional investors in the Indian market, energy is no longer a pure commodity bet but a multidimensional theme spanning corporate strategy, government policy, RBI decisions and global geopolitical developments. Tracking earnings revisions, policy signals on fuel taxation, RBI communications and INR movements will be essential for navigating the sector through the remainder of FY27.

    Check Nifty Energy Stocks
    Adani Power Share Price NTPC Share Price
    Coal India Share Price Power Grid Corpn. Share Price
    Bharat Heavy Elect. Share Price Siemens Share Price
    Tata Power Share Price JSW Energy Share Price
    NHPC Share Price Suzlon Energy Share Price
  • Equirus AM: Large-Cap India Stocks Offer Favourable

    Equirus AM: Large-Cap India Stocks Offer Favourable

    Ashutosh Tiwari, Managing Director and Chief Investment Officer for Public Equities at Equirus Asset Management, has stated that large-cap Indian equities present a favourable risk-reward opportunity from a medium-term perspective. His comments come at a time when global geopolitical dynamics are shifting rapidly and commodity prices remain in flux. Tiwari’s outlook reflects cautious optimism rather than unbridled enthusiasm, grounding his view in valuation and macro fundamentals.

    What Changed

    Equirus Asset Management has publicly signalled a constructive stance on Indian large-cap stocks. This marks a notable shift in tone compared to the more defensive positioning many institutional managers adopted earlier in 2026. The firm believes current valuations in the large-cap segment are reasonable, especially when weighed against improving earnings visibility and moderating inflationary pressures.

    Factor Previous Outlook Current Position
    Large-Cap Valuations Stretched / Cautious Reasonable / Favourable
    Geopolitical Risk Elevated uncertainty Evolving but manageable
    Commodity Prices Inflationary pressure Moderating trend
    Earnings Visibility Limited near-term clarity Improving medium-term outlook


    Why It Matters for Investors

    Institutional views from experienced fund managers carry weight in shaping market sentiment. When a senior CIO publicly reaffirms confidence in large-cap equities, it often signals that professional money managers are positioning for medium-term gains. For retail participants looking to align with institutional thinking, this commentary provides meaningful directional guidance.

    In addition, the emphasis on risk-reward rather than outright bullishness is important. Tiwari is not dismissing risks. Instead, he is suggesting that the balance has tilted in favour of investors willing to hold quality large-caps over a medium-term horizon. For anyone looking to open demat account online and begin building an equity portfolio, understanding this institutional perspective helps frame entry decisions more precisely.

    Potential Financial Impact

    Specific portfolio allocations, fund performance data, and target return figures were not disclosed. However, a favourable risk-reward assessment typically precedes increased institutional inflows into the large-cap segment. If fund managers act on this view collectively, it could support valuations in Nifty 50 and Nifty 100 constituents over the next two to four quarters.

    Moderating commodity prices, if sustained, could also expand operating margins for manufacturing, consumer goods, and infrastructure companies. Therefore, earnings upgrades in these sectors remain a plausible outcome if input cost trends persist.

    Expert or Market Reaction

    Tiwari’s statement aligns with a broader consensus emerging among select Indian fund managers in mid-2026. Several domestic institutional investors have been gradually increasing their large-cap exposure after a period of relative caution. Meanwhile, foreign institutional investor (FII) flows into Indian equities have shown intermittent improvement, though the trend remains uneven due to global macro uncertainty.

    The acknowledgment of geopolitical dynamics as an evolving rather than static risk is noteworthy. It suggests that Equirus Asset Management views current global tensions as partially priced into markets, rather than representing a fresh downside catalyst.

    Broader Context

    Indian equities have navigated a complex macro environment through the first half of 2026. Global interest rate trajectories, currency movements, and energy price volatility have all influenced market behaviour. Large-cap stocks, by virtue of their stronger balance sheets and earnings resilience, have generally outperformed mid and small caps during periods of uncertainty.

    Market Segment Risk Profile Typical Institutional Preference During Uncertainty
    Large-Cap Equities Lower relative risk Higher preference
    Mid-Cap Equities Moderate risk Selective preference
    Small-Cap Equities Higher risk Reduced preference

    As a result, the current commentary from Equirus AM reinforces what market data has already been suggesting that large-caps remain the preferred hunting ground for institutional capital in uncertain times.

    Key Risks and Factors to Consider

    Despite the constructive outlook, several risks deserve careful attention. Geopolitical developments can escalate unpredictably, and commodity prices can reverse quickly. Both scenarios would challenge the assumptions underlying this favourable risk-reward assessment.

    • Valuation risk: If earnings growth disappoints, current valuations may appear less attractive.
    • Commodity price reversal: A resurgence in oil or metals prices could pressure corporate margins.
    • Geopolitical escalation: Renewed global tensions could trigger FII outflows from emerging markets.
    • Regulatory changes: Domestic policy shifts in taxation or sector-specific regulation could affect earnings.
    • Execution risk: Companies must deliver on earnings expectations to justify institutional confidence.

    What Investors Should Watch Next

    • Quarterly earnings results from Nifty 50 companies for Q1 FY27, which will test the earnings visibility argument.
    • Commodity price trends, particularly crude oil and base metals, over the next 60 to 90 days.
    • FII flow data from SEBI and stock exchanges for signs of sustained institutional re-entry into Indian large-caps.
    • Any geopolitical developments that could materially alter global risk appetite or supply chains.
    • Investors using a top stock market trading and investing platform should monitor fund flow dashboards and sectoral indices closely for confirmation of this institutional trend.

    Conclusion

    Equirus Asset Management’s publicly stated view adds to growing institutional confidence in Indian large-cap equities. The medium-term risk-reward framing is measured and grounded. However, this optimism is conditional on commodity price stability and manageable geopolitical risks both of which remain fluid.

    Investors should treat this as one data point within a broader research process. Monitoring earnings outcomes and macro indicators in the coming months will be essential before drawing firm conclusions about the durability of this opportunity.

    • Key Takeaway 1: Equirus AM’s CIO sees favourable risk-reward in Indian large-caps from a medium-term perspective, driven by reasonable valuations and moderating commodity prices.
    • Key Takeaway 2: Geopolitical dynamics remain a key variable any escalation could quickly alter the risk calculus for equity investors.
    • Key Takeaway 3: Earnings delivery in Q1 FY27 will serve as the most critical near-term test of this constructive institutional outlook.
    Also Check Trending Indices
    Nifty 500 Companies Nifty Smallcap 250
    Nifty Midcap Select Nifty Midcap 50 Companies
    NIFTY MIDCAP 100 Companies Nifty Pharma Companies
    BSE 500 Companies Nifty Smallcap 100 Companies
    BSE 100 Companies BSE MIDCAP Companies
  • Haryana RERA Orders Godrej to Deliver Delayed Flats

    Haryana RERA Orders Godrej to Deliver Delayed Flats

    The Haryana Real Estate Regulatory Authority (RERA) has directed Godrej Properties to hand over possession of delayed residential units to homebuyers. The authority has also ordered the developer to pay interest for the period of delay. This ruling marks a significant regulatory intervention in one of Haryana’s prominent residential projects.

    What Changed

    Haryana RERA issued a formal order requiring Godrej Properties to complete the handover of pending flat possessions. In addition, the developer must compensate affected buyers with interest payments for the delay period. The order follows complaints filed by homebuyers who had been waiting beyond their originally committed possession dates.

    Parameter Details
    Regulatory Authority Haryana RERA
    Developer Godrej Properties
    Order Type Possession handover + interest payment
    Project Location Haryana
    Deal/Penalty Value Not disclosed
    Number of Units Affected Not disclosed


    Why It Matters for Investors and Homebuyers

    This ruling directly affects buyers who had invested capital and were awaiting possession. Delayed deliveries create financial strain for homebuyers managing both rent and EMI payments simultaneously. The RERA order provides them with a legally enforceable path to resolution.

    For investors tracking listed real estate stocks, regulatory actions against large developers carry reputational and financial weight. Godrej Properties is a publicly listed company, and such orders can influence market sentiment around the stock. Investors who want to track such regulatory developments closely and act on market movements may consider whether to open demat account online to access real-time updates and trading flexibility.

    However, the order also signals that India’s RERA framework is functioning as intended. Regulatory enforcement builds long-term trust in the sector. This is ultimately positive for genuine investors and serious homebuyers.

    Potential Financial Impact

    The financial impact on Godrej Properties includes the cost of interest payments owed to buyers, potential legal expenses, and indirect costs related to project completion. The exact monetary value of the interest liability has not been disclosed publicly. Delays can also trigger additional RERA penalties if the developer fails to comply with the order within stipulated timeframes.

    For the buyer side, interest compensation partially offsets holding costs. However, it does not fully recover the opportunity cost of capital blocked for an extended period.

    Expert or Market Reaction

    Market observers note that enforcement actions by state RERA bodies have become more frequent and more assertive in recent years. Haryana RERA has built a reputation for actively pursuing delayed project complaints. This case reinforces that trend.

    Real estate analysts point out that even large, reputed developers face execution risk on large-scale projects. Supply chain disruptions, labour shortages, and approval delays can all contribute to timeline overruns. As a result, buyers and investors are advised to track RERA complaint databases before committing to under-construction properties.

    Broader Context

    Delivery delays remain a systemic challenge in India’s residential real estate market. Despite the RERA Act being in force since 2016, a significant backlog of stalled or delayed projects continues to affect homebuyers across multiple states. Haryana, given its proximity to Delhi and high development activity, has seen a large volume of such complaints.

    Context Factor Implication
    RERA enforcement trend Increasing regulatory assertiveness
    Haryana real estate market High demand, high complaint volume
    Listed developer exposure Regulatory orders affect stock sentiment
    Buyer recourse mechanism RERA provides enforceable legal remedy

    Meanwhile, Godrej Properties remains one of India’s largest listed developers by market capitalisation. The company has an extensive pan-India project pipeline. This individual order, while significant for affected buyers, represents one case within a much larger portfolio.

    Key Risks and Factors to Consider

    Several risks remain relevant for stakeholders following this case. Compliance timelines can stretch if the developer appeals the RERA order before an appellate tribunal. Legal proceedings can further delay actual possession handover for affected buyers.

    • Compliance risk: Developer may appeal, extending the resolution timeline.
    • Financial risk: Undisclosed interest liability could be material depending on the number of units and delay duration.
    • Reputational risk: Public enforcement orders impact brand perception, particularly for premium segment developers.
    • Construction risk: Underlying causes of delay, if unresolved, may affect other projects in the pipeline.
    • Market risk: Continued enforcement actions across projects could dampen investor confidence in the stock short term.

    What Readers Should Watch Next

    • Whether Godrej Properties complies with the order within the RERA-mandated timeline or files an appeal.
    • The total interest payout amount once officially disclosed by the authority or the company.
    • Any impact on Godrej Properties’ stock price following wider coverage of this regulatory order.
    • Further RERA complaints or orders related to other Haryana projects by the developer.
    • Investors using a top stock market trading and investing platform should monitor listed developer stocks for sentiment shifts driven by regulatory actions.

    Conclusion

    The Haryana RERA order against Godrej Properties underscores the growing accountability framework shaping India’s residential real estate sector. For homebuyers, it offers legal relief and a formal mechanism to recover delayed possession with interest. For investors, it serves as a reminder that execution risk exists even for large, reputed developers.

    The broader message is clear. Regulatory bodies are actively enforcing buyer protections. This trend strengthens the long-term credibility of the RERA framework. Stakeholders should continue monitoring compliance outcomes and any appellate developments in this case.

    • RERA enforcement is strengthening: Haryana RERA’s directive against Godrej Properties reflects increasing regulatory assertiveness in protecting homebuyer rights.
    • Financial liability remains undisclosed: The exact interest payout and number of affected units have not been made public, making the full financial impact unclear.
    • Investor attention warranted: Regulatory orders on listed developers can affect short-term stock sentiment and merit close monitoring by market participants.
    Explore Market Indices
    Nifty 500 Companies Nifty Smallcap 250 Companies
    Nifty Midcap Select Companies BSE SmallCap Companies
    BSE Largecap Comapnies BSE MIDCAP Companies
    BSE BANKEX Companies BSE 500 Companies
    BSE 100 Companies Nifty Midcap 150 Companies
  • BSE NSE Closed May 1 2026: Maharashtra Day Holiday

    BSE NSE Closed May 1 2026: Maharashtra Day Holiday

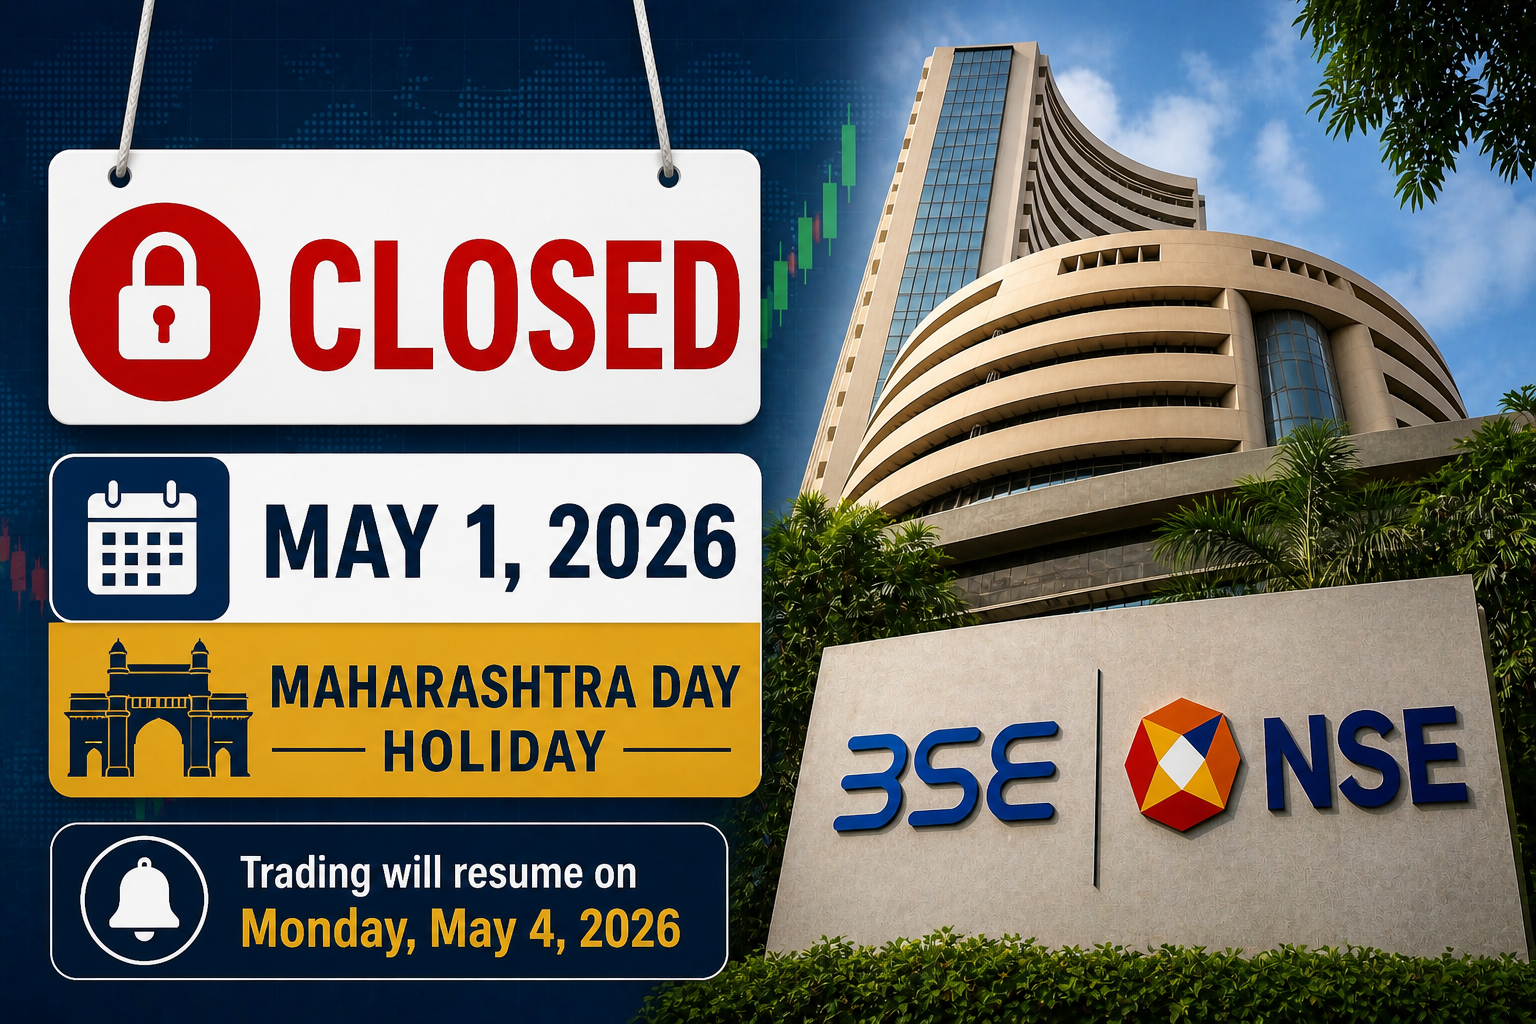
    Indian stock markets, including BSE and NSE, are fully closed today, Friday, May 1, 2026, for Maharashtra Day and Labour Day, halting all equity, derivatives, and currency trading sessions. This observance shortens the trading week, with markets resuming on Monday, May 4, 2026.

    MCX offers limited evening trading for select commodities, while NCDEX remains shut. Investors should review positions and plan for post-holiday liquidity amid ongoing global uncertainties influencing INR flows and sectoral indices like Nifty Bank and Sensex.

    Key Highlights

    • BSE and NSE closed across all segments: equity, equity derivatives, currency derivatives, interest rate derivatives, and SLB.
    • MCX partial operations: evening session only for select non-agri commodities from 5:00 PM to 11:30/11:55 PM IST.
    • NCDEX full closure: no trading in agri commodities or derivatives.
    • Markets reopen May 4, 2026: normal Muhurat trading schedule expected, with focus on settlement obligations.
    • Next holiday: May 28, 2026, for Bakri Id, impacting weekly expiry cycles.

    Stock Markets Closed Today: BSE NSE Shut on May 1 for Maharashtra Day Labour Day

    BSE and NSE trading is completely halted today, May 1, 2026, across equity, F&O, currency, and debt segments, as per annual holiday calendars approved by SEBI and exchanges. This full-day closure aligns with Maharashtra Day and International Labour Day, observed nationwide but rooted in state-specific significance.

    MCX permits a restricted evening session for non-ferrous metals, bullion, and energy, starting post-5:00 PM IST, while NCDEX skips operations entirely. Trading resumes May 4, 2026, marking the start of a critical week for derivatives settlements and index rebalancing.

    Investors can prepare by open demat account online via SEBI-registered brokers for seamless post-holiday participation, ensuring CDSL or NSDL connectivity.

    Key Highlights

    • BSE Sensex and NSE Nifty 50 segments: full closure, no order placement or execution.
    • Derivatives markets: equity F&O, currency, and interest rate segments non-operational, delaying weekly expiries to May 4.
    • Commodity exchanges: MCX evening window limited to select contracts like gold, silver, crude oil; NCDEX closed for agri derivatives.
    • Settlement implications: T+1 cycle unaffected for prior trades, but fresh positions roll to May 4; monitor RBI liquidity for FII flows.
    • Resumption on May 4: expect heightened volatility in banking, IT, and metals amid global cues from US Fed stability and oil dynamics.

    This structured pause underscores SEBI’s emphasis on uniform holiday observance, allowing market participants to assess portfolios without intraday pressures. Historical data shows post-holiday opens often see 0.5-1% Nifty swings, driven by accumulated global news.

    Trading Schedule Impact

    May 2026 features multiple holidays compressing trading days, influencing liquidity and expiry concentrations. BSE and NSE align calendars, with MCX and NCDEX varying for commodity specifics.

    Date Occasion BSE/NSE Status MCX/NCDEX Notes
    May 1 Maharashtra Day/Labour Day Full closure MCX evening select; NCDEX closed
    May 28 Bakri Id Full closure MCX/NCDEX closed
    June 26 Muharram Full closure MCX partial; NCDEX closed

    Derivatives traders note shifted weekly expiries; for instance, Bank Nifty options settle May 4 instead of today, potentially amplifying gamma exposure. Currency derivatives face similar delays, with USDINR pairs sensitive to RBI interventions amid INR depreciation pressures from global oil shocks.

    Equity settlements proceed via T+1, but reduced days heighten focus on high-frequency trading adjustments. Commodity positions on MCX benefit from evening access, aiding hedges in gold and crude amid geopolitical tensions.

    Investor Impact

    Today’s closure shortens the week to three trading days, limiting fresh equity entries and amplifying liquidity risks for large-cap names like Reliance Industries and HDFC Bank. Derivatives participants face deferred rolls, with open interest buildup possible on May 4 open, echoing patterns from prior Labour Day halts.

    MCX evening session supports commodity adjustments, crucial for agri and metal hedgers tracking NCDEX-aligned contracts.

    India observes 16 stock market holidays annually, per BSE/NSE lists, balancing cultural observances with trading efficiency. This setup, SEBI-mandated, prevents fragmented liquidity while aligning with global norms. Investors weigh opportunities in shortened volatility against risks of overnight global shifts, such as US index records influencing FII positioning in Nifty IT.

    What to Do Next

    Review open positions across equity and F&O via broker statements, confirming margin adequacy for May 4 volatility. Set price alerts on Nifty 50, Bank Nifty, and sectoral indices to capture resumption gaps. Platforms offering low-latency execution aid efficient order placement post-holiday.

    For new entrants, explore the best stock trading and investing platform in India compliant with SEBI norms, ensuring robust API and mobile access. Monitor NSE/BSE circulars for any unscheduled adjustments, prioritizing risk management over aggressive positioning.

    Full 2026 Stock Market Holiday List

    Remaining holidays post-May 1 total eight, per BSE/NSE calendars, aiding year-long planning:

    • May 28: Bakri Id (full closure)
    • June 26: Muharram (full closure)
    • July 7: Rath Yatra (full closure)
    • August 11: Independence Day (full closure)
    • September 17: Ganesh Chaturthi (full closure)
    • October 2: Mahatma Gandhi Birthday (full closure)
    • October 21: Diwali Laxmi Pujan (full closure)
    • November 26: Gurunanak Jayanti (proposed, subject to confirmation)

    These dates cluster in festive seasons, compressing Q3/Q4 trading volumes.

    Why This Holiday Matters for Maharashtra

    Maharashtra Day commemorates the state’s 1960 formation via linguistic reorganization, observed annually on May 1 alongside International Labour Day honoring workers’ rights. BSE and NSE, headquartered in Mumbai, mandatorily close, reflecting regional roots in India’s financial capital.

    This dual observance ensures inclusive participation, with SEBI standardizing for nationwide equity access.

    Outlook

    Post-holiday trading on May 4 may reflect accumulated global cues, including stable US Fed rates and commodity pressures, influencing INR stability and FII flows into large-caps. Shortened weeks heighten focus on RBI liquidity measures, with neutral implications for sectoral rotations in metals and energy amid oil volatility.

    Conclusion

    Markets’ May 1 closure provides a strategic pause for position reviews and planning. Resumption on May 4 demands disciplined execution, leveraging SEBI-compliant tools for informed navigation of compressed sessions and settlement cycles. Stay aligned with exchange updates for optimal preparedness.

    Trending Stocks
    IRFC Share Price NHPC Share Price
    Infinity Infoway Share Price Adani Power Share Price
    Hyundai India Share Price Suzlon Energy Share Price
    Reliance Industries Share Price Adani Enterprises Share Price
    Bharat Electronics Share Price SBI Share Price
  • PNGS Reva Diamond Jewelry IPO 2026: Issue Details, Price Band, GMP & Review

    PNGS Reva Diamond Jewelry IPO 2026: Issue Details, Price Band, GMP & Review

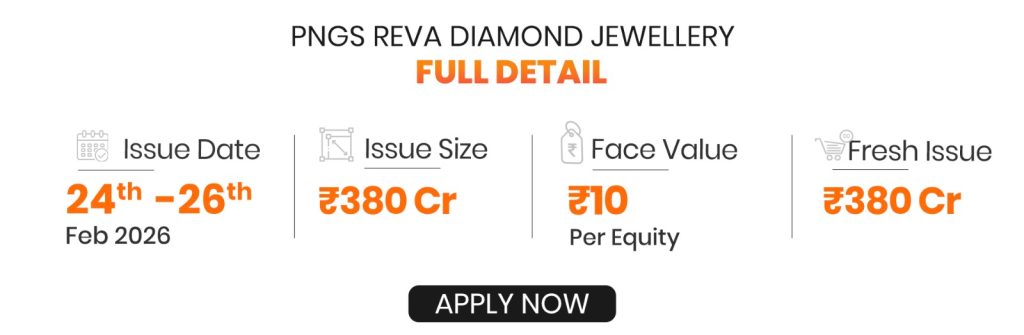
    PNGS Reva Diamond IPO price has caught most investors’ attention as the company wants to raise ₹380 crore through a fresh issue. The funds will support expansion plans and marketing initiatives. This affordable diamond jewelry brand, backed by the P.N. Gadgil & Sons, has shown remarkable performance. The company boasts a PAT margin of 30.84% and an exceptional ROE of 78.89%.

    Investors should know several key details about the PNGS Reva Diamond IPO. The IPO subscription starts on February 24 and ends on February 26. The allotment finalization will happen on February 27, followed by listing on March 3. While not comparable to a Revain IPO in Nasdaq, this RNG IPO price presents a good chance in India’s jewelry market.

    PNGS Reva’s smart market strategy offers pure diamond pieces starting at just ₹10,000, making luxury available to more customers. The company’s plans include launching its Reva collection before Valentine’s Day in 2025 to tap into festive sales. The gray market premium (GMP) will be a significant indicator for investors. A positive GMP hints at potential listing gains, while a negative one could mean listing at a discount.

    Investors tracking post-listing performance can monitor the PNGS Reva Diamond Share Price for real-time updates and valuation movement after listing.

    What makes PNGS Reva Diamond IPO stand out in 2026? The PNGS Reva Diamond IPO stands out in the busy 2026 market with its unique strategic position and strong brand heritage. The diamond-focused brand launched in February 2025 shows a calculated entry into India’s growing affordable luxury jewelry segment.

    Affordable luxury positioning makes Reva’s market strategy distinctive. You can buy pure diamond pieces starting at just ₹10,000, which opens doors for first-time diamond buyers and positions the brand strongly within India’s evolving premium jewelry segment.

    Also Read: What is IPO?

    What Makes PNGS Reva Diamond IPO Stand Out in 2026?

    The PNGS Reva Diamond IPO stands out in the busy 2026 market with its unique strategic position and strong brand heritage. The diamond-focused brand launched in February 2025 shows a calculated entry into India’s growing affordable luxury jewelry segment.

    Investors who wish to participate in this public issue during the subscription window can review the offer details and proceed with their application below.

    Affordable Luxury Positioning

    Reva’s market strategy makes diamond jewelry available to more customers through smart pricing. You can buy pure diamond pieces starting at just ₹10,000, which opens doors for first-time diamond buyers. This pricing lets Reva reach customers who thought diamond jewelry was too expensive.

    The brand smartly markets itself as “affordable luxury” instead of just “affordable jewelry” to keep its premium image despite lower prices. Their products cover various categories like diamond rings, earrings, bracelets, sets, and necklace sets. The brand also lets customers customize pieces to match their style priorities.

    The timing of marketing campaigns has been vital to Reva’s position. The brand launched its collection right before Valentine’s Day 2025 to boost gift purchases. They offered zero making charges during the launch to attract new customers. These seasonal offers show how well Reva understands when people buy jewelry.

    This smart pricing and promotion strategy helps Reva target customers who want branded jewelry without high prices. A gross profit margin of 26.67% shows this affordable luxury approach works financially.

    Backed by Trusted Brand P.N. Gadgil & Sons

    The most important advantage for the PNGS Reva Diamond IPO is its connection to P.N. Gadgil & Sons, a jewelry institution trusted by customers for over 190 years. This rich heritage gives Reva instant credibility in a market where trust drives purchases.

    P.N. Gadgil & Sons transferred its diamond business to PNGS Reva Diamond Jewelry through a strategic slump sale in January 2025. This move lets Reva work independently while using its parent company’s brand value and strong operations. The P.N. Gadgil & Sons connection helps build customer loyalty, improve supply chains, and grow faster.

    This partnership goes beyond branding into retail presence. PNGS Reva Diamond Jewelry runs 34 stores in Maharashtra, Karnataka, and Gujarat. All but one of these stores operate inside existing P.N. Gadgil & Sons locations. This setup gives Reva retail presence without spending heavily on new stores.

    The company uses multiple operational models:

    • Company Owned Company Operated (COCO)
    • Franchise Owned Company Operated (FOCO)
    • Franchise Owned Franchise Operated (FOFO)

    This flexible approach helps quick expansion while you retain control over the brand. The company knows how to operate in cities of all sizes in its main markets, which builds efficiency and community trust.

    The PNGS Reva Diamond IPO offers more than just another jewelry market investment. Investors get a chance to back a brand with smart pricing and support from a 190-year jewelry legacy, something rare in today’s Indian retail world.

    Read in Details: How to Meet the IPO Eligibility Criteria?

    How does the Reva Brand Plan to Disrupt the Diamond Market?

    PNGS Reva Diamond Jewelry has created a fresh approach to challenge India’s traditional diamond market. The brand launched in February 2025 to capture market share by solving the biggest problems and meeting needs in the premium jewelry segment.

    Modern Designs at ₹10,000+ Price Points

    Reva has positioned itself in the affordable luxury segment by offering pure diamond jewelry starting at just ₹10,000. This pricing makes diamond jewelry accessible to more people who thought diamonds were out of their reach.

    The company showcases a wide collection with contemporary designs that appeal to urban and millennial consumers. Their products include:

    • Rings and earrings
    • Necklaces and pendants
    • Solitaires
    • Bangles and bracelets
    • Mangalsutra and nose rings
    • Chains

    The brand has created 13 unique jewelry collections as of September 2025. In-house design teams work with carefully selected third-party manufacturers and artisans to develop these collections. Each piece blends tradition with modern elements while staying elegant and authentic.

    Zero Making Charges and Festive Targeting

    Reva made a bold move by introducing zero making charges during its launch. This strategy tackles one of the major costs in traditional jewelry pricing that adds substantial markup to final prices and often confuses buyers.

    The brand’s launch just before Valentine’s Day 2025 came with waived making charges until February 16, 2025. This smart timing shows Reva understands how gift-buying occasions bring new customers to diamond jewelry.

    The company’s marketing goes beyond Valentine’s Day to target wedding seasons and festivals when jewelry sales peak in India. This seasonal approach helps build brand awareness during high-interest periods.

    These promotions help first-time diamond buyers overcome their hesitation by reducing both cost and psychological barriers. Customers can also customize pieces across collections to match their priorities.

    Tier-1 and Tier-2 City Expansion

    The company will use ₹286.56 crore from IPO proceeds to open 15 new brand-exclusive stores. This growth plan targets Tier-1 cities while learning about opportunities in Tier-2 locations across Maharashtra and other metro cities in India.

    Early 2026 data shows PNGS Reva Diamond Jewelry runs 34 stores across Maharashtra, Karnataka, and Gujarat. All but one of these stores are shop-in-shop formats within P.N. Gadgil & Sons retail stores. The exception operates under the Company Owned Company Operated (COCO) model.

    The company’s knowledge of Tier-1, Tier-2, and Tier-3 cities helps improve operational efficiency. This focused presence allows better logistics, inventory management, and store operations. The expansion strategy utilizes this regional expertise while entering new promising markets.

    The company plans to spend ₹35.40 crore from IPO proceeds on marketing for these new stores. This investment will improve local brand awareness and help Reva connect with communities as it grows.

    Reva combines asset-light shop-in-shop models (FOCO/FOFO) with strategic standalone stores to grow faster while maintaining consistent brand experience. This balanced growth strategy helps the company benefit from India’s jewelry retail consolidation trends.

    Why is the ₹380 Cr IPO being Launched Now?

    PNGS Reva Diamond’s ₹380 crore IPO comes at a perfect time in India’s jewelry market. The public offering starts February 24 and runs through February 26, 2026. This move aims to raise capital with clear goals in mind.

    Timing with Wedding and Festive Season

    The company picked the perfect moment for its IPO during India’s peak jewelry buying season. PNGS Reva launched its diamond collection right before Valentine’s Day 2025. This smart move built brand awareness before going public. Their timing shows they understand when people buy gifts.

    Their H1 FY26 revenue hit ₹157 crore thanks to strong festive and wedding season sales. These numbers prove the brand knows how to tap into seasonal buying spikes across India.

    PNGS Reva’s IPO fits perfectly with their business plan of targeting special occasions. They launched their collection before Valentine’s Day and offered zero making charges. This strategy shows they know when customers are most likely to buy. The IPO follows this same smart thinking – launch when market interest peaks.

    The anchor book opens February 23, letting big investors get in just as retail interest builds. This timing helps grab attention when jewelry sales typically surge.

    Capitalizing on Premiumisation Trend in Jewelry

    The ₹380 crore from this IPO will go toward riding the premium wave in India’s jewelry market:

    • ₹286.56 crore (75.4%) to open 15 brand-exclusive stores
    • ₹35.40 crore (9.3%) for marketing campaigns
    • The rest for general business needs

    This split shows PNGS Reva sees how customer priorities are changing. The jewelry market keeps growing as pieces become everyday wear rather than special occasion items. Simple chains, rings, and bracelets are now daily fashion must-haves that create year-round sales.

    The best reason for this IPO’s timing links to market growth factors. Higher incomes, city growth, and more spending have created the perfect setting for premium jewelry brands. The organized diamond jewelry market looks set to grow 16-17% yearly.

    Diamond jewelry offers the best growth potential in the premium segment. PNGS Reva sells pure diamond pieces starting at ₹10,000 with modern designs. This puts them in a great spot to benefit from market changes.

    The IPO structure tells us more about their funding approach: 75% for qualified institutional buyers, 15% for non-institutional investors, and 10% for retail investors. This setup focuses on getting long-term institutional money to support their growth plans.

    Their expansion targets Tier-1 cities first, while carefully picking Tier-2 spots in Maharashtra and other metro areas across India. These locations match areas where premium jewelry sales are growing fastest.

    PNGS Reva’s IPO combines short-term seasonal opportunities with long-term market trends. By raising money now, they can capture both festival sales and the bigger shift toward premium jewelry in India.

    Read Also: Things You Should Know Before Investing in IPO

    How Strong is PNGS Reva’s Financial Foundation?

    Financial performance drives any IPO investment case. PNGS Reva’s numbers tell a compelling story of strategic growth and operational efficiency that supports the PNGS Reva Diamond IPO price.

    Revenue and PAT Growth over 3 Years

    PNGS Reva Diamond Jewelry’s financial journey shows steady progress over recent fiscal periods. The company started as an offshoot of the P.N. Gadgil & Sons brand and showed remarkable financial progress after focusing solely on diamond jewelry.

    Revenue reached ₹157 crore in H1 FY26, which shows strong growth momentum before its public offering. These numbers stand out, especially given the economic climate affecting consumer spending.

    The company’s operational efficiency shines through its Profit After Tax (PAT) figures, with a 30.84% PAT margin – an exceptional number in retail jewelry. This profitability puts PNGS Reva ahead of its peers and gives investors confidence in its business model.

    Strong revenue growth matches the company’s push into new markets and its focus on affordable luxury. Unlike typical png ipo reviews, PNGS Reva’s story centers on making profit while keeping prices available to customers.

    Net Worth Turnaround Post Slump Sale

    January 2025 marked a turning point in PNGS Reva’s progress when P.N. Gadgil & Sons sold its diamond business to PNGS Reva Diamond Jewelry through a strategic slump sale. This move reshaped the company’s balance sheet and business focus.

    The sale let PNGS Reva run independently while keeping its parent company’s brand value and infrastructure. This showed up as a big boost in the company’s net worth, creating a stronger base for future growth.

    Smart timing of this deal just before the Valentine’s Day 2025 collection launch helped PNGS Reva tap into seasonal sales with better financial structure. Investors comparing this to a Revain IPO in nasdaq should note that PNGS Reva’s financial moves target the Indian jewelry market rather than tech sector.

    After restructuring, the company’s capital efficiency improved significantly. Return on Net Worth (RoNW) hit 78.89%, showing how well the company uses shareholder money to generate returns.

    EBITDA and Margin Trends

    PNGS Reva’s EBITDA numbers prove its operational strength. A 26.67% gross profit margin shows healthy product-level profits while maintaining affordable luxury status.

    The margin structure reveals several advantages:

    • Shop-in-shop model cuts overhead costs (33 of 34 stores)
    • Smart inventory management in focused areas
    • Targeted seasonal marketing keeps costs down
    • Working efficiently with parent company P.N. Gadgil & Sons

    These advantages help maintain margins despite price competition in diamond jewelry. The rng ipo price depends on many factors, but EBITDA trends point to a business model that stays profitable in different market conditions.

    The company plans to use ₹286.56 crore from IPO funds to open 15 brand-exclusive stores, aiming to boost margins through bigger retail presence and brand control. Another ₹35.40 crore will go to marketing, balancing growth with profit protection.

    PNGS Reva’s financial foundation rests on strong fundamentals – high profitability, smart capital use, and healthy margins. IPO investors can clearly see how operational performance backs the company’s value and growth plans.

    What do Valuation Metrics Reveal about Investment Potential?

    Understanding valuation metrics gives us vital insights into the PNGS Reva diamond IPO price and its investment potential. A detailed analysis of key financial ratios shows how the company matches up against other players in the Indian jewelry market.

    RoNW and EPS vs Peers

    PNGS Reva Diamond Jewelry’s valuation analysis shows remarkable efficiency metrics compared to industry peers. The company has an impressive Return on Net Worth (RoNW) of 59.36%, which is nowhere near what its competitors achieve. This exceptional capital efficiency is way ahead of Thangamayil Jewelry (24.99%), Tribhovandas Bhimji Zaveri (9.05%), and Senco Gold (13.26%).

    Earnings Per Share (EPS) is a vital indicator of profitability. PNGS Reva has a Basic and Diluted EPS of ₹35.21, making it second only to Thangamayil’s ₹44.91 among its peers. This metric alone doesn’t paint the complete picture without looking at corresponding valuation multiples.

    The company shows superior operational efficiency with Return on Equity (ROE) at 59.4% and Return on Capital Employed (ROCE) at 80.5%. These numbers prove its better asset utilization and operational effectiveness compared to industry standards.

    We can’t make direct valuation comparisons since PNGS Reva doesn’t have a defined Price-to-Earnings (P/E) ratio yet. All the same, peer P/E ratios—Senco Gold (14.48×), TBZ (23.58×), and Thangamayil (41.24×)—help establish a potential valuation framework.

    NAV and Debt-equity Ratio

    Net Asset Value (NAV) gives us fundamental insight into book value per share. Different sources show conflicting data. One reliable source states PNGS Reva’s NAV at ₹45.82 per share, while another shows ₹206.19. The ₹45.82 figure seems more accurate based on source reliability.

    Peer companies have much higher NAVs: Thangamayil (₹179.74), Senco Gold (₹175.74), and TBZ (₹90.14). PNGS Reva’s lower NAV could mean either growth potential or overvaluation, depending on future performance.

    The company has a healthy debt-equity ratio of 0.37, which shows financial prudence and a strong balance sheet. This conservative leverage position means there’s room to expand without too much financial burden. A PAT margin of 23.04% and EBITDA margin of 41.81% further prove its operational strength.

    Comparison with Senco Gold, TBZ, Thangamayil

    A detailed peer analysis reveals PNGS Reva’s competitive position:

    This comparison clarifies several investment points. PNGS Reva gets better returns on invested capital, as shown by its industry-leading RoNW. Its revenue base is much smaller than other players, which suggests significant room to grow if execution works out.

    The company’s financial profile stands out from typical jewelry retailers. Thangamayil has slightly higher EPS but needs nearly 15× PNGS Reva’s revenue to achieve it. This efficiency shows PNGS Reva’s streamlined business model and capital-light approach.

    The PNG IPO review through valuation metrics shows a company with exceptional profitability ratios but relatively small scale. Investors might see substantial returns if the company executes its expansion strategy well, quite different from a Revain IPO in Nasdaq that focuses more on technology metrics than financial efficiency.

    What are the Risks Investors should Consider?

    Investors looking at the PNGS Reva Diamond IPO price should carefully consider several key risks that could affect its future performance. The attractive valuations tell only part of the story – there are important challenges that need a closer look.

    Execution Risk in Store Rollout

    The life-blood of PNGS Reva’s growth strategy lies in setting up 15 brand-exclusive stores to boost its market position and revenue. This ambitious expansion comes with substantial risks. The company might face higher costs and delays as it enters the highly competitive retail jewelry sector. PNGS Reva, just a few months old (since December 2024), still needs to build its brand identity and depends heavily on its parent promoter group’s systems and operations.

    The company’s current scale remains small with revenue of about ₹258 crore compared to older players in the industry. Sales and brand relevance could take a hit if new designs don’t line up with changing customer priorities. Poor inventory management or supply delays could lead to either empty shelves or excess stock, which would hurt operational efficiency.

    Geographic Concentration in Maharashtra

    The biggest problem in the PNG IPO analysis comes from PNGS Reva’s heavy focus on one region. Maharashtra accounts for 97% of FY25 revenue, making the company vulnerable to regional disruptions. Even more worrying, just five stores generate 44% of total revenue.

    The company runs stores in Maharashtra, Gujarat, and Karnataka, but this limited presence leaves it exposed to local economic downturns. Plans to expand mainly in Maharashtra will likely increase this concentration. Unlike a Revain IPO on NASDAQ that could reach global markets, PNGS Reva’s geographic limits might restrict its growth potential.

    Volatility in Gold/Diamond Prices

    The RNG IPO price faces substantial commodity risks. Raw materials make up 65-70% of total costs, so profits are nowhere near stable when gold and diamond prices fluctuate. The typically thin margins in jewelry retail make this worse.

    Lab-grown diamonds are becoming popular and could threaten natural diamond demand, which might affect pricing, margins, and long-term growth. The industry also faces stricter rules like hallmarking and traceability requirements, adding pressure in a market where 58% remains unorganized.

    Seasonal sales patterns add another risk factor. Any drop in sales during key festive or wedding seasons could substantially impact yearly financial results.

    What is the Latest GMP and Market Sentiment?

    Market participants are keeping a close eye on PNGS Reva Diamond Jewelry IPO’s Gray Market Premium (GMP) before its subscription period. The IPO will open on February 24 and close on February 26, 2026. Unofficial trading circles have already shown interest ahead of the launch.

    Gray Market Premium (GMP) Trends

    Latest unofficial reports show PNGS Reva Diamond IPO GMP at around ₹10 per share. Early market participants seem optimistic about the listing potential, as shown by this positive premium. The GMP acts as an unofficial indicator of investor interest before official subscriptions start.

    The current premium shows gray market activity before the actual listing. Market demand and sentiment can make the GMP fluctuate a lot. These early figures might change by a lot as we get closer to the IPO dates.

    The PNGS reva diamond ipo price and GMP trends don’t guarantee listing performance. Final subscription numbers across investor categories will determine the actual listing gains.

    Subscription Status Updates

    Daily updates on PNGS Reva Diamond’s subscription status will start once bidding opens on February 24. The IPO has specific allocation quotas for different investor groups:

    • Qualified Institutional Buyers (QIB): Financial institutions, banks, FIIs, and mutual funds
    • Non-Institutional Investors (NII): Individual investors, NRIs, companies, and trusts
    • Retail Individual Investors (RII): Regular retail investors

    This mainboard IPO will list on both BSE and NSE, unlike a Revain IPO in Nasdaq. Investors can track up-to-the-minute bidding information through designated platforms once subscription begins.

    The IPO allotment will be finalized on Friday, February 27, 2026. Investors should receive their credited shares by March 2, 2026. The company plans to list on Wednesday, March 4, 2026.

    Retail and HNI Interest Levels

    Subscription numbers will reveal interest levels across investor categories. Png ipo reviews suggest investors should look at QIB, NII, and retail subscription numbers before making their decision.

    The rng ipo price tends to relate to institutional interest during the subscription period. Subscription trends often show dramatic improvements on the final day compared to the original responses.

    GMP tracking and subscription status help predict potential listing performance. Financial experts suggest looking at this IPO as a long-term investment rather than focusing only on listing gains.

    How can Investors Apply and Track Allotment?

    PNGS Reva Diamond IPO welcomes prospective investors through multiple digital platforms. The subscription window starts February 24 and ends February 26, 2026. Investors must have an active demat account to apply, and those without one can open demat account online to participate in the IPO through these platforms.

    Application Process via UPI/ASBA

    Investors have two payment options – UPI or ASBA. Here’s how you can apply online:

    1. Access your broker account or bank’s net banking portal
    2. Find the IPO section and select PNGS Reva Diamond Jewelry
    3. Fill in your bid details and UPI ID
    4. Submit your application form
    5. Confirm the mandate request on your UPI app

    The bank ASBA facility remains available until 5 PM on February 26, 2026, and provides another application route.

    Lot Size and Retail Limits

    Official channels will soon announce the exact lot size details. Retail investors typically get to apply between one and 13 lots. Your total application amount depends on the final PNGS Reva Diamond IPO price multiplied by the chosen lot size.

    Allotment Date and Refund Process

    The IPO allotment results will be ready by February 27, 2026. Successful applicants will receive their shares in their demat accounts by March 2, while unsuccessful applicants will get their refunds processed the same day.

    You can check your IPO allotment status through these three options:

    • Bigshare Services (the registrar) website using your application details
    • BSE website with your application number or PAN
    • NSE website using your application number or PAN

    The refund process starts March 2, 2026, and shares will list on the exchange between March 3-4, 2026.

    Conclusion

    PNGS Reva Diamond Jewelry IPO gives investors a fresh way to enter the Indian jewelry market. The company stands out by offering affordable luxury with pure diamond pieces starting at just ₹10,000. Their numbers tell an impressive story – a PAT margin of 30.84% and ROE of 78.89% show how well they run their business.

    The brand draws strength from its 190-year connection with P.N. Gadgil & Sons, which gives it a clear edge in the market. PNGS Reva’s blend of trusted heritage and modern designs creates a bridge between old values and new styles. While their shop-in-shop model works well now, they want to open 15 brand-exclusive stores using IPO funds.

    Smart investors should think over some risk factors before jumping in. The biggest problem is geographic concentration – 97% of revenue comes from Maharashtra. The planned store expansion could face hurdles that might slow growth. Raw materials make up 65-70% of total costs, so changes in gold and diamond prices could affect profit margins.

    The market seems cautiously positive with a Gray Market Premium of about ₹10 per share. Investors will watch the allotment date of February 27, 2026, and listing on March 3-4 closely. Those who get shares will see them in their accounts by March 2.

    PNGS Reva Diamond Jewelry makes a strong but complex investment case. The company’s solid finances and market position point to good growth ahead. Yet wise investors will balance these chances against the risks. Anyone thinking of investing should assess their risk comfort and time horizon rather than just focusing on listing gains. This IPO shows how traditional jewelry businesses can adapt to changing customer priorities while staying profitable in a competitive market.

    Frequently Asked Questions

    PNGS Reva offers affordable luxury diamond jewelry starting at ₹10,000, backed by the 190-year legacy of P.N. Gadgil & Sons. Their strategic positioning and strong financial metrics, including a 30.84% PAT margin and 78.89% ROE, set them apart in the competitive jewelry market.

    The company plans to use ₹286.56 crore from the ₹380 crore IPO to establish 15 new brand-exclusive stores. Additionally, ₹35.40 crore will be allocated for marketing and promotional activities, with the remaining funds used for general corporate purposes.

    Major risks include execution challenges in the planned store rollout, high geographic concentration with 97% of revenue from Maharashtra, and potential volatility in gold and diamond prices affecting profit margins.

    Investors can apply through UPI or ASBA methods via their broker accounts or bank’s net banking portals. The subscription window is from February 24 to February 26, 2026, with a cutoff time of 5 PM on the closing date.

    The tentative listing date for PNGS Reva Diamond Jewelry shares is set for Wednesday, March 4, 2026, on both BSE and NSE. Allotment finalization is scheduled for February 27, with share credits expected by March 2, 2026.

    Disclaimer: This blog is intended solely for educational and informational purposes and should not be construed as investment advice or a recommendation. While efforts have been made to ensure the accuracy and reliability of the information and data presented, no representation or warranty, express or implied, is made regarding its completeness or correctness. Readers are advised to independently verify all information and consult a qualified financial advisor before making any investment decisions. Investments in the securities market are subject to market risks. Please read all relevant offer documents and disclosures carefully before investing.,


  • Fractal Analytics IPO: Latest GMP, Price Band & Should You Invest in 2026?

    Fractal Analytics IPO: Latest GMP, Price Band & Should You Invest in 2026?

    The gray market premium (gmpipo) for Fractal Analytics IPO shows strong investor interest as shares trade at a premium of ₹182 over the upper band price. This AI and analytics powerhouse plans to launch a major book-built IPO worth ₹2,833.90 crore. The offering includes fresh equity shares of ₹1,023.50 crore and an offer for sale of ₹1,810.40 crore.

    The Fractal Analytics IPO share price ranges between ₹857 and ₹900 per share[-2], making it one of India’s biggest tech offerings in 2026. The company’s client base includes more than 100 Fortune 500 companies from sectors of all types including BFSI, CPG, retail, healthcare, tech, and media. Fractal Analytics’ SEBI filings showcase remarkable financial growth, with PAT jumping by 503.29% from -₹54.70 crores in March 2024 to ₹220.60 crores in March 2025. Let’s take a closer look at the Fractal Analytics IPO India listing, its GMP trends, company fundamentals, and help you decide if this chance lines up with your portfolio goals.

    IPO Details and Timeline

    Fractal Analytics just announced its IPO schedule, marking one of the biggest tech offerings on the Indian stock market this February. Here are all the key details about this highly awaited public issue.

    Issue size and share breakdown

    The company’s IPO is a massive book-built issue worth ₹2,833.90 crore. It combines two parts – they will issue fresh shares worth ₹1,023.5 crore and sell existing shares (OFS) worth ₹1,810.4 crore. This setup helps the company raise money while letting current investors cash out their investments. The fresh issue will create 1.14 crore new equity shares, and the OFS will sell 2.01 crore existing shares. The company’s DRHP shows this balanced fundraising approach will strengthen their balance sheet and let early investors get returns on their money.

    Price band and lot size

    You can buy Fractal Analytics’ shares between ₹857 and ₹900 each, with each share’s face value at ₹1. This puts the company’s value at about ₹15,500 crore. Regular retail investors need to buy at least 1 lot of 16 shares, which means putting in ₹14,400 at the higher price. Small non-institutional investors must get at least 14 lots (224 shares), costing ₹2,01,600. Large non-institutional investors need 70 lots minimum (1,120 shares), which comes to ₹10,08,000.

    Subscription and allotment dates

    The subscription window starts Monday, February 9, 2026, and ends Wednesday, February 11, 2026.Eligible investors planning to participate during the issue window can Apply Now through the IPO platform. The company has laid out clear next steps:

    • Basis of Allotment Finalization: Thursday, February 12, 2026
    • Refund Initiation: Friday, February 13, 2026
    • Credit of Shares to Demat Accounts: Friday, February 13, 2026

    Investors will know their allotment status just one day after subscriptions close. The company will divide shares based on SEBI rules – retail investors get 10%, non-institutional investors get 15%, and qualified institutional buyers get 75%.

    Listing date and stock exchanges

    The SEBI-approved listing happens Monday, February 16, 2026. You’ll find the shares listed on both the Bombay Stock Exchange (BSE) and National Stock Exchange (NSE). The gray market shows strong investor interest, with shares trading at a 10% premium. This hints at possible gains on listing day for lucky applicants. Right now, the GMP is about ₹93 above the highest price, showing market confidence in this AI analytics company’s public debut.

    Gray Market Premium (GMP) Insights

    Investors are happy to track unofficial gray market prices for Fractal Analytics IPO as the listing date gets closer. Here’s what the latest gmpipo trends mean for potential investors.

    Current GMP and listing expectations

    The fractal analytics ipo gmp shows mixed readings across different market trackers as of February 6, 2026. Most reliable sources show the current GMP is around ₹93-99 per share. This points to an estimated listing price between ₹993 and ₹999, based on the upper price band of ₹900. Investors could see potential listing gains of 10.33-11%. All the same, some trackers share more conservative numbers. InvestorGain quotes a GMP of ₹57, which points to a lower estimated listing price of ₹957 with a 6.33% gain. The positive premium shows that markets expect this AI-focused company to list above par.

    GMP movement over recent days

    The fractal analytics ipo gmp has shown substantial changes in the days before its public offering:

    • February 3-4: GMP reached ₹180-182, pointing to a potential listing price of ₹1,082 with expected upside of nearly 20.22%
    • February 4: GMP peaked at ₹165 before it started falling
    • February 5: Premium dropped to around ₹90
    • February 6: More consolidation with most sources showing GMP between ₹57-99[121]

    The gray market premium has cooled down compared to the early excitement when the price band was first announced. The shares had a premium of up to 21% in the unregulated market. This shows the high original interest that has now settled.

    What GMP indicates about investor sentiment

    Gray market premium works as an unofficial gage of how investors feel about an upcoming public offering. The positive GMP for fractal analytics ipo india shows that investors think the stock will list higher than its issue price. Fractal Analytics is India’s first pure-play AI company to go public. The steady positive GMP reflects market excitement for AI-driven businesses in today’s investment scene.

    The premium has dropped from its peak but stays positive, which shows steady investor interest. This reflects their confidence in Fractal’s place in the global generative AI cycle and better profits. Swastika Investment Ltd gave it a ‘Subscribe’ rating. They believe the valuation premium makes sense given the company’s AI-focused business model.

    The fractal analytics ipo sebi filings point out that gray market data is unofficial and based on speculation rather than regulated market activity[113]. IPO experts warn that GMP can change quickly. Making investment choices based only on gray market premiums can be risky. Yes, it is true that “GMP is not regulated or recommended by stock exchanges or SEBI”.

    Company Fundamentals and Business Model

    Fractal Analytics, a 25-year old trailblazing force in the enterprise AI world, started its journey in 2000. The company’s gmpipo performance shows strong investor interest, backed by a sophisticated business model. Let’s get into what makes this AI powerhouse successful.

    AI and analytics services offered

    Fractal Analytics operates as a pure-play enterprise data, analytics, and artificial intelligence (DAAI) company. The market value stands at approximately ₹12 trillion in FY25 and should reach ₹23 trillion by FY30 at a CAGR of 16.7%. Large enterprises in any discipline benefit from the company’s complete end-to-end AI solutions that help with decision-making.

    Their service portfolio has:

    • Strategic decision acceleration
    • Customer experience optimization
    • Personalization accuracy boost
    • Supply chain optimization
    • Risk management solutions
    • Demand forecasting capabilities

    The company has built seven pillars of enterprise transformation: GenAI, Machine Learning Operations, Conversational AI, Computer Vision, Cognitive Automation, Responsible AI, and Quantum Computing. They invest heavily in state-of-the-art solutions, putting 5% of revenue into R&D activities. This investment led to 24 granted patents and 41 pending applications as of August 2025.Investors evaluating the business beyond GMP trends may review the detailed company profile on fractal-analytics-company to understand its operations, clients, and financial positioning.

    Client base and revenue concentration

    We focused on “Must Win Clients” (MWCs)—enterprises that generate over USINR 843.80 billion in annual revenue, exceed USINR 1,687.61 billion market capitalization, or serve more than 30 million end-customers. The company managed to keep relationships with 122 such clients by September 2025. Their impressive client list features Citibank, Costco, Mars, Mondelez, Nestlé, Philips, and Franklin Templeton.

    The Americas bring in two-thirds of Fractal’s revenue, with Europe and Asia-Pacific following behind. Foreign clients generate about 92% of total revenue. The company’s client relationships prove remarkably stable—its top 10 clients have stayed with Fractal for more than 8 years on average[143].

    The success brings concentration risk. The fractal analytics ipo drhp shows that the top 10 clients generated 54.2% of the company’s revenue in its  segment for H1FY26, with one client bringing in 8.2%. The consumer packaged goods and retail sector made up 37.5% of  segment revenue during this period.

    Financials and Valuation Snapshot

    The numbers behind Fractal Analytics’ IPO tell an exciting story about the company’s growth and profit potential. Let’s get into the figures that make investors eager about this AI-focused enterprise.

    Revenue and profit growth

    Fractal Analytics showed solid revenue growth from ₹1,985 crore in FY23 to ₹2,196 crore in FY24, and then surged to ₹2,765 crore in FY25. The numbers reveal a 26% year-over-year jump between FY24-25 and an 18% CAGR through FY23-25. Analytics services brought in most of the revenue (₹2,701 crore in FY25), while subscription revenue jumped 167% to ₹64 crore in FY25.

    The company’s profit story is even more impressive. Fractal turned around a ₹55 crore loss in FY24 into a ₹221 crore profit in FY25. This 503% turnaround shows how well the company improved its operations. The company managed to keep making profits in the first half of FY26 at ₹70.9 crore, though it dipped slightly by 2.7% from last year.

    EBITDA and PAT margins

    FY25 brought an EBITDA of ₹398 crore with a 14.13% margin, which substantially beat last year’s numbers. The profit-after-tax margin reached 8.0% in FY25, with an adjusted PAT margin of 12.6%. The return on net worth jumped to 12.6% for FY25 from -3.9% in FY24.

    Smart expense management helped improve these margins. Total expenses grew by just 14.4% to ₹2,575 crore in FY25, which was slower than revenue growth.

    Valuation multiples: P/E and P/B

    The upper band price of ₹900 puts Fractal Analytics at a post-FY25 P/E multiple of about 78.9x. This looks high next to traditional IT companies. Pre-IPO P/E sits at 65.5x with ₹13.74 EPS, while post-IPO calculations point to a P/E of 109.12x with ₹8.25 diluted EPS.

    The price-to-book value ratio stands at about 8.65x. This premium shows what investors will pay for Fractal’s AI expertise and growth potential.

    Comparison with industry peers

    Fractal Analytics’ valuation runs ahead of India’s traditional IT companies. TCS trades at a P/E of 22.17x, Infosys at 21.5x, and HCL Tech at 35.58x. This gap exists because Fractal stands out as a pure-play AI company in a market that has few listed AI firms.

    The premium price tag reflects investor faith that Fractal will grow faster than the IT industry’s 11% rate with its own 18% CAGR. The global AI software market’s 22.9% annual growth supports this outlook.

    Should You Invest in Fractal Analytics IPO?

    The Fractal Analytics IPO GMP shows investor enthusiasm, but making an investment decision needs a careful look at both rewards and risks.

    Strengths: market leadership, client base, innovation

    Fractal Analytics gives investors a way into the AI market, which will grow 18.9% each year through 2030. Being India’s first pure-play AI company to reach public markets, it commands a premium due to limited options that partly explains its valuation. The company serves over 100 Fortune 500 companies and boasts an impressive 121.3% Net Revenue Retention. Its top clients have stayed for more than 8 years on average. The company’s steady R&D investments have led to 24 patents and home-grown AI platforms like Cogentiq, which create strong competitive advantages.

    Risks: high OFS, client concentration, premium valuation

    The large Offer For Sale component (₹1,810.4 crore) means most money goes to existing shareholders instead of helping the company grow. The client concentration raises concerns as the top 10 clients bring in 54.2% of revenue, and one client alone contributes 8.2%. The valuation looks expensive at 78.9x post-FY25 P/E, much higher than what we see for TCS (22.17x) and Infosys (21.5x).

    SEBI and DRHP disclosures to consider

    The Fractal Analytics IPO DRHP points out key operational risks. Cybersecurity issues could hurt business operations and client relationships. Project delays and implementation problems might lead to higher costs or unhappy clients. The company also faces legal cases that involve its subsidiaries and two directors.

    Long-term potential vs short-term listing gains

    Fractal gives investors a chance to be part of the global AI growth story. Swastika Investmart believes the stock works best for “high-risk, growth-focused investors with a three-to-five-year investment horizon”. SBI Securities takes a more careful stance with a “Neutral” rating, citing “elevated valuation” compared to “modest growth metrics”. This IPO suits portfolios looking for focused AI exposure better than those seeking safe investments or quick listing gains.

    Conclusion

    Fractal Analytics’ IPO marks the most important milestone as India’s first pure-play AI company to enter the public markets. The substantial ₹2,833.90 crore offering, priced between ₹857 and ₹900 per share, has definitely caught investors’ eyes. The gray market premium has cooled from its original peak of over 20%. It still points to listing gains of 10-11%, which shows ongoing optimism about the company’s future.

    The company’s fundamentals look impressive against its premium valuation. Fractal showed remarkable financial progress and turned a ₹55 crore loss in FY24 into a ₹221 crore profit in FY25. The company’s roster of over 100 Fortune 500 clients and high retention rates definitely build confidence in its business model.

    Some risks need careful thought. Client concentration raises eyebrows with top 10 clients making up 54.2% of revenue. The high OFS component means existing investors will get most proceeds instead of funding company growth. The valuation at 78.9x P/E looks steep compared to traditional IT companies.

    Fractal Analytics ended up being a better fit for growth-focused investors who want exposure to the expanding AI market over a longer period. The premium valuation might not appeal to conservative investors or those looking for quick listing gains. You should match Fractal’s position in the ever-changing AI sector with your risk appetite and investment goals before making a decision.

    Frequently Asked Questions

    The IPO price band is fixed between ₹857 and ₹900 per equity share.

    The IPO opens on February 9, 2026, and closes on February 11, 2026.

    The GMP is currently in the range of ₹57 to ₹99 per share over the upper price band.

    Revenue rose from ₹2,196 crore in FY24 to ₹2,765 crore in FY25, with profitability turning positive.

    Key risks include a large OFS component, high client concentration, and premium valuation.

    Disclaimer: This blog is intended solely for educational and informational purposes and should not be construed as investment advice or a recommendation. While efforts have been made to ensure the accuracy and reliability of the information and data presented, no representation or warranty, express or implied, is made regarding its completeness or correctness. Readers are advised to independently verify all information and consult a qualified financial advisor before making any investment decisions. Investments in the securities market are subject to market risks. Please read all relevant offer documents and disclosures carefully before investing.,