findocblog

Category: News

  • Mutual Fund NFO Collections Hit 5 Year Low While SIPs Hold Ground

    Mutual Fund NFO Collections Hit 5 Year Low While SIPs Hold Ground

    Latest AMFI data for the April to June 2026 quarter points to a clear divergence in mutual fund investor behaviour in India. New fund offer collections have fallen to a five year low while systematic investment plan flows remain relatively steady despite equity market volatility.

    Industry NFO collections in the June 2026 quarter stood at about Rs 1,759 crore, against Rs 6,506 crore in the same quarter a year ago. This represents a drop of roughly 73 percent year on year and extends a declining trend that has now lasted six consecutive quarters. On a sequential basis, NFO mobilisation has weakened for three quarters in a row, indicating broad fatigue in new product launches.

    In contrast, monthly SIP inflows for the industry have stayed firm, even as headline indices corrected and several actively managed equity schemes reported muted short term returns. While some listed asset managers have disclosed marginal SIP flow pressure, the industry picture remains one of continued commitment to long term systematic investing.

    Why Mutual Fund NFO Collections Are Collapsing Despite Strong Market Participation

    The sharp fall in NFO collections has multiple drivers. First, major asset management companies have slowed the pace of new scheme launches after SEBI tightened categorisation norms and distributors and investors became more sensitive to duplication of mandates. Many fund houses are focusing on consolidating existing schemes rather than aggressively pushing fresh products.

    Second, the market environment during the June quarter, with increased volatility and intermittent corrections, appears to have made investors more cautious about committing lump sum money to untested strategies. In an uncertain phase, investors often prefer established funds with visible track records rather than new launches with no performance history.

    Third, there is growing maturity among retail savers. Product suitability, risk disclosure and past episodes of over crowded themes have made investors wary of chasing NFOs purely because of marketing campaigns or low entry NAV levels. The industry has worked to educate investors that Rs 10 NAV is not a bargain by itself and that the underlying portfolio and process matter far more.

    SIP Trends: Small Bumps in Listed MFs, but Core Flows Remain Intact

    While aggregate SIP data from AMFI still reflects robust monthly inflows, the June quarter results of some listed mutual fund houses show early signs of stress at the margin. Leading asset managers such as ICICI Prudential AMC, HDFC AMC and Birla Sun Life AMC have reported a small sequential dip in SIP contributions.

    Fund house commentary suggests part of this decline is driven by investors who started SIPs in recent months and are now pausing or stopping them due to weak short term equity returns. Exit decisions appear more frequent among newer SIP investors who have not yet internalised the long horizon required for equity compounding.

    At the same time, longer tenure SIPs and systematic allocations to diversified equity and hybrid schemes remain resilient. The fact that industry level SIP inflows have not meaningfully rolled over indicates that core retail savings behaviour is still oriented towards disciplined, monthly investing rather than market timing.

    What AMFI’s Latest Mutual Fund Data Implies for Retail and Institutional Investors

    The combination of NFO fatigue and steady SIP flows has important implications for both distributors and investors. For manufacturers, the data reinforces that incremental growth will likely come from driving higher penetration and ticket sizes in existing categories rather than relying on a pipeline of frequent new launches.

    For investors, the numbers underscore a simple reality. Allocating through SIPs into established schemes is increasingly the primary route for long term wealth creation. NFO participation is now more selective and is being used mainly to access genuinely new exposures, such as recently introduced factor based index strategies or niche themes.

    Institutional investors and high net worth clients may read the slowdown in NFO mobilisation as a sign of more rational product supply. With fewer aggressively sold thematic or sector funds coming to market, asset allocation discussions can focus on core exposures and risk management rather than constant churn driven by new launches.

    Recent NFO Launches Highlight Shift Towards Passive and Targeted Exposures

    Despite the overall decline in NFO collections, select launches continue to draw attention, particularly in passive and rule based categories. Edelweiss Mutual Fund has announced India’s first REIT focused index fund, the Edelweiss Nifty REITs and Realty Index Fund, with its NFO opening on 5 August. The scheme will track a combined index of listed REITs and real estate stocks, offering investors a low cost, diversified route into commercial real estate and property linked equities.

    Invesco Mutual Fund has opened NFOs for two exchange traded funds, the Invesco India BSE Sensex ETF and the Invesco India Nifty Bank ETF, with subscriptions running from 28 July to 11 August. Both products aim to closely replicate their respective indices while maintaining low tracking error, giving investors direct index linked exposures in a listed ETF structure.

    These offerings illustrate how fund houses are pivoting towards index funds and ETFs, especially in segments like REITs and sectoral indices where passive strategies can be efficient and transparent. They also match the emerging investor preference for rules based strategies over high fee, opaque thematic bets.

    Fund Manager Outlook: Focus on Investor Behaviour Rather Than Product Count

    Fund manager commentary around the June quarter points to a common theme. The priority is to stabilise investor expectations and encourage time horizons that match equity risk, rather than chase flows through promotions. Managers acknowledge that volatility, lower trailing one year returns and headline noise can cause newer SIP investors to lose conviction.

    Several large AMCs have intensified investor communication, highlighting the importance of continuing SIPs across market cycles and warning against stopping contributions after drawdowns. The message is straightforward. Staggered investing across years, through varied phases of the market, is what smooths average purchase costs and improves the odds of meeting long term goals.

    On NFOs, fund managers are more selective. Launches are now mostly targeted at genuine gaps in product shelves, such as specific duration buckets in fixed income or differentiated factor indices in equities. This aligns with regulatory efforts to reduce duplication and improve clarity in fund categorisation.

    How Investors Should Respond to the Current NFO and SIP Landscape

    For retail investors, the latest AMFI numbers and fund house disclosures offer concrete signals. First, there is no structural advantage in chasing NFOs purely because NAV starts at Rs 10. Investors should treat new schemes like any other fund and evaluate sponsor strength, investment mandate, portfolio construction process and risk management.

    Second, SIP decisions should be anchored to goals and asset allocation, not recent market moves. Stopping SIPs after a correction locks in underperformance and breaks the discipline that underpins the whole strategy. Investors who feel uneasy about volatility can consider stepping down SIP amounts temporarily rather than exiting entirely, or shifting part of their equity SIPs into balanced advantage or dynamic asset allocation funds.

    Third, institutional investors and advisers should use this phase to review client portfolios for duplication and excess thematic exposure accumulated during earlier bull markets. With fewer NFOs coming to market, portfolio rationalisation can reduce noise and refocus on core equity, debt and hybrid allocations that match risk profiles.

    Investors who are building long term portfolios will still need capital market access. For many, a prerequisite remains to open demat and trading account online with a broker, especially when they add ETFs and listed REITs to their mutual fund holdings.

    Practical Checklist for Evaluating Upcoming NFOs and Existing SIPs

    Given the trend of lower NFO collections and SIP resilience, a simple checklist can help investors take informed decisions.

    For NFOs, investors should ask:

    • Is the investment mandate genuinely differentiated from existing schemes I already hold or could buy in the same fund house or category?
    • Does the scheme offer access to a new asset class or index, such as REITs or a specific factor index, that is not easily available through existing funds?
    • What is the fee structure and how does it compare with similar products already in the market?
    • Is the strategy appropriate for my risk profile and investment horizon, or am I reacting to a theme that is currently in the news?

    For ongoing SIPs, key checks include:

    • Are my SIPs aligned to clear financial goals like retirement, children’s education or a house purchase, with defined time frames?
    • Is my overall allocation between equity, debt and hybrid funds in line with my risk tolerance and age, rather than being driven by recent performance?
    • Do I understand that negative one year returns in equities can be normal, and that SIPs work best when sustained for five to ten years or longer?

    Advisers and distributors can use these conversations to anchor investors during volatile markets and to shift focus from short term returns to plan based investing. The platforms they use also matter and they increasingly seek a top stock market trading and investing platform that integrates mutual funds, ETFs and direct equities in a single interface for clients.

    NFO and SIP Data Snapshot: June 2026 Quarter

    Metric June Quarter 2026 June Quarter 2025 Change
    Industry NFO Collections Rs 1,759 crore Rs 6,506 crore Down approx. 73% YoY
    Consecutive Quarters of Declining NFO Mobilisation 6 quarters N/A Ongoing trend
    Sequential Quarterly NFO Decline 3 quarters in a row N/A Ongoing trend
    Monthly SIP Inflows (Industry Level) Firm Firm No material rollover


    Conclusion

    The latest AMFI data, showing five year low NFO collections alongside firm SIP inflows, captures a structural shift in the Indian mutual fund industry. Investors are no longer responding automatically to new launches and are instead leaning on systematic allocation to proven schemes. This development is healthy for market quality and product suitability.

    For asset managers, the message is clear. Growth will be driven by deepening relationships and improving investor experience, not by proliferating funds. For investors, the task is equally clear. Focus on goals, asset allocation and disciplined SIPs, and treat NFOs as occasional tools for specific exposures rather than default choices.

    If this discipline holds, the current phase of subdued NFO mobilisation and steady SIP contributions will likely be remembered as a consolidating period when the Indian mutual fund industry moved closer to a mature, long horizon savings ecosystem, with better alignment between product design and investor outcomes.

    Also Read 

    Explore Trending Stocks
    Adani Enterprises Share Price Apollo Hospital Ent. Share Price
    Asian Paints Share Price Axis Bank Share Price
    Bajaj Auto Share Price Bharat Electronics Share Price
    Bharti Airtel Share Price Cipla Share Price
    Dr. Reddy’s Labs. Share Price Eicher Motors Share Price
  • India IPO Market: 70 Companies Wait For SEBI Nod As Pipeline Swells

    India IPO Market: 70 Companies Wait For SEBI Nod As Pipeline Swells

    India’s primary equity market is showing clear resilience, with a large number of companies lined up for initial public offerings and waiting for regulatory clearance from the Securities and Exchange Board of India, SEBI.

    According to recent data from an equity capital markets tracker, 175 companies already hold valid SEBI observations for their draft IPO documents, while about 70 additional firms are still awaiting SEBI approval to proceed with their issues.

    These figures point to a deep and sustained IPO pipeline in India, despite intermittent volatility in secondary markets and global macro uncertainties.

    What SEBI Observation Means For IPO Launch Timelines

    For institutional and retail investors, understanding the SEBI process is critical to interpreting the current pipeline numbers.

    When a company files a Draft Red Herring Prospectus, or DRHP, SEBI reviews the document for disclosures, risk factors and compliance with regulations. A SEBI observation essentially signals that the regulator has no further comments on the draft and that the issuer is permitted to launch the IPO within the observation’s validity period.

    The report indicates that 175 companies are already at this stage, meaning they have regulatory clearance and can move to launch, subject to market conditions and internal timelines. Another set of around 70 companies is still under review, waiting for SEBI observations before they can set price bands, launch dates and roadshows.

    The concentration of such a large number of issuers at or near the approval stage suggests that the primary market will remain active in the coming quarters, with a mix of mainboard and SME IPOs likely to reach investors.

    Expiry Profile Of DRHPs And Implications For Issue Flow

    The same tracker data sheds light on when the current pipeline may translate into actual IPO offerings.

    Out of the total DRHPs in the system, 39 are expected to expire by September this year, 45 by December and the remaining 91 thereafter. The expiry refers to the validity of SEBI’s observation on the draft prospectus.

    Issuers that do not launch their IPO within the validity period would need to revisit regulatory filings if they wish to tap the market later. This creates a natural incentive for companies, and their investment bankers, to time issues within the expiry window, subject to valuations and macro conditions.

    For investors tracking upcoming IPOs, the expiry profile suggests that a meaningful portion of the pipeline may attempt to launch between now and the end of the calendar year, particularly in windows of lower volatility and supportive liquidity.

    Sector Mix And Types Of IPOs In The Current Pipeline

    While the data in the public domain does not list every name and sector, recent market activity offers clues about the composition of India’s IPO pipeline.

    In the mainboard segment, recent and upcoming issues include companies like Kusumgar, Laser Power & Infra and SBI Funds Management, indicating participation from industrials, infrastructure and financial services.

    On the SME side, the pipeline features manufacturing, technology and consumer oriented businesses, as reflected in issues such as IC Electricals, Kratikal Tech, Sampark India Logistics and others.

    This mix suggests that the 175 approved and 70 pending IPO candidates are likely spread across sectors including capital goods, consumer brands, logistics, IT services, specialty manufacturing and financial intermediation.

    For institutional investors, this breadth offers opportunities for sector specific exposure, pre listing price discovery and potential alpha in new economy themes alongside more traditional sectors.

    IPO GMP Trends And Subscription Data Signal Strong Investor Appetite

    Grey market premium, or GMP, and subscription multiples from recent issues offer a useful backdrop to the scale of the pipeline.

    The Knack Packaging IPO is a recent example, where GMP reportedly surged to about 35 rupees on the final day of subscription, indicating an expected listing price around 205 rupees and potential listing gains of over 20 percent based on the issue price of 170 rupees.

    Subscription data from platforms tracking IPOs shows that issues like IC Electricals have seen overall subscription well above 300 times, while Kratikal Tech has recorded subscription over 200 times.

    These numbers highlight strong demand across segments, with both institutional and retail participation driving oversubscription in select offerings. In turn, this demand environment supports the confidence of companies that are currently waiting for SEBI approval or holding valid observations.

    Investors should keep in mind that GMP is an informal indicator and not recognized by regulators, and that final listing performance depends on broader market conditions, fundamentals and issue valuations.

    Key IPOs With SEBI Clearance: Issue Data Snapshot

    Several approved IPOs illustrate the diversity of deal sizes and structures in the current market.

    Company Type Issue Price / Band (₹) Issue Size (₹ crore) Status
    Kusumgar Ltd Mainboard 398 to 419 650.00 Open window July 8 to July 10
    Laser Power & Infra Ltd Mainboard 203 to 214 742.00 Open window July 9 to July 13
    SBI Funds Management Ltd Mainboard 574 11,692.91 Planned window July 14 to July 16
    Devson Catalyst Ltd SME 112 to 118 42.34 Open window July 9 to July 13
    Happy Steels Ltd SME 62 to 66 25.00 Open window July 9 to July 13

    In addition, Millworks Technologies is scheduled to launch a BSE SME IPO targeting about 160 crore, while several other smaller issues are clustered around July and August.

    These examples show that the pipeline of 175 approved issues includes both mega offerings, such as SBI Funds Management, and mid sized and SME IPOs that collectively add depth to India’s equity markets.

    What The SEBI Approval Backlog Means For Institutional And Retail Investors

    The presence of 70 companies awaiting SEBI approval and 175 holding valid observations has several implications for investors.

    First, institutional investors can expect a steady calendar of deal flow, providing opportunities for anchor participation, QIB allocations and post listing liquidity strategies. The scale of the pipeline allows for thematic allocations, for instance to financials through SBI Funds Management or to infrastructure and industrial themes through names like Laser Power & Infra.

    Second, retail investors and high net worth individuals should prepare for increased frequency of public issues across both mainboard and SME segments. This makes it important to have a clear framework for evaluating IPOs, focusing on business fundamentals, valuations, promoter track record and use of proceeds.

    Third, intermediaries such as mutual funds, PMS and AIF managers may use the upcoming IPO calendar to access new companies that are not yet available in the secondary market, particularly in fast growing niches.

    Given the expected deal flow, investors should ensure their KYC and account setups are fully in place. Those planning to participate directly in primary issues can consider whether to open demat and trading account online through brokers with strong IPO distribution capabilities and efficient application processes.

    Practical Considerations For IPO Participation And Risk Management

    While the numbers indicate a thriving IPO market, investors must balance opportunity with risk.

    Oversubscription and strong GMP, as seen in recent IPOs, do not guarantee long term performance. Listing gains can be volatile, and some issues may trade below the issue price after initial enthusiasm fades.

    Investors should avoid applying indiscriminately across all upcoming IPOs solely based on grey market indications or subscription buzz. Instead, they should assess the financial track record of the issuer, industry structure, competitive positioning and sensitivity to interest rates and economic cycles.

    Institutional investors will rely on detailed due diligence and management interactions, while retail participants should carefully read the red herring prospectus, understand risk factors and avoid using leveraged funds or short term borrowings to chase listings.

    Another consideration is platform choice. A reliable top stock market trading and investing platform with robust IPO modules, clear allocation communication and stable post listing trading infrastructure can make participation and execution more efficient and reduce operational risk.

    Conclusion

    The latest data on SEBI observations and pending approvals confirms that India’s IPO engine remains firmly active, with 175 companies cleared to launch and about 70 waiting for regulatory nod.

    This sizeable pipeline, combined with strong recent subscription trends and healthy grey market indicators, points to continued primary market activity across sectors and market cap segments.

    For investors, the opportunity set is significant, but so are the risks associated with crowded deals, rich valuations and post listing volatility. Institutional participants will focus on fundamental quality and allocation strategy, while retail investors need disciplined selection criteria and a clear understanding of each issuer’s business and financials.

    As SEBI processes the pending applications and more approved issues come to market ahead of DRHP expiries, India’s equity market depth is likely to improve further. A measured, research driven approach to upcoming IPOs will be essential for turning this broad pipeline into sustainable portfolio returns, rather than short term speculation.

    Also Read 

    Explore More Trending Stocks
    Adani Enterprises Share Price TVS Motor Company Share Price
    Yes Bank Share Price HDFC Bank Share Price
    Hindustan Unilever Share Price Kotak Mahindra Bank Share Price
    NTPC Share Price ONGC Share Price
    Reliance Industries Share Price Tata Steel Share Price
  • Nifty 50 Rebounds Above 24,000 as Banking and Midcap Stocks Lead

    Nifty 50 Rebounds Above 24,000 as Banking and Midcap Stocks Lead

    Indian equities posted a robust recovery in the latest trading session, with the Nifty 50 reclaiming the 24,000 mark and the Sensex closing firmly higher. The rebound came after a bout of volatility and a sharp decline earlier this week, which had pushed the Nifty back below 24,000 and triggered broad profit booking across sectors.

    Market data from the National Stock Exchange showed the Nifty 50 closing around 24,120, up more than 120 points on the day. The Sensex ended near 77,270, gaining over 350 points. The advance decline ratio on the Nifty 50 stood in favor of advances, indicating broad participation in the rebound.

    Alongside the headline indices, the Nifty Bank, Nifty Midcap 100 and Nifty Next 50 outperformed, reflecting renewed risk appetite among institutional and retail investors.

    Benchmark Indices Stage Strong Rebound After Recent Selloff

    The rebound has to be viewed against the backdrop of a sharp decline seen in the previous session. The Nifty 50 had dropped by more than 190 points to close just below 24,000, while the Sensex had fallen over 700 points. That decline was driven by risk aversion, profit booking and concerns around global cues.

    The swift recovery indicates that, at current levels, domestic institutional flows and continued retail participation are providing support. The Nifty Bank index rose more than 1 percent in the latest session, while the Nifty Midcap 100 gained over 1.5 percent. The Nifty Next 50 also advanced about 1 percent.

    For investors, this pattern of sharp intraday swings and quick reversals underlines that the current phase is more tactical and sentiment driven, rather than a clear directional trend. Position sizing and risk management therefore remain critical.

    Top Nifty Gainers: Sun Pharma, Bharti Airtel, IndiGo and Kotak Bank in Focus

    The recovery in the Nifty 50 was driven by a mix of pharma, telecom, aviation and financial stocks. Sun Pharmaceutical Industries emerged as the top gainer on the index, rising about 2.6 percent. Bharti Airtel followed with gains of more than 2 percent, while InterGlobe Aviation (IndiGo) and Kotak Mahindra Bank rose a little over 2 percent each.

    These moves are noteworthy because they cut across defensives and cyclicals. Sun Pharma and Bharti Airtel have been key contributors to Nifty’s resilience in recent months, supported by strong earnings visibility and sector specific tailwinds. IndiGo’s gains reflect continued optimism around air travel demand and capacity additions, while the rebound in Kotak Mahindra Bank helped shore up sentiment in the banking space, which had seen selling pressure during the recent correction.

    Top Nifty 50 Gainers Approximate Gain (%)
    Sun Pharmaceutical Industries 2.6
    Bharti Airtel 2.3
    InterGlobe Aviation (IndiGo) 2.1
    Kotak Mahindra Bank 2.0

    Exact closing prices for individual stocks in this session were not disclosed in the aggregated coverage. However, the percentage changes indicate that these counters were among the most actively discussed names on Dalal Street during the rebound.

    Sector Trends: Banks, Midcaps and Select Defensives Drive the Move

    Sector performance showed a clear tilt toward financials and broader market stocks. The gains in Kotak Mahindra Bank helped shore up private banking sentiment at a time when investors are closely tracking credit growth, margin trajectories and asset quality across lenders.

    Midcap and smallcap indices outperformed the large cap benchmarks, reflecting a renewed appetite for higher beta names after the recent correction. This outperformance is consistent with the broader trend this year, where domestic investors have increasingly rotated into midcaps and thematic stories in manufacturing, consumer and capital goods.

    At the same time, defensives such as pharmaceuticals and telecom remained firm. Sun Pharma’s move as the top Nifty gainer and Bharti Airtel’s strong showing indicate that investors continue to seek balance between growth sectors and earnings visibility in their portfolios.

    Key Drivers Behind the Latest Rally in Indian Equities

    Several factors contributed to the rebound in the Nifty 50 and Sensex. Easing crude oil prices provided relief on inflation and fiscal concerns, supporting sentiment in rate sensitive sectors. Foreign portfolio investors turned net buyers after a phase of selling, which helped lift the benchmark indices.

    Domestic macro data, including resilient industrial output and stable tax collections, has added to the constructive medium term narrative for Indian equities. While global risk factors remain in focus, the latest session showed that local fundamentals and domestic savings continue to be important anchors for the market.

    On the derivatives side, Nifty futures data indicated short covering in the index and select large caps, which amplified the move higher. Options positioning around the 24,000 strike suggested that this level remains a key pivot for traders in the near term.

    What Nifty’s Rebound Above 24,000 Means for Investors

    For institutional investors and large traders, the recovery above 24,000 on the Nifty 50 signals that the immediate support zone near 23,800 to 24,000 is holding for now. That said, the market continues to trade at elevated valuations compared with its long term averages, making stock selection and entry timing crucial.

    For retail investors and mutual fund participants, the latest move reinforces the importance of disciplined, systematic investing over trying to time short term swings. Systematic investment plans in diversified equity and large and midcap funds can help smooth volatility while maintaining exposure to the structural growth story.

    Investors with a short term orientation should monitor index levels around 24,000 and 24,300, as well as sector leadership. Sustained leadership from banks, large consumers and quality midcaps would be a positive sign. Persistent rotation into only a narrow set of counters, by contrast, would warrant caution.

    Risk Factors and Near-Term Triggers to Track

    Despite the rebound, several risk factors remain relevant. Global central bank decisions on rates, movements in US yields and any fresh geopolitical flare ups can influence foreign flows into Indian equities. Crude oil prices, though off recent highs, remain a key variable for inflation and corporate margins.

    Domestically, upcoming quarterly earnings for index heavyweights in sectors such as IT, banking, autos and energy will be closely scrutinized. Any earnings disappointment relative to already optimistic expectations can trigger renewed volatility.

    Investors should also keep an eye on regulatory and policy developments impacting sectors like telecom, financial services and pharmaceuticals. Changes to capital requirements, pricing frameworks or compliance norms can affect the risk reward profile of individual stocks even if the broader index trend remains intact.

    Practical Considerations for Indian Equity Investors

    Against this backdrop, investors reviewing their equity allocations may consider a barbell approach, combining high quality large caps with select midcap names where earnings visibility and balance sheet strength are clear. Over concentration in momentum names that have rallied sharply in recent months can increase portfolio risk.

    For new market participants, a stable brokerage relationship and a well structured demat account are essential. It is important to understand that the decision to open demat account is only the first step, and must be followed by a clear investment policy and risk limits.

    Active traders should evaluate their execution tools, data access and risk controls, and choose a top stock market trading and investing platform that supports these needs without encouraging excessive leverage or speculative behavior.

    Conclusion: Nifty’s Recovery Highlights Resilience but Not Complacency

    The latest rebound in the Nifty 50 above 24,000 and the Sensex’s strong close underscores the resilience of Indian equities, backed by domestic flows and supportive macro indicators. Leadership from Sun Pharma, Bharti Airtel, IndiGo and Kotak Mahindra Bank reflects a balanced mix of defensives and growth oriented sectors driving the move.

    At the same time, the sharp swings seen over the past few sessions are a reminder that valuations, global risks and earnings expectations remain critical variables. For Indian investors, a measured approach that emphasizes diversification, quality and long term discipline is more appropriate than chasing short term rallies.

    Equity markets are likely to continue reacting quickly to new data and global cues. Investors who anchor their decisions in fundamentals, manage risk proactively and align their portfolios with their time horizons will be better placed to benefit from the broader trajectory of Indian equities, even as the Nifty and Sensex navigate periods of heightened volatility.

    Also Explore 

    Check Indices
    BSE BANKEX Companies BSE Largecap Comapnies
    FINNIFTY Companies Nifty Midcap 50 Companies
    NIFTY MIDCAP 150 Companies Nifty Pharma Companies
    BSE 500 Companies Nifty Smallcap 100 Companies
    BSE 100 Companies BSE MIDCAP Companies
  • India GDP Growth Seen Slowing to 6.6% as Oil Prices and Weak

    India GDP Growth Seen Slowing to 6.6% as Oil Prices and Weak

    India’s growth narrative is shifting from post pandemic outperformance to a more moderate phase, with a fresh Reuters poll of economists pointing to gross domestic product (GDP) growth of 6.6 percent in FY2026-27, down from an estimated 7.7 percent in FY2025-26. The survey highlights rising crude prices and soft private capital expenditure as the key drags on the outlook for the coming year.

    The poll, conducted between July 21 and 27 among 42 economists, suggests that while India will likely remain one of the fastest growing major economies, the pace of expansion is expected to cool against a backdrop of higher energy costs, tighter global financial conditions and uneven private sector capex. Growth is forecast to recover modestly to 6.8 percent in FY2027-28, but the near term narrative is clearly one of consolidation rather than acceleration.

    How the new growth forecasts compare with RBI and multilateral estimates

    The Reuters poll adds another data point to a gradually converging consensus around mid 6 percent growth for FY2026-27. The Reserve Bank of India (RBI), in its latest Monetary Policy Committee communication, has projected real GDP growth at 6.6 percent for FY2026-27, with quarterly prints ranging from 6.3 percent to 6.8 percent. This aligns almost exactly with the median economist forecast.

    Multilateral agencies have also trimmed their projections in recent weeks, largely citing higher energy prices and external uncertainty. The International Monetary Fund has lowered its FY2026-27 estimate to 6.4 percent, while the Asian Development Bank has pegged growth at 6.6 percent. All three sets of projections point to India staying ahead of most emerging peers, but with less policy room than in the recent past.

    For investors, the key message is that the era of 7.5 percent plus trend growth may be on pause, at least for the next couple of years. Portfolio strategies that assumed a near automatic reversion to 8 percent real growth require recalibration to a more conservative baseline.

    Source FY2026-27 GDP Forecast Notes
    Reuters Poll (42 economists) 6.6% Survey conducted July 21 to 27
    Reserve Bank of India (RBI) 6.6% Quarterly range: 6.3% to 6.8%
    International Monetary Fund 6.4% Revised lower citing energy prices and external uncertainty
    Asian Development Bank 6.6% Consistent with RBI and Reuters poll median


    Oil prices and weak private investment emerge as key macro headwinds

    The Reuters survey explicitly identifies higher crude oil prices and subdued private investment as the primary reasons for the downgrade in India GDP expectations. Economists flag that the recent rise in global energy prices has widened the trade deficit and pressured imported inflation, limiting the space for aggressive monetary easing and fiscal expansion.

    Higher oil prices typically affect India through three channels: a larger import bill, a weaker current account balance and potential upward pressure on retail fuel and transport costs. These in turn can weigh on household consumption, especially discretionary spending, and compress corporate margins in energy intensive sectors such as chemicals, cement, logistics and aviation.

    On the investment side, while public capex has remained strong, the poll notes that private sector capex has been slower to pick up despite healthy corporate balance sheets. Factors cited include caution in committing large greenfield projects, global demand uncertainty and the lagged impact of higher interest rates on project viability. This combination of weaker private investment and costlier energy explains a significant portion of the downward adjustment in growth forecasts for FY2026-27.

    RBI monetary policy stance and inflation backdrop

    The RBI has been running a cautious monetary policy, balancing the need to support growth with the imperative to keep inflation aligned with its 4 percent target. Headline CPI inflation has moderated from the peaks seen in early 2025, helped by food price normalization and supply side interventions, but core inflation remains an area to watch given the pass through of higher energy costs.

    In recent policy communications, the central bank has acknowledged that while domestic demand is resilient, imported risks from commodity prices and geopolitics justify a calibrated approach. With growth forecasts now anchored closer to 6.5 percent and inflation moving within a more acceptable band, the probability of a rapid rate cut cycle appears limited. Instead, investors should expect a “higher for longer” rate environment relative to the ultra low rate period earlier in the decade.

    For bond market participants, this mix suggests a stable policy rate path with modest room for easing if global conditions soften. For equity investors, it underscores the importance of focusing on companies that can maintain pricing power and margin discipline in a still cost sensitive environment.

    Implications for Indian equities, sectors and foreign portfolio flows

    A shift in India GDP expectations from 7.7 percent to 6.6 percent has direct implications for earnings estimates, sector positioning and valuation comfort. While a 6.6 percent growth rate is still strong by global standards, the market cannot assume uniform earnings acceleration across the board.

    Domestic demand oriented sectors such as consumer discretionary, autos and select services may see slightly lower volume growth assumptions baked into analyst models. Export sensitive sectors, including IT services and specialty chemicals, face a double drag from global demand uncertainty and currency volatility linked to oil prices and risk sentiment.

    At the same time, beneficiaries of public capex, including infrastructure, construction, capital goods and select PSU banks, could remain relatively insulated, given continued government focus on roads, railways, digital infrastructure and energy transition. These themes can still deliver strong order books even under a 6.5 percent growth backdrop.

    Foreign portfolio investors (FPIs) typically respond to changes in growth and rate expectations through sector rotation rather than outright withdrawal. A moderate slowdown combined with still positive real rates may encourage FPI interest in financials, industrials and select consumer names, while more cyclical plays see position trimming. Currency volatility amid higher oil prices could be a swing factor for timing of flows, especially in emerging market allocations.

    Rupee, current account dynamics and currency risk for investors

    The rupee’s trajectory is closely linked to the interplay of oil prices, FPI flows and the current account deficit. Higher crude typically widens the trade deficit and can pressure the rupee, particularly if global risk aversion is high and capital flows are uneven. The latest GDP forecasts implicitly assume that India will manage these pressures without a disruptive currency move, but investors should remain cognizant of rupee risk.

    For equity and debt investors, currency management becomes more critical when the growth differential over global peers narrows. A moderate depreciation of the rupee over time can help maintain export competitiveness, but sharp moves can affect imported inflation, interest rate expectations and portfolio returns.

    Institutional investors often respond by increasing hedging of foreign currency exposures, selectively favoring companies with natural hedges or domestic oriented revenue, and watching the RBI’s forex intervention pattern. For retail investors, awareness of currency risk matters especially in global funds and overseas exposures, where rupee movements directly impact returns in rupee terms.

    Practical portfolio strategies for Indian investors in a 6.6 percent growth world

    A shift to a more measured India GDP path calls for nuanced portfolio positioning rather than a binary risk on or risk off approach. Investors should reassess their assumptions on earnings growth, margin resilience and valuation multiples, particularly for sectors that are highly sensitive to domestic demand and energy costs.

    First, asset allocation between equities, debt and cash should reflect a realistic view of nominal GDP and earnings growth. With growth expected around 6.6 percent and inflation likely within the 4 to 5 percent band, nominal expansion will still support corporate revenue growth, but not all sectors will participate equally. Diversification across cyclicals, defensives and structural themes remains essential.

    Second, within equities, preference may tilt toward companies with strong balance sheets, disciplined capital allocation and demonstrated ability to pass on cost increases. Public capex linked themes and select financials with sound asset quality can continue to perform even under a slightly slower growth regime.

    Third, investors new to equities and derivatives should ensure that they use regulated brokers and platforms and that they open demat and trading account online only with entities they have evaluated for costs, risk controls and governance standards. Quality of execution, research and risk management support becomes more important when macro tailwinds are less generous.

    Finally, experienced traders and allocators often emphasize platform reliability when volatility is driven by macro data like GDP and inflation prints. Choosing the best trading platform is not just a matter of lower brokerage, but of stability during data releases, transparent margining and access to analytics that can help interpret evolving economic trends.

    Conclusion

    The latest Reuters poll marking India GDP growth at 6.6 percent for FY2026-27, down from 7.7 percent in the previous year, is a timely reminder that even fast growing economies face phases of moderation when external and domestic constraints converge. Higher oil prices, cautious private investment and global uncertainty are visible headwinds for the coming year, even as India retains its relative advantage over many peers.

    For investors, this is not a call to exit risk assets, but a prompt to refine assumptions, stress test portfolios and pay closer attention to sector specific drivers. The RBI’s growth and inflation mix points to a steady monetary stance, multilateral forecasts affirm continued resilience, and public capex remains a firm support to the medium term story. Within that framework, disciplined asset allocation, selective sector bets and attention to currency and rate risks will define outcomes more than headline GDP numbers alone.

    In a 6.6 percent growth environment, Indian markets can still offer compelling opportunities, but the emphasis shifts from broad beta capture to careful stock selection and risk aware strategy. Investors who acknowledge the new macro baseline, adapt their portfolios and remain anchored in fundamentals will be best placed to benefit as the cycle eventually turns from moderation back to higher momentum.

    Also Explore 

    Also Check Market Data
    Penny Stocks Penny Stocks Under ₹1
    Penny Stocks Under ₹10 Penny Stocks Under ₹5
    Stocks Under ₹20 FMCG Stocks
    Automobile Stocks Information Technology Stocks
    Bank Stocks High Return Penny Stocks
  • Xtranet Technologies IPO Allotment to Be Finalised Today

    Xtranet Technologies IPO Allotment to Be Finalised Today

    The much-anticipated allotment for the Xtranet Technologies IPO is set to be finalised today, Tuesday, 28 July 2026. Investors who applied for shares are now eagerly waiting to find out whether their applications have been successful. With a positive grey market premium already in play, market interest around this IPO remains active.

    For those new to the IPO process, the allotment date is when the company and its registrar officially confirm which investors have received shares. If you applied and your application was successful, shares will be credited to your demat account shortly after allotment.

    IPO Allotment: What Is Happening Today

    Today marks the allotment finalisation date for the Xtranet Technologies IPO. Once the registrar processes all applications and resolves any oversubscription, investors receive an official confirmation. This confirmation can be checked through multiple channels, which are listed below.

    Allotment finalisation is a critical milestone in the IPO timeline. It comes after the subscription window closes and before shares are listed on the stock exchange. Investors should check their allotment status promptly, as this helps them plan their next steps, whether they received shares or not.

    Grey Market Premium: What the GMP Tells Us

    According to data from Investorgain, Xtranet Technologies IPO shares are currently commanding a grey market premium of Rs 7.5. This means that in the unofficial grey market, buyers are willing to pay Rs 7.5 above the issue price to acquire shares before official listing.

    The grey market is an unofficial, unregulated platform where IPO shares are traded before they list on the stock exchange. While GMP can offer a rough indication of investor sentiment, it is important to understand that it does not guarantee actual listing gains. GMP can change significantly in the hours before listing depending on broader market conditions.

    A positive GMP of Rs 7.5 suggests moderate optimism among grey market participants. However, retail investors should treat GMP as one indicator among many, not as a definitive prediction of listing performance.

    How to Check Your Xtranet Technologies IPO Allotment Status

    Investors can check their allotment status through several official methods. Here are the most common ways:

    • BSE Website: Visit the BSE official website, go to the IPO allotment section, enter your application number and PAN details, and check your status directly.
    • Registrar’s Website: The registrar appointed for this IPO will host an allotment status page. Enter your PAN, application number, or DP client ID to verify your allotment.
    • CDSL or NSDL: If shares are allotted, they will appear in your demat account. You can log in to your CDSL or NSDL account to confirm this.
    • Broker Platform: Many brokerage platforms notify investors directly through their app or portal once allotment is confirmed.

    Keeping your application number and PAN handy makes the process quicker and simpler. Most registrar portals are updated within hours of the allotment being finalised.

    Key IPO Details at a Glance

    Detail Information
    Company Name Xtranet Technologies
    Allotment Date 28 July 2026
    Grey Market Premium (GMP) Rs 7.5 per share
    GMP Source Investorgain
    Issue Price Not disclosed
    Listing Exchange Not disclosed
    Registrar Not disclosed


    What Happens After Allotment

    Once the allotment is finalised, investors who received shares can expect them to be credited to their demat accounts within the next working day or two. Investors who did not receive an allotment will typically get a refund processed to their bank accounts around the same time.

    After shares are credited, the next key event is the official listing on the stock exchange. The listing date is when investors can first buy or sell Xtranet Technologies shares through a stock trading platform of their choice. The listing price may be higher or lower than the issue price depending on market conditions at the time.

    Investors planning to sell on listing day should keep a close eye on the opening price and early trading trends. Those with a longer-term view may choose to hold shares beyond listing regardless of early price movements.

    Should You Be Interested as an Investor

    For investors who applied, today is a day to monitor their allotment status carefully. For those who missed applying, the listing date will provide the first opportunity to buy shares through the open market.

    New investors who wish to participate in future IPOs should ensure they have an active demat account. If you do not already have one, you can open demat account online through a registered broker or financial platform. Having a demat account is the first step to applying for any IPO in India.

    The grey market premium of Rs 7.5 suggests some positive sentiment, but investors should not base decisions solely on GMP figures. Always consider the company’s fundamentals, the broader market environment, and your own risk appetite before making any investment decision.

    Conclusion

    The Xtranet Technologies IPO allotment is being finalised today, and investors across the country are checking their application status with anticipation. With a grey market premium of Rs 7.5 per share as reported by Investorgain, there is a degree of positive market sentiment around this IPO. However, investors should remain measured in their expectations and verify their allotment status through official channels only.

    The coming days, leading up to the listing date, will be important for tracking how this IPO performs once it enters the public markets.

    Investor Takeaways

    • Xtranet Technologies IPO allotment is being finalised on 28 July 2026. Check your status via BSE, the registrar’s website, or your demat account.
    • The grey market premium stands at Rs 7.5 per share as of today, indicating moderate positive sentiment. GMP is not a guaranteed indicator of listing gains.
    • Investors who did not receive allotment can expect refunds to be processed shortly after allotment is confirmed.
    • Always rely on official platforms and verified sources when checking your IPO allotment status to avoid misinformation.
    Also Check Market Data
    Penny Stocks Penny Stocks Under ₹1
    Penny Stocks Under ₹10 Penny Stocks Under ₹5
    Stocks Under ₹20 FMCG Stocks
    Automobile Stocks Information Technology Stocks
    Bank Stocks High Return Penny Stocks
  • Adani Energy Solutions’ Rs 3,500 Crore QIP Oversubscribed

    Adani Energy Solutions’ Rs 3,500 Crore QIP Oversubscribed

    Adani Energy Solutions has successfully closed its Qualified Institutional Placement, or QIP, raising Rs 3,500 crore from some of the biggest names in institutional investing. The issue drew bids worth over Rs 10,800 crore, making it oversubscribed by 3.1 times. The strong response signals solid institutional confidence in the company’s growth plans.

    The QIP was priced at Rs 1,615 per share, offered at a discount to the SEBI-mandated floor price. Participants included domestic mutual funds, insurance companies, foreign institutional investors, and Azim Premji’s investment firm, Premji Invest.

    QIP at a Glance

    Detail Information
    Issue Size Rs 3,500 crore
    Total Bids Received Over Rs 10,800 crore
    Oversubscription 3.1 times
    Issue Price Rs 1,615 per share
    Pricing Basis Discount to SEBI floor price
    Key Investors Domestic mutual funds, insurers, FIIs, Premji Invest
    Date 28 July 2026


    What Is a QIP and Why Does It Matter?

    A Qualified Institutional Placement is a way for listed companies to raise fresh capital by selling shares directly to institutional investors. Unlike a public issue, a QIP is faster and involves fewer regulatory formalities. Only qualified institutional buyers, such as mutual funds, insurance companies, and foreign portfolio investors, can participate.

    For retail investors, a heavily oversubscribed QIP is often read as a positive signal. It shows that large, sophisticated investors are willing to put significant money into the company. In this case, the demand was more than three times the shares on offer, which is a strong show of institutional interest.

    Who Participated in the Issue?

    The breadth of participation in this QIP stands out. Domestic mutual funds and insurance companies, which typically take a cautious approach to large fundraises, placed significant bids. Foreign institutional investors also joined in, reflecting interest from global capital.

    One notable participant was Premji Invest, the family investment office of Azim Premji, founder of Wipro. The firm is known for taking selective positions in quality businesses. Its presence in this QIP adds a layer of credibility to the fundraising round.

    If you are looking to track and participate in such opportunities, having the right tools matters. Using a stock trading platform that gives you real-time updates and research tools can help you stay informed when institutional activity picks up around a stock.

    How Will the Proceeds Be Used?

    Adani Energy Solutions has outlined four broad uses for the Rs 3,500 crore it has raised through this QIP. Each use is aimed at strengthening the company’s financial and operational position.

    • Capital Expenditure: Funding ongoing and future infrastructure projects.
    • Debt Repayment: Reducing the company’s existing borrowings to improve financial health.
    • Acquisitions: Pursuing strategic purchases that could expand the company’s business.
    • General Corporate Purposes: Covering operational and administrative needs as required.

    This is a well-spread allocation. Paying down debt while simultaneously investing in growth shows a balanced approach to capital management. It also reduces financial risk, which is something long-term investors tend to appreciate.

    What the Oversubscription Tells Us

    An oversubscription of 3.1 times is not a routine outcome. It means that for every share available, there was demand for roughly three shares. Institutions do their homework before committing funds of this size. The fact that diverse investor categories, from domestic insurers to foreign funds to a well-respected family office, all participated suggests broad confidence in the company’s fundamentals and outlook.

    At the same time, investors should keep in mind that QIP pricing is typically at a discount to the prevailing market price. This allows institutions to lock in a better entry point. The SEBI floor price provides a regulatory baseline, and pricing below it offers additional value to institutional buyers.

    Adani Energy Solutions: A Brief Background

    Adani Energy Solutions is part of the Adani Group, one of India’s largest conglomerates. The company focuses on power transmission and distribution infrastructure, a sector that plays a central role in India’s energy transition. With the country pushing to expand its grid capacity and integrate more renewable energy, businesses in this space are positioned to benefit from long-term policy tailwinds.

    The energy infrastructure sector in India has been attracting growing institutional attention as the government continues to prioritise power sector modernisation. This broader context likely made the QIP an attractive opportunity for investors looking at multi-year growth stories.

    Investor Takeaways

    • The QIP was oversubscribed 3.1 times, reflecting strong institutional confidence in Adani Energy Solutions.
    • The funds will be used for capital expenditure, debt reduction, acquisitions, and general corporate purposes, a balanced allocation that supports both growth and financial stability.
    • Participation by Premji Invest alongside large mutual funds and foreign investors signals broad-based conviction across different investor categories.
    • Retail investors tracking this space should consider opening a free demat account to monitor institutional activity and related stock movements more effectively.

    Conclusion

    Adani Energy Solutions’ QIP has set a strong tone with its 3.1 times oversubscription. The Rs 10,800 crore in total bids against a Rs 3,500 crore issue reflects genuine institutional appetite. With proceeds directed toward debt repayment, capital investment, and acquisitions, the company appears focused on building a stronger financial foundation while pursuing growth.

    For investors, events like this are worth watching closely. They often provide useful signals about how institutional money is moving within a sector. As always, any investment decision should be based on thorough research and an understanding of your own risk tolerance.

    Explore Trending Stocks
    Adani Enterprises Share Price Apollo Hospital Ent. Share Price
    Asian Paints Share Price Axis Bank Share Price
    Bajaj Auto Share Price Bharat Electronics Share Price
    Bharti Airtel Share Price Cipla Share Price
    Dr. Reddy’s Labs. Share Price Eicher Motors Share Price
  • Nifty July Futures Trade at Premium IT Giants Lead Volume

    Nifty July Futures Trade at Premium IT Giants Lead Volume

    India’s equity derivatives market showed firm activity on Friday, July 24, 2026, as Nifty July futures traded at a notable premium to the spot index. The session drew significant participation from institutional and retail traders alike. Infosys, HDFC Bank, and Tata Consultancy Services (TCS) emerged as the top traded contracts in the futures and options segment, reflecting sustained investor interest in heavyweight blue-chip names.

    What Changed

    Nifty July futures closed at a premium over the underlying spot index, signaling a broadly positive sentiment in the near-term outlook among derivatives traders. The cost of carry remained elevated, suggesting that participants are willing to hold long positions into the expiry cycle. Trading volumes were robust across the top three contracts.

    Contract Segment Rank by Volume Futures Sentiment
    Infosys IT / Technology #1 Active participation
    HDFC Bank Banking / Financial Services #2 Active participation
    Tata Consultancy Services IT / Technology #3 Active participation
    Nifty July Futures Index Derivatives Benchmark Trading at premium

    The dominance of IT majors Infosys and TCS in trading volumes underscores continued market focus on the technology sector. Meanwhile, HDFC Bank’s high activity reflects ongoing attention to private banking performance amid evolving credit and deposit dynamics.

    Why It Matters for Investors

    When Nifty futures trade at a premium, it generally reflects positive market bias. Traders are pricing in expectations of further upside or are hedging long equity portfolios. This is an important signal for short-term positioning decisions. However, premiums can narrow quickly if sentiment shifts.

    For investors tracking large-cap exposure, the high volume in Infosys, HDFC Bank, and TCS contracts is meaningful. These three stocks carry significant weight in both the Nifty 50 and benchmark mutual fund portfolios. Their derivatives activity often influences broader index movement. Open demat and trading account online platforms have made accessing these derivative products significantly easier for retail investors seeking to participate in futures markets efficiently.

    Potential Financial Impact

    The premium in July futures indicates a positive cost of carry. This reflects market confidence heading into the near-term expiry. Infosys and TCS, both of which recently reported quarterly earnings, have provided forward revenue guidance that traders are actively pricing into futures contracts. HDFC Bank’s loan growth trajectory and net interest margin outlook also remain central to institutional positioning strategies in the banking segment.

    Expert or Market Reaction

    Market participants noted that IT sector contracts attracted the bulk of speculative and hedging interest following recent earnings releases. Analysts observed that the Nifty July futures premium reflects a constructive tone among domestic institutional investors. However, some traders flagged caution around global macroeconomic cues that could influence index direction before expiry.

    In addition, options data from the session revealed significant open interest build-up at key strike prices. This suggests that the market is watching critical support and resistance zones closely. Derivative analysts noted that implied volatility remained moderate, pointing to a measured rather than euphoric sentiment environment.

    Broader Context

    India’s futures and options market has grown substantially in recent years. The NSE remains one of the largest derivatives exchanges globally by contract volume. The participation of heavyweight stocks like Infosys, HDFC Bank, and TCS as top traded contracts is consistent with historical patterns, particularly around earnings seasons.

    Factor Current Observation
    Nifty Futures Premium Positive, reflecting bullish near-term bias
    IT Sector Activity Elevated post Q1 earnings disclosures
    Banking Sector Focus HDFC Bank credit growth and margin trends
    Global Macro Environment Uncertain; monitored for index direction

    Therefore, the current derivatives activity provides a snapshot of where large market participants are placing their bets for the remainder of the July series. The expiry date will be a key moment of price discovery for all active contracts.

    Key Risks and Factors to Consider

    While positive futures premiums signal short-term optimism, investors must weigh several risk factors carefully. Global macroeconomic headwinds, including interest rate decisions by major central banks, could quickly alter risk appetite. A sharp reversal in global IT spending sentiment could pressure Infosys and TCS contracts significantly.

    For HDFC Bank, execution risk around deposit mobilization and credit quality remains a monitored area. Regulatory changes in the banking sector add another layer of uncertainty. Furthermore, elevated valuations in the broader market mean limited room for error if earnings disappoint. Margin pressure and competitive dynamics in the IT sector also deserve close attention from derivatives traders.

    What Investors Should Watch Next

    • Monitor the Nifty July futures premium closely as the expiry date approaches, any narrowing could signal shifting sentiment.
    • Track weekly open interest changes in Infosys and TCS contracts for directional cues on IT sector positioning.
    • Watch HDFC Bank’s loan growth and asset quality data releases for impact on banking futures contracts.
    • Follow global cues, including US Federal Reserve commentary and currency movements, which directly affect IT earnings estimates.
    • Use a reliable stock trading platform to monitor real-time open interest, volume trends, and cost-of-carry data across these key contracts efficiently.

    Conclusion

    Nifty July futures trading at a premium reflects a cautiously positive near-term market tone. The leadership of Infosys, HDFC Bank, and TCS in traded contract volumes highlights concentrated institutional interest in these benchmark names. Investors should treat derivatives activity as a directional indicator rather than a definitive forecast.

    As always, risk management remains critical. The July expiry cycle will provide clearer answers on whether current premiums are justified by underlying fundamentals. Staying informed and disciplined remains the most prudent approach in this environment.

    • Nifty July futures traded at a premium, indicating positive near-term market sentiment among derivatives participants.
    • Infosys, HDFC Bank, and TCS dominated contract volumes, reflecting sustained institutional focus on IT and banking sectors.
    • Key risks include global macro uncertainty, valuation concerns, and potential margin pressure in the IT and banking segments.
    Explore Nifty 50 Stocks
    Adani Enterprises Share Price Apollo Hospital Ent. Share Price
    Asian Paints Share Price Axis Bank Share Price
    Bajaj Auto Share Price Bharat Electronics Share Price
    Bharti Airtel Share Price Cipla Share Price
    Dr. Reddy’s Labs. Share Price Eicher Motors Share Price
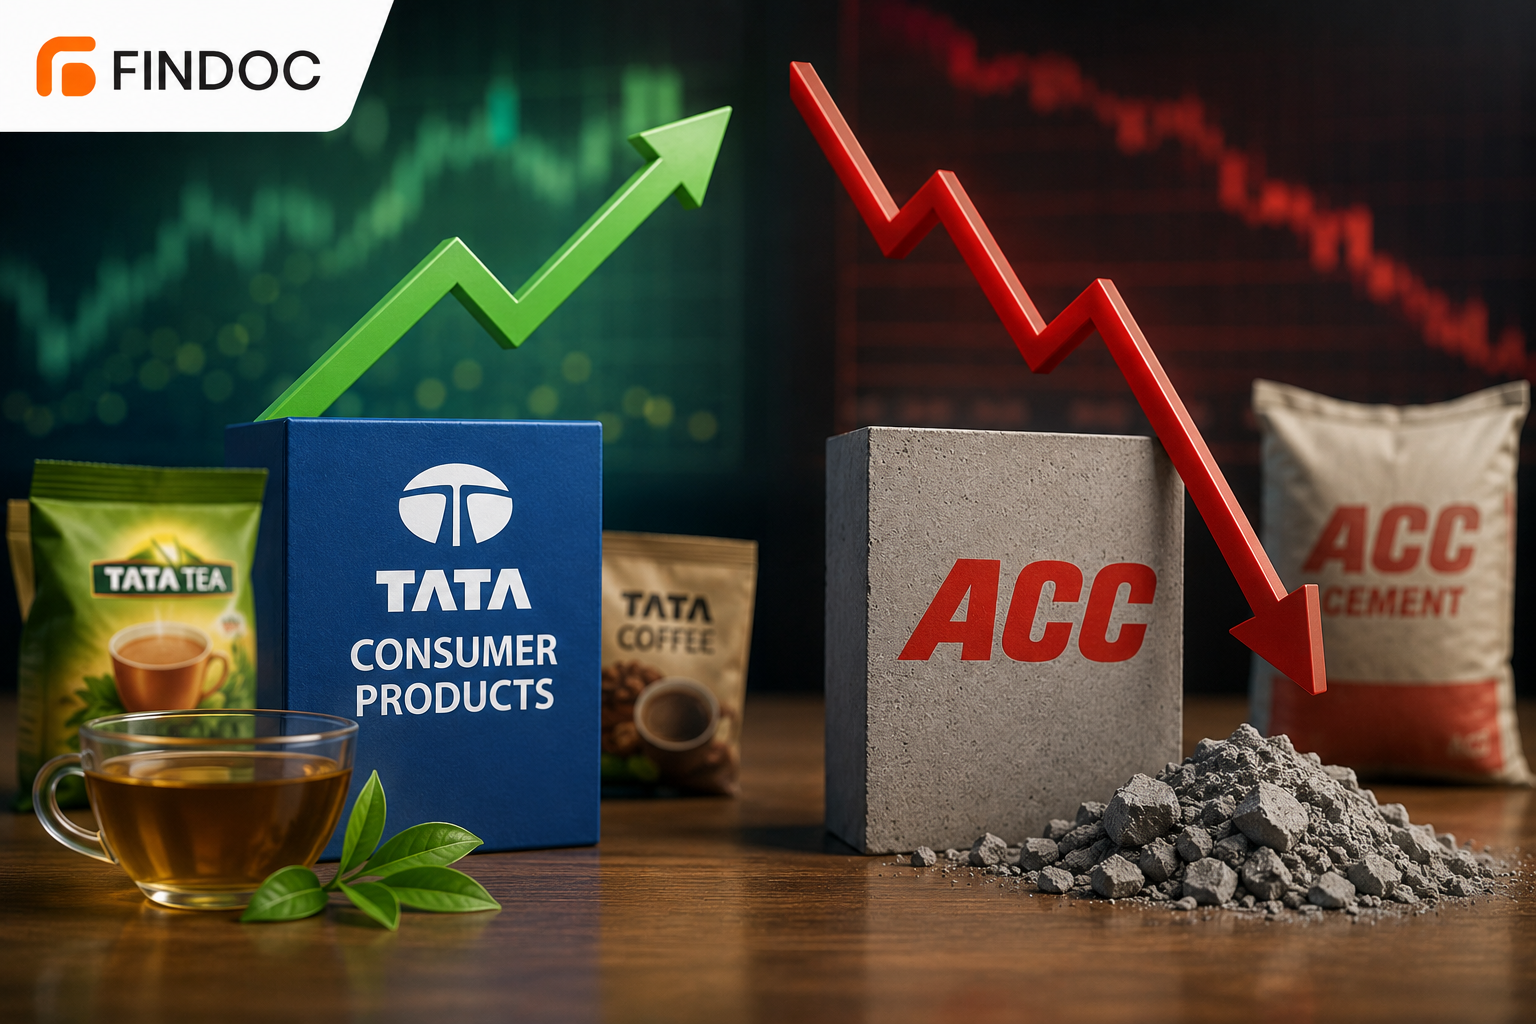
  • Tata Consumer PAT Jumps 28.4% ACC Slumps 61.5% in Q1

    Tata Consumer PAT Jumps 28.4% ACC Slumps 61.5% in Q1

    India’s first-quarter earnings season delivered a mixed picture on July 24, 2026. Several major companies reported their Q1 results, revealing sharp contrasts in performance across sectors. Tata Consumer Products led with strong profit growth, while ACC posted a steep decline. Meanwhile, Shriram Finance, Hindustan Zinc, SBI Life, SBI Cards, and Laurus Labs all reported profit increases. Bank of Baroda, NTPC, SAIL, and KFin Tech were scheduled to announce results later in the day.

    What Changed

    The Q1 results season highlighted diverging fortunes across India’s corporate landscape. Tata Consumer Products reported a 28.4% year-on-year rise in consolidated profit after tax (PAT), signaling robust consumer demand and improved operational efficiency. In contrast, ACC’s PAT fell sharply by 61.5%, reflecting pressure on the cement sector from input costs and pricing challenges.

    Company Q1 PAT Movement Sector
    Tata Consumer Products +28.4% YoY FMCG / Consumer Goods
    ACC -61.5% YoY Cement
    Shriram Finance Rise (quantum not disclosed) NBFC / Financial Services
    Hindustan Zinc Rise (quantum not disclosed) Metals & Mining
    SBI Life Insurance Rise (quantum not disclosed) Insurance
    SBI Cards Rise (quantum not disclosed) Financial Services
    Laurus Labs Rise (quantum not disclosed) Pharmaceuticals


    Why It Matters for Investors

    Q1 results serve as a critical barometer of corporate health. For investors tracking India’s equity markets, the disparity between winners and laggards this quarter underscores the importance of sector selection. Consumer staples and financial services showed resilience, while cement faced structural headwinds.

    Investors seeking exposure to these earnings cycles can open demat and trading account online through SEBI-registered platforms to access stocks in real time as results unfold. In addition, the breadth of companies reporting on a single day, spanning FMCG, metals, insurance, and pharma, highlights the diversified nature of India’s listed corporate universe.

    Potential Financial Impact

    Tata Consumer’s strong PAT growth suggests margin expansion and volume recovery across its tea, food, and beverage segments. This could support re-rating of the stock if sustained in subsequent quarters. However, ACC’s dramatic profit decline raises questions about the cement sector’s near-term earnings outlook, particularly given elevated energy and logistics costs.

    For financial services players like Shriram Finance and SBI Cards, profit growth indicates healthy credit demand and asset quality. Laurus Labs’ improved profitability reflects a recovery in pharmaceutical exports and domestic formulations. The exact magnitude of profit growth for these companies remains not disclosed at this stage of reporting.

    Expert or Market Reaction

    Market participants reacted cautiously to the mixed Q1 scorecard. Analysts had broadly anticipated pressure on cement companies amid competitive pricing environments. Therefore, ACC’s steep decline was not entirely surprising, though its scale exceeded some forecasts. On the other hand, Tata Consumer’s outperformance reinforced bullish sentiment among consumer sector investors.

    Financial sector results from Shriram Finance and SBI Life were seen as broadly positive signals for credit growth and insurance penetration in India. Meanwhile, Hindustan Zinc’s profit rise added confidence to the base metals space, where demand recovery has been uneven globally. Specific analyst price target revisions remain not disclosed pending detailed earnings calls.

    Broader Context

    India’s Q1 FY27 earnings season is unfolding against a backdrop of moderating inflation, relatively stable interest rates, and continued rural consumption recovery. The Reserve Bank of India’s monetary stance has supported lending activity, benefiting NBFCs and banks. However, global commodity price volatility continues to weigh on input-cost-sensitive sectors like cement and metals.

    Sector Q1 Trend Key Driver
    FMCG Positive Volume recovery, rural demand
    Cement Negative Input cost pressure, pricing
    Financial Services Positive Credit growth, asset quality
    Pharmaceuticals Positive Export recovery, formulations
    Metals & Mining Mixed to Positive Commodity prices, volumes


    Key Risks and Factors to Consider

    Despite several bright spots, investors must weigh significant risks. The cement sector’s weakness may persist if infrastructure spending slows or pricing pressure intensifies. For consumer companies like Tata Consumer, sustaining margin gains will depend on raw material costs and competitive intensity in branded food and beverages.

    Financial services firms face risks from potential asset quality deterioration if macroeconomic conditions soften. Regulatory changes affecting NBFCs or insurance products could also impact profitability. Furthermore, pharmaceutical companies like Laurus Labs remain exposed to US FDA regulatory scrutiny and pricing pressure in export markets. Valuation concerns may also limit upside for stocks that have already re-rated following strong results.

    What Investors Should Watch Next

    • Results from Bank of Baroda, NTPC, SAIL, and KFin Tech, scheduled for the same day, will provide further signals on banking, energy, and capital markets sectors.
    • Management commentary from Tata Consumer and ACC on Q2 outlook and input cost trajectories will be critical for forward earnings estimates.
    • Credit quality updates from Shriram Finance and SBI Cards will indicate whether NBFC asset stress is rising or stabilizing.
    • Hindustan Zinc’s volume and realization data will offer insights into base metal demand trends in India and export markets.
    • Investors using a best trading platform should track post-result price action closely, as earnings surprises often drive significant single-day volatility in mid- and large-cap stocks.

    Conclusion

    India’s Q1 FY27 earnings season is reinforcing sector divergence as a dominant theme. Consumer, financial services, and pharmaceutical companies are generally delivering profit growth. Meanwhile, cement faces a difficult operating environment. The contrast between Tata Consumer’s 28.4% PAT rise and ACC’s 61.5% decline illustrates how sector dynamics can vary sharply within the same reporting period.

    As more results arrive from Bank of Baroda, NTPC, SAIL, and KFin Tech, investors will gain a more complete picture of corporate India’s health heading into the second quarter. Disciplined sector analysis and careful monitoring of management guidance will remain essential for navigating this earnings cycle effectively.

    • Tata Consumer’s strong 28.4% PAT growth positions it as a standout performer in Q1, reflecting consumer demand resilience.
    • ACC’s 61.5% PAT decline signals persistent sector-level challenges in cement, warranting caution on the broader sector.
    • Financial services and pharma companies broadly reported profit gains, supporting positive sentiment in these segments heading into Q2.
    Explore Trending Stocks
    Adani Enterprises Share Price Adani Green Energy Share Price
    Adani Power Share Price Aditya Infotech Share Price
    Ambuja Cement Share Price Apollo Tyres Share Price
    Asahi India Glass Share Price Asian Paints Share Price
    Ather Energy Share Price Bajaj Finance Share Price
  • Caliber Mining Shares Fall 8% After Strong 19% IPO Debut

    Caliber Mining Shares Fall 8% After Strong 19% IPO Debut

    Caliber Mining and Logistics made a notable stock market entry, but the excitement was short-lived. Shares debuted at a 19% premium over the IPO price, only to give back significant gains almost immediately. The stock fell over 8% from its listing price, drawing attention from both retail and institutional investors watching the mining and logistics sector closely.

    What Changed

    The post-listing correction wiped out a meaningful portion of the initial listing gains. While a 19% premium debut signals strong initial demand, the subsequent 8% drop reflects profit-booking by short-term investors. This kind of price action is common in newly listed stocks, particularly when early allottees lock in gains quickly after listing.

    Metric Details
    IPO Listing Premium 19% above IPO price
    Post-Listing Decline Over 8% from listing price
    Listing Date Friday, July 25, 2026
    Sector Mining and Logistics
    Analyst Stance (Allottees) Hold for medium to long term
    Analyst Stance (Fresh Buyers) Wait for dip or consolidation


    Why It Matters for Investors

    IPO listings with strong premiums often attract aggressive profit-booking in the first trading session. However, a sharp post-listing correction does not automatically signal weak fundamentals. For investors, the key question is whether the business can deliver sustained earnings growth beyond the listing buzz.

    Caliber Mining and Logistics operates in a sector that benefits from infrastructure spending and commodity demand cycles. Therefore, medium-term performance will largely depend on order book visibility, margin stability, and execution quality. Investors who want exposure to this segment should evaluate the business carefully. For those looking to participate in upcoming IPOs or track new listings, the decision to open demat account online gives direct access to primary market opportunities as they arise.

    Potential Financial Impact

    Specific revenue and profit figures for Caliber Mining and Logistics post-IPO are not disclosed in the available data. However, the IPO subscription trends and listing premium suggest reasonable investor interest in the company’s growth narrative. A sustained premium above the IPO price, even after the correction, would indicate that the market continues to assign a positive valuation to the stock.

    Meanwhile, the 8% post-listing dip has created a price point that is closer to the IPO issue price. This may attract value-oriented investors who missed the IPO allotment but are cautious about chasing the listing price. As a result, near-term price action will be critical in establishing support and resistance levels for the stock.

    Expert or Market Reaction

    Analysts who have reviewed the listing performance recommend a differentiated approach. For IPO allottees who received shares at the original issue price, the advice leans toward holding through the medium to long term. The rationale is that short-term volatility at listing does not necessarily undermine the company’s underlying growth story.

    For fresh investors looking to enter from the open market, analysts urge caution. The recommendation is to wait for meaningful price consolidation or a clearer dip before initiating fresh positions. This conservative stance reflects concerns about overpaying during post-listing euphoria, which can result in capital being locked in at elevated prices for extended periods.

    Broader Context

    The Indian IPO market has seen a steady pipeline of new listings across various sectors in recent years. Mining and logistics companies have attracted attention due to India’s expanding infrastructure investments and growing commodity trade volumes. In addition, government-led initiatives targeting domestic resource development have improved the long-term outlook for firms in this space.

    However, listing-day volatility remains a recurring theme. Many IPOs that debut at strong premiums experience corrections within the first few sessions as early investors exit. This pattern highlights the difference between listing-day returns and actual long-term investment performance, which depends on fundamentals rather than sentiment.

    Key Risks and Factors to Consider

    Risk Factor Details
    Valuation Concern Post-IPO premium may not reflect near-term earnings
    Execution Risk Scaling operations post-listing can face delays
    Margin Pressure Input cost fluctuations in mining can compress margins
    Regulatory Changes Mining sector subject to evolving policy environment
    Competitive Pressure Established logistics and mining players dominate key markets
    Macroeconomic Headwinds Slowdowns in infrastructure spending can reduce order inflows


    What Investors Should Watch Next

    • Track the stock’s ability to stabilize above the IPO issue price in the coming sessions, as this would confirm sustained demand.
    • Monitor the company’s first quarterly earnings release post-listing for revenue and margin trends that validate the IPO valuation.
    • Watch for any institutional buying activity, as large investor participation often provides a floor during post-listing corrections.
    • Follow broader sector developments in mining and logistics, particularly government infrastructure announcements that could support order inflows.
    • Investors tracking multiple new listings can benefit from using a reliable investing and trading platform to monitor real-time price action and manage exposure efficiently.

    Conclusion

    Caliber Mining and Logistics has made a mixed market debut. The 19% listing premium confirms initial investor enthusiasm. However, the subsequent 8% correction reflects the typical profit-booking behavior seen in many newly listed stocks. The fundamental story remains intact for now, but it requires continued monitoring.

    Allottees are advised to maintain their positions through short-term volatility. Fresh investors should exercise patience and wait for price consolidation before committing capital. Ultimately, long-term performance will hinge on the company’s ability to grow revenues, manage costs, and execute its business plan effectively in a competitive sector.

    • Key Takeaway 1: Caliber Mining debuted at a 19% premium but corrected over 8%, reflecting typical listing-day profit-booking behavior.
    • Key Takeaway 2: Analysts recommend holding for allottees and waiting for consolidation for fresh investors before considering new positions.
    • Key Takeaway 3: Execution risk, margin pressure, and regulatory factors remain key considerations for evaluating this stock beyond the listing excitement.
    Also Check Market Data
    Penny Stocks Penny Stocks Under ₹1
    Penny Stocks Under ₹10 Penny Stocks Under ₹5
    Stocks Under ₹20 FMCG Stocks
    Automobile Stocks Information Technology Stocks
    Bank Stocks High Return Penny Stocks
  • Geopolitical Risks May Push Brent Crude to $120

    Geopolitical Risks May Push Brent Crude to $120

    Mohammed Imran, a senior analyst at Mirae Asset, has issued a sharp warning about rising geopolitical risks in global energy markets. According to Imran, escalating tensions in the Red Sea and the Strait of Hormuz could push Brent crude oil prices to $120 per barrel. This warning has drawn significant attention from institutional and retail investors alike. Energy stocks and commodity-linked assets are now firmly in the spotlight.

    Deal Highlights

    This is not a corporate deal in the traditional sense. Instead, it represents a critical analyst forecast that carries major implications for oil markets. The key details from Mirae Asset’s assessment are summarised below.

    Parameter Details
    Analyst Mohammed Imran, Mirae Asset
    Source Business Standard
    Current Brent Crude Level Not disclosed
    Projected Brent Crude Target $120 per barrel
    Key Risk Factors Red Sea tensions, Strait of Hormuz disruptions
    Timeline for Price Target Not disclosed
    Firm Mirae Asset

    Imran’s forecast highlights two critical chokepoints in global oil supply chains. The Red Sea and the Hormuz Strait together handle a massive share of the world’s daily oil shipments. Any sustained disruption in either region could tighten global supply significantly.

    Why It Matters

    Potential Business Impact

    Global oil supply depends heavily on safe maritime passage through key shipping lanes. The Strait of Hormuz alone handles roughly 20% of the world’s oil trade daily. As a result, any blockage or conflict in this region directly affects crude oil prices worldwide.

    Meanwhile, ongoing tensions in the Red Sea have already disrupted commercial shipping routes. Several major shipping firms have rerouted vessels around the Cape of Good Hope. This adds time, cost, and uncertainty to global energy logistics.

    Higher crude prices directly affect industries like aviation, logistics, manufacturing, and power generation. In addition, oil-importing nations like India face pressure on their trade deficits and currency values. This, in turn, can influence inflation and monetary policy decisions.

    Market Reaction

    Oil-linked stocks and energy funds tend to react swiftly to geopolitical forecasts of this magnitude. Investors have begun reassessing positions in upstream oil companies, refiners, and energy ETFs. However, exact stock price movements following this specific report are not disclosed.

    Asset Class Expected Impact Direction
    Upstream Oil Stocks Higher crude boosts revenue Positive
    Refining Companies Margins may compress with higher input costs Mixed
    Aviation Stocks Higher fuel costs squeeze profits Negative
    Energy ETFs Broad rally expected in oil-linked funds Positive
    Indian Rupee Higher import bill may weaken currency Negative

    Commodity traders and hedge funds are closely watching Brent crude futures. Furthermore, retail investors with exposure to oil PSUs and energy mutual funds are on alert. Market sentiment around crude has clearly shifted toward the bullish side.

    Industry Context

    The global oil market has faced repeated supply shocks in recent years. Following the Russia-Ukraine conflict, energy security became a top priority for governments worldwide. As a result, any new geopolitical flashpoint triggers outsized market reactions.

    The Red Sea crisis, driven largely by Houthi attacks on commercial vessels, has already raised shipping insurance premiums. In addition, transit delays have pushed up freight costs across multiple industries. These costs eventually pass through to consumers and businesses alike.

    The Strait of Hormuz remains one of the most strategically sensitive waterways on earth. Iran controls significant influence over this narrow passage. Therefore, any escalation involving Iran could immediately threaten global crude supply flows.

    What Investors Should Watch Next

    Investors should monitor the following key developments closely over the coming weeks:

    • Brent crude futures movement: Watch daily price action for signs of a sustained move toward $100 and beyond.
    • Geopolitical developments in the Red Sea and Hormuz: Any escalation could trigger rapid price spikes in crude oil markets.
    • India’s trade deficit data: Higher oil prices will likely widen India’s import bill and pressure the rupee.
    • Central bank responses: Rising inflation driven by energy costs may delay rate cuts in key economies.
    • Energy sector earnings: Track quarterly results from major oil producers and refiners for margin impact signals.

    Conclusion

    Mohammed Imran’s forecast from Mirae Asset serves as a timely reminder of how quickly geopolitical events can reshape global commodity markets. The Red Sea and Hormuz risks are real, ongoing, and directly tied to crude oil prices. Investors with energy exposure must stay informed and agile. A best trading platform helps investors track and act on such developments in real time.

    Investor Takeaways

    • Monitor energy stocks actively: Oil price spikes at $120 per barrel would significantly boost upstream producers while squeezing oil-dependent industries.
    • Diversify with caution: Consider balancing energy holdings with sectors less exposed to commodity price volatility, such as technology or domestic consumption.
    • Start investing today: Investors can open demat account online to access energy stocks, ETFs, and commodity-linked instruments quickly and efficiently.
    Also Explore
    Top Gainers Today Top Losers Today
    Top Performers Under Performers
    Advances & Declines Heat Map
    ADR Prices Bulk Deals Today
    Penny Stocks Penny Stocks Under ₹1