findocblog

Blog

  • HD Fire Protect IPO Review: Price Band, Dates, Lot Size and Financials

    HD Fire Protect IPO Review: Price Band, Dates, Lot Size and Financials

    HD Fire Protect Limited’s IPO opens on 13 October 2026 and closes on 15 October 2026. The price band is ₹258 to ₹271 per share, the lot size is 55 shares, and the issue is a pure offer for sale of up to 2,62,84,500 equity shares worth about ₹678 crore to ₹712 crore. This page covers the issue details, three years of financials, how the P/E works out, who gets the money and the main risks, based on the Red Herring Prospectus (RHP) dated 5 October 2026.

    HD Fire Protect IPO Key Details

    Parameter Details
    IPO Dates 13 October 2026 to 15 October 2026
    Anchor Book 12 October 2026
    Face Value ₹5 per equity share
    Price Band ₹258 to ₹271 per share
    Lot Size 55 shares (minimum ₹14,905 at the cap price)
    Issue Type Book-built, offer for sale only
    Total Issue Size Up to 2,62,84,500 equity shares, about ₹678 crore to ₹712 crore across the price band
    Fresh Issue Not applicable
    Offer for Sale Up to 2,62,84,500 equity shares by two promoters
    Listing Exchanges BSE and NSE (BSE is the designated exchange)
    Allotment Date 16 October 2026 (tentative)
    Credit to Demat 19 October 2026 (tentative)
    Listing Date 21 October 2026 (tentative)
    Registrar MUFG Intime India Private Limited (formerly Link Intime India Private Limited)
    Book Running Lead Managers Ambit Private Limited, Anand Rathi Advisors Limited, IIFL Capital Services Limited


    The anchor and bidding dates are from the RHP. The price band and lot size are from the company’s announcement, confirmed on several broker and media pages. Allotment, credit and listing dates are tentative and come from secondary sources, so they may change.

    How the Issue Is Divided

    The offer is made under Regulation 6(1) of the SEBI ICDR Regulations, 2018. Of the net offer, reported splits are:

    Category Share of net offer
    Qualified Institutional Buyers (QIB) Not more than 50%
    Non-Institutional Investors (NII) Not less than 15%
    Retail Individual Investors (RII) Not less than 35%


    A small portion is also reserved for eligible employees. It is reported at up to ₹1.75 crore, with a discount of ₹25 per share to the offer price. The abridged prospectus does not state these employee terms, so please confirm them in the RHP.

    What a Retail Application Costs

    • One lot is 55 shares. It costs ₹14,190 at the floor price and ₹14,905 at the cap price.
    • Your bank blocks funds at the cap price, even if the final price is lower.
    • The maximum retail application is 13 lots, which is 715 shares and ₹1,93,765 at the cap price.
    • A 14th lot would cost ₹2,08,670. That is above the ₹2,00,000 retail limit, so the application would move to the small non-institutional category.

    About HD Fire Protect

    HD Fire Protect Limited (CIN U29270MH1997PLC107536) is an Indian maker of fire protection equipment and systems. It sells water, foam and gas-based fire suppression products to industrial buyers (oil and gas, power, pharma, data centres) and to commercial and residential buyers. Its registered office is in Mulund West, Mumbai, and its corporate office is in Wagle Estate, Thane.

    • Revenue comes from many product lines. In FY 2025-26, sprinklers, alarm valves and accessories were 33.95%, deluge valves and pre-action systems 21.85%, and foam equipment 18.71%.
    • Gas suppression systems brought in ₹4.90 crore in FY 2024-25 and nothing in FY 2025-26.
    • India gave 65.31% of FY 2025-26 revenue and exports 34.69%. The Middle East was the largest export region at 14.98%.
    • The company served 2,066 customers in FY 2025-26 and has supplied to over 90 countries since inception.
    • It runs two plants, at Jalgaon and Thane in Maharashtra, covering 8.50 acres. A warehouse at Wagle Estate, Thane, is expected by November 2026.
    • According to CRISIL, it was India’s second-largest fire protection equipment maker by revenue and the largest exporter by value in FY 2024-25. CRISIL puts India’s fire protection equipment market at ₹10,900 crore in FY 2025-26, growing 10% to 12% a year to ₹17,500 crore to ₹19,500 crore by FY 2030-31.

    Financial Performance (Restated)

    Particulars (₹ crore) Q1 FY 2026-27 (3 months, not annualised) FY 2025-26 FY 2024-25 FY 2023-24
    Revenue from Operations 109.05 489.28 432.80 372.95
    Operating EBITDA 29.73 150.46 138.01 106.63
    Operating EBITDA Margin 27.26% 30.75% 31.89% 28.59%
    Profit After Tax (PAT) 23.87 116.79 109.72 87.92
    PAT Margin (on total income, as the RHP defines it) 20.92% 23.12% 24.35% 22.43%
    Net Worth 401.02 377.15 397.23 343.41
    Total Borrowings Nil Nil Nil Nil
    Return on Net Worth 5.95% 30.97% 27.62% 25.60%
    Return on Equity 6.13% 30.17% 29.63% 28.41%
    Return on Capital Employed 8.36% 40.33% 39.63% 37.61%
    Net Cash from Operating Activities 47.20 92.49 98.31 63.77


    Over two years, revenue grew at about 14.5% a year, operating EBITDA at about 18.8% and PAT at about 15.3% (our calculations). The recent pace is slower. FY 2025-26 revenue grew 13.1% against 16.0% a year earlier, and PAT grew only 6.4% against 24.8%. The company has no borrowings in any period shown.

    Working capital is the part to watch. Inventory days were 85 in FY 2025-26 against 77 a year earlier. Receivable days rose from 45 to 57. The cash conversion cycle lengthened from 83 days to 102 days. Operating cash flow was ₹92.49 crore against PAT of ₹116.79 crore, so profit is converting to cash at a lower rate than before. The June 2026 quarter shows inventory days of 109 and a cash conversion cycle of 112 days, though those use a different formula for a short period.

    Net worth fell to ₹377.15 crore on 31 March 2026 from ₹397.23 crore a year earlier despite the profit. The summary does not explain why. These are historical disclosures and do not indicate future performance.

    Valuation Metrics Explained

    Metric FY 2025-26 FY 2024-25 FY 2023-24
    Basic EPS ₹6.66 ₹6.26 ₹5.01
    Diluted EPS ₹6.66 ₹6.26 ₹5.01
    Net Asset Value per Share ₹21.45 ₹22.59 ₹19.49
    Return on Net Worth 30.97% 27.62% 25.60%


    Weighted average EPS and weighted average RoNW are Not disclosed in the abridged prospectus.

    The formulas, in plain words

    • EPS is profit after tax divided by the number of shares. It is the profit earned per share.
    • P/E is the share price divided by EPS. It shows how many rupees you pay for each rupee of yearly profit.
    • RoNW is profit divided by net worth. It shows how much profit the company earns on shareholders’ money.
    • NAV is net worth divided by the number of shares. It is the book value behind each share.

    Working out the P/E

    The RHP leaves the price-dependent figures blank, because the price band was announced after it was filed. Here is how they work out, using FY 2025-26 diluted EPS of ₹6.66 and NAV of ₹21.45:

    Measure At ₹258 (floor) At ₹271 (cap)
    P/E 38.7 40.7
    Price to book value 12.0 12.6
    Market cap (17,52,30,000 shares) ₹4,521 crore ₹4,749 crore


    Because this is an offer for sale, no new shares are created. The share count and EPS stay the same after the issue, so the post-issue P/E equals the P/E above. Only the owners change.

    How that compares with listed peers

    IPO Watch and IPOji report the following peer figures from the RHP. Peer prices are closing prices on 30 September 2026. We have not seen the RHP’s own peer table, so please check it before relying on these.

    Company Diluted EPS P/E RoNW NAV
    HD Fire Protect (at ₹271) ₹6.66 40.7 30.97% ₹21.45
    Azad Engineering ₹20.57 145.65 8.74% ₹236.74
    KSB ₹15.54 55.68 16.11% ₹96.46
    Ingersoll-Rand (India) ₹81.10 51.39 20.36% ₹195.04
    Elgi Equipments ₹13.65 44.70 19.28% ₹70.41
    Kirloskar Pneumatic ₹39.45 17.18 20.36% ₹192.25


    The simple average of the five peer P/Es is about 62.9 and the middle value is 51.4 (our calculations). At the cap price, HD Fire Protect’s 40.7 sits below both, and its return on net worth is higher than any peer shown. Against that, the average is pulled up by Azad Engineering at 145.65, only Kirloskar Pneumatic is cheaper on P/E, and HD Fire Protect’s profit growth slowed to 6.4% in FY 2025-26. A lower P/E also does not by itself make a share cheap, because the peers differ in size and business mix.

    These ratios are shared for educational understanding, not as investment guidance.

    Objects of the Issue

    The company receives nothing from this IPO. The whole offer is a sale by two promoters, and the proceeds, after offer expenses and taxes, go to them in proportion to the shares they sell. The stated objects are to carry out the sale and to get the benefits of listing.

    Selling shareholder Shares offered Amount at ₹258 Amount at ₹271 Weighted average cost per share
    Harish Narshi Dharamshi Up to 89,83,700 ₹231.78 crore ₹243.46 crore ₹0.05
    Kusum Harish Dharamshi Up to 1,73,00,800 ₹446.36 crore ₹468.85 crore ₹0.09


    Amounts are before offer expenses and taxes. The promoters’ holding falls from 95.33% to about 80.32% after the sale (our calculation, assuming the offer is fully subscribed). The offer is 15.00% of post-offer capital. The company has no debt, so there is no repayment object. The expansion at Jalgaon and Thane is not funded from this issue. No credit rating is disclosed in the abridged prospectus.

    Strengths and Risk Factors

    Strengths Risks
    Return on capital employed of 40.33% in FY 2025-26 The issue is a 100% offer for sale, so the company gets no funds
    Zero borrowings in all periods shown PAT growth slowed to 6.4% in FY 2025-26 from 24.8%
    Operating EBITDA margin of 30.75% in FY 2025-26 Cash conversion cycle lengthened from 83 days to 102 days in a year
    2,066 customers in FY 2025-26, across several end industries Top 10 suppliers were 47.76% of total expenses, with no long-term supply contracts
    Exports were 34.69% of revenue, with 90+ countries served since inception The two Maharashtra plants gave 63.49% of FY 2025-26 revenue, so one region carries concentration risk
    Revenue rose from ₹372.95 crore to ₹489.28 crore in two years A joint statutory auditor resigned before finishing the term and was later appointed CFO


    Other disclosed risks include product failure leading to claims, regulatory certifications, under-use of capacity, and customer payment delays. Two criminal proceedings are pending against directors. No proceedings are pending against the company itself. The company has filed three tax cases worth ₹0.04 crore.

    How to Apply via Findoc

    1. Log in to your Findoc account.
    2. Open the IPO section and select the HD Fire Protect IPO issue.
    3. Enter your UPI ID and the number of lots. Quantity must be in multiples of 55 shares.
    4. Place your bid within ₹258 to ₹271.
    5. Approve the UPI mandate on your UPI app. The mandate end time is 5:00 PM IST on 15 October 2026.

    You can also apply through your bank’s ASBA facility. If you do not have a demat account, open a demat account before bidding closes on 15 October 2026.

    Checking Your Allotment

    Allotment is tentatively on 16 October 2026. Check the status on the website of MUFG Intime India Private Limited, or on the BSE and NSE allotment pages. You will need your application number, PAN or demat details. Refunds and demat credit are tentatively on 19 October 2026.

    Key Takeaways

    • The IPO opens on 13 October 2026 and closes on 15 October 2026. The price band is ₹258 to ₹271 and the lot size is 55 shares.
    • It is a pure offer for sale of up to 2,62,84,500 shares by two promoters. The company gets no money.
    • Revenue was ₹489.28 crore and PAT ₹116.79 crore in FY 2025-26, with no borrowings.
    • P/E at the cap price is about 40.7 on FY 2025-26 EPS, against a peer average of about 62.9 and a middle value of 51.4.
    • The maximum retail bid is 13 lots, or ₹1,93,765 at the cap price.
    • Key risks are slowing profit growth, a longer cash cycle, supplier and regional concentration and no proceeds to the company.

    Investments in securities are subject to market risks. This is not investment advice; please read all related documents carefully before investing.

    Related Stock Market Insights

    Current Open IPOs
    Green Asia Impex Ltd. IPO Shah Investor’s Home Ltd. IPO
    Acme Universal Ltd. IPO Pind Hospitality Ltd. IPO
    Acme Universal Safezone 9 Ltd. IPO Shivchem Agro Ltd. IPO
    Shree TNB Polymers Ltd IPO Papadmalji Agro Foods Ltd. IPO
    Vans Electro Engineerings Ltd. IPO Black Opal Consultants Ltd. IPO
  • Jio Platforms IPO Review: Price Band, Dates, Lot Size and Financials

    Jio Platforms IPO Review: Price Band, Dates, Lot Size and Financials

    Jio Platforms Limited is planning a fresh issue of up to 27 crore equity shares of face value ₹10 each. The price band, lot size and bidding dates have not been officially announced yet, because the Red Herring Prospectus (RHP) has not been filed. This page covers the issue structure, three years of restated financials, how to work out the P/E once the price band is out, the use of proceeds and the key risks, all from the Draft Red Herring Prospectus (DRHP) dated 19 June 2026.

    Jio Platforms IPO Key Details

    Parameter Details
    IPO Dates Not officially announced. Media reports point to 21 October to 23 October 2026 (tentative)
    Anchor Book Not officially announced. One media report says 19 October 2026 (tentative)
    Face Value ₹10 per equity share
    Price Band Not yet announced. To be disclosed in the RHP
    Lot Size Not yet announced
    Issue Type Book-built, fresh issue only
    Total Issue Size Up to 27,00,00,000 (27 crore) equity shares. Rupee size depends on the price band
    Fresh Issue Up to 27,00,00,000 equity shares
    Offer for Sale Not applicable
    Listing Exchanges BSE and NSE
    Allotment Date Not officially announced. One media report says 26 October 2026 (tentative)
    Credit to Demat Not yet announced
    Listing Date Not officially announced. One media report says 28 October 2026 (tentative)
    Registrar KFin Technologies Limited
    Book Running Lead Managers Kotak Mahindra Capital, Morgan Stanley India, BofA Securities India, Axis Capital, BNP Paribas, Citigroup Global Markets India, CLSA India, DAM Capital, Goldman Sachs (India) Securities, HDFC Bank, HSBC Securities and Capital Markets (India), ICICI Securities, IIFL Capital Services, Jefferies India, JM Financial, J.P. Morgan India, SBI Capital Markets, UBS Securities India, 360 ONE WAM


    Issue structure, face value, registrar and lead managers are from the DRHP dated 19 June 2026. The dates are from media reports of 6 October and 8 October 2026, not from the company, and schedules often shift. This page will be updated when the RHP is filed.

    How the Issue Is Divided

    The issue is made under Regulation 6(1) of the SEBI ICDR Regulations, 2018. Shares are reserved for QIBs, NIIs, RIIs, Eligible Employees and Eligible RIL Shareholders. The percentage split is Not disclosed in the DRHP summary and will be confirmed from the RHP (the DRHP covers it under “Issue Structure” on page 467).

    What a Retail Application Will Cost

    Retail investors can bid up to ₹2,00,000 in one application. Once the lot size and price band are announced, the numbers work like this:

    • One lot costs lot size multiplied by the price.
    • Your bank blocks funds at the cap price, even if the final price is lower.
    • Maximum retail lots equal ₹2,00,000 divided by the value of one lot at the cap price, rounded down to a whole number.
    • One lot above that limit moves your application into the small non-institutional category.

    The exact figures will be added after the price band is announced.

    About Jio Platforms

    Jio Platforms Limited (CIN U72900GJ2019PLC110816) has its registered office in Ahmedabad, Gujarat, and its corporate office in Ghansoli, Navi Mumbai. Its promoter is Reliance Industries Limited (RIL). The company describes itself as a technology platform built on digital connectivity, offering mobile and fixed broadband, entertainment, cloud, smart home and AI-based products to consumers and businesses.

    • Its subsidiary Reliance Jio Infocomm Limited (RJIL) had 52.44 crore customers on 31 March 2026, up from 48.82 crore a year earlier.
    • RJIL added 3.62 crore customers in FY 2025-26, against 0.64 crore in FY 2024-25.
    • ARPU for the March 2026 quarter was ₹214.0 per month, up from ₹206.2 a year earlier.
    • Monthly data use per customer was 42.3 GB in the exit quarter, against 33.6 GB a year earlier.
    • Monthly churn for the exit quarter was 1.67%, against 1.81% a year earlier.
    • The company reports a single segment under Ind AS 108, so there is no revenue split by business line.
    • Promoter RIL holds 66.43% before the issue. Jaadhu Holdings (a Meta Platforms affiliate) holds 9.98% and Google International LLC holds 7.73%.

    Financial Performance (Restated Consolidated)

    Particulars (₹ crore) FY 2025-26 FY 2024-25 FY 2023-24
    Revenue from Operations 1,46,885 1,28,218 1,09,558
    EBITDA 76,255 64,170 54,959
    EBITDA Margin 51.91% 50.05% 50.16%
    EBIT 49,007 40,032 32,856
    Profit After Tax (PAT) 30,049 26,109 21,423
    PAT Margin 20.46% 20.36% 19.55%
    Net Worth 3,34,013 3,04,022 2,77,866
    Total Borrowings 70,781 73,060 54,349
    Net Leverage (Net Debt to EBITDA) 0.36x 0.71x 0.88x
    Return on Average Net Worth 9.42% 8.97% 8.02%
    Return on Average Capital Employed 10.76% 12.50% 12.83%
    Net Cash from Operating Activities 77,556 68,156 57,662
    EBITDA less Cash Capex 42,071 19,902 1,449


    Over two years, revenue grew at about 15.8% a year, EBITDA at about 17.8% and PAT at about 18.4%. These are our calculations from the table. Revenue growth slowed from 17.0% in FY 2024-25 to 14.6% in FY 2025-26, while PAT growth slowed from 21.9% to 15.1%. Margins, however, held steady or improved.

    The cash picture changed more sharply. EBITDA less cash capex rose from ₹1,449 crore to ₹42,071 crore in two years, and net leverage fell from 0.88x to 0.36x. Operating cash flow of ₹77,556 crore was about 2.6 times PAT, which is common in a business with heavy depreciation. Return on average capital employed, however, slipped from 12.83% to 10.76%, because the capital base grew faster than operating profit.

    These are historical disclosures and do not indicate future performance.

    Valuation Metrics Explained

    Metric FY 2025-26 FY 2024-25 FY 2023-24
    Basic EPS ₹33.63 ₹29.21 ₹23.96
    Diluted EPS ₹33.59 ₹29.17 ₹23.93
    Net Asset Value per Share ₹373.66 ₹340.11 ₹310.85
    Return on Average Net Worth 9.42% 8.97% 8.02%


    Weighted average EPS and RoNW are Not disclosed in the DRHP summary, and market cap at the cap price depends on the price band.

    The formulas, in plain words

    • EPS is profit after tax divided by the average number of shares. It shows the profit earned per share.
    • P/E is the share price divided by EPS. It shows how many rupees you pay for each rupee of yearly profit.
    • RoNW is profit divided by net worth. It shows how much profit the company earns on shareholders’ money.
    • NAV is net worth divided by the number of shares. It is the book value behind each share.

    Working out the P/E

    The DRHP does not show the share price yet. The company decides the price band only after the DRHP is filed, so every figure that depends on the price is still left blank in the document. Once the price band is announced, you can work these figures out yourself in a few steps. Here is how, using the numbers we already know:

    • P/E at floor and at cap: divide each price by the FY 2025-26 diluted EPS of ₹33.59. Every ₹100 of share price equals about 2.98 times earnings.
    • Post-issue P/E: the fresh issue adds 27 crore shares to the existing 893.90 crore, giving 920.90 crore shares after the issue (assuming full subscription). Post-issue EPS is ₹30,049 crore divided by 920.90 crore, about ₹32.63, so post-issue P/E is the price divided by ₹32.63.
    • Price to book: divide the price by the NAV of ₹373.66.
    • Market cap: price multiplied by 920.90 crore shares. Every ₹100 of price equals about ₹92,090 crore.
    • Fresh issue proceeds: every ₹100 of price equals about ₹2,700 crore on 27 crore shares.

    How that compares with listed peers

    The DRHP carries a comparison with listed industry peers under “Basis for Issue Price”, including KPI comparisons. That table is not in the document we worked from, so we have not reproduced it. The peer comparison will be added from the RHP.

    These ratios are shared for educational understanding, not as investment guidance.

    Objects of the Issue

    The issue is a fresh issue only, so the money raised goes to the company and not to selling shareholders. Net proceeds will be used for two purposes:

    Object Amount
    Prepayment, in full or in part, of certain borrowings of RJIL Not yet disclosed. Price dependent
    General corporate purposes Not yet disclosed. Price dependent


    Total fund-based borrowings of the company and its subsidiaries were ₹71,529 crore on 31 March 2026. Lender names, interest rates and the share of that debt to be repaid are Not disclosed in the DRHP summary. SEBI rules cap general corporate purposes, and any unidentified acquisitions, at 25% of gross proceeds in total, but the company’s own split is Not disclosed in the DRHP summary. No credit rating is disclosed there either.

    The company also expects to gain a public market for its shares and the other benefits of listing.

    Strengths and Risk Factors

    Strengths Risks
    RJIL served 52.44 crore customers on 31 March 2026 Total borrowings of ₹71,529 crore on 31 March 2026, with debt covenants needing consent for mergers and dividends
    EBITDA margin of 51.91% in FY 2025-26 Monthly churn of 1.67% in the March 2026 quarter
    Net leverage fell from 0.88x to 0.36x in two years RoCE fell from 12.83% to 10.76% in two years
    Data traffic rose from 14,850 crore GB to 24,140 crore GB over two years The “Jio” trademark is also used by other Reliance Group companies, which the company does not control
    Operating cash flow of ₹77,556 crore in FY 2025-26 Reliance on a limited group of passive infrastructure providers for towers and optic fibre
    Monthly data use per customer rose from 28.7 GB to 42.3 GB in two years Licences and spectrum must be renewed or won at auction, and a failure would hurt operations


    Other disclosed risks include dependence on related-party agreements with RIL and Reliance Retail, cybersecurity and data breaches, and extensive regulation by TRAI and the Department of Telecommunications.

    Litigation is large in rupee terms. Matters against RJIL and other subsidiaries total about ₹10,811 crore, including 200 tax proceedings. GST input tax credit disputes of ₹6,767 crore are not treated as contingent liabilities. Matters against the promoter RIL total about ₹40,311 crore plus US$4.13 billion.

    This table is a summary. The full list is in the “Risk Factors” section starting on page 29 of the DRHP.

    How to Apply via Findoc

    1. Log in to your Findoc account or open a demat account.
    2. Open the IPO section and select the Jio Platforms IPO issue once bidding opens.
    3. Enter your UPI ID and the number of lots. Quantity must be in multiples of the lot size.
    4. Place your bid within the price band.
    5. Approve the UPI mandate on your UPI app before 5:00 PM IST on the closing date.

    You can also apply through your bank’s ASBA facility. If you do not have a demat account yet, open one before the bidding window closes.

    Checking Your Allotment

    The allotment date is not yet confirmed. Once it is, you can check status on the website of the registrar, KFin Technologies, or on the BSE and NSE IPO allotment pages. You will need your application number, PAN or demat account details. Refund and demat credit dates will be added once announced.

    Key Takeaways

    • The IPO is a fresh issue of up to 27 crore equity shares of face value ₹10, with no offer for sale.
    • Price band, lot size and official dates are not yet announced. Media reports suggest bidding around 21 to 23 October 2026.
    • Revenue was ₹1,46,885 crore and PAT ₹30,049 crore in FY 2025-26, with an EBITDA margin of 51.91%.
    • Diluted EPS is ₹33.59 and NAV is ₹373.66, so you can work out P/E and P/B as soon as the price band is out.
    • Proceeds go to prepaying RJIL debt and general corporate purposes. RIL’s stake falls from 66.43% to about 64.48% after the issue, assuming full subscription.
    • Key risks include debt, licence and spectrum renewal, churn, related-party dependence and a large litigation book.

    Investments in securities are subject to market risks. This is not investment advice; please read all related documents carefully before investing.

    Related Stock Market Insights

    Explore More Trending Stocks
    Adani Enterprises Share Price TVS Motor Company Share Price
    Yes Bank Share Price HDFC Bank Share Price
    Hindustan Unilever Share Price Kotak Mahindra Bank Share Price
    State Bank Of India Share Price ONGC Share Price
    Tata Motors Share Price Tata Steel Share Price
  • Ola Electric Sets Rights Issue at ₹27, Record Date Is October 13

    Ola Electric Sets Rights Issue at ₹27, Record Date Is October 13

    Ola Electric Mobility has fixed the terms of its proposed ₹1,000 crore rights issue, with an issue price of ₹27 per share and a record date of 13 October 2026. The company announced the terms in a post-market filing on Wednesday, 7 October.

    The price is a 26% discount to Ola Electric’s closing price of ₹36.32 on 7 October. Eligible shareholders will be entitled to 2 rights equity shares for every 25 fully paid-up shares they hold on the record date.

    Ola Electric rights issue terms at a glance

    The board approved a rights issue of 37.03 crore partly paid-up equity shares, aggregating ₹999.74 crore. Each share has a face value of ₹10, so the ₹27 issue price includes a premium of ₹17 per share. The price is payable in two calls.

    Term Detail
    Issue size ₹999.74 crore (up to ₹1,000 crore approved)
    Securities 37.03 crore partly paid-up equity shares
    Issue price ₹27 per share (₹10 face value plus ₹17 premium)
    Entitlement ratio 2 rights shares for every 25 shares held
    Record date 13 October 2026
    Issue opens 22 October 2026
    Last date for on-market renunciation 26 October 2026
    Issue closes 30 October 2026


    The board or its Rights Issue Committee can extend the issue period, provided the period does not exceed 30 days from the opening date.

    How the 2:25 rights entitlement works

    A rights issue is offered only to existing shareholders whose names appear on the company’s records on the record date. For Ola Electric, that date is 13 October.

    The table below shows the arithmetic of the 2:25 ratio at the ₹27 issue price, using whole multiples of 25 shares. The treatment of fractional entitlements is set out in the Letter of Offer.

    Shares held on record date Rights shares entitled Total issue price at ₹27 (₹)
    25 2 54
    50 4 108
    100 8 216
    500 40 1,080


    Because the shares are partly paid-up, the full ₹27 is not collected in one go. The filing says the price is payable in two calls, and investors should read the issue documents for the call amounts and due dates.

    Timeline from board approval to the 7 October filing

    The terms came after a series of steps over about two weeks:

    • 23 September: Ola Electric chose the rights issue route for its capital raise, so that retail, institutional and promoter group shareholders could all take part.
    • 28 September: The board approved a rights issue of partly paid-up equity shares of up to ₹1,000 crore.
    • 30 September: Shareholders passed all six resolutions at the annual general meeting, including a ₹1,500 crore fundraise enablement.
    • 6 October: Ola Electric received in-principle approval from BSE and NSE. The board meeting planned for 5 October was moved to 7 October while the approvals were pending.
    • 7 October: The board fixed the price, ratio and record date, and the Letter of Offer was submitted to SEBI and the stock exchanges.

    Financial backdrop to the fundraise

    Ola Electric’s consolidated net loss narrowed 22% year on year to ₹336 crore in the first quarter of FY27, from ₹428 crore a year earlier. Operating revenue, however, fell 45% to ₹455 crore, according to Inc42.

    Inc42 also reported that the company’s electric two-wheeler market share improved to 7.6% in August from 6.8% in July. The same report said Ola Electric is stepping up investment in electric vehicles, battery cell manufacturing and battery energy storage systems.

    The ₹1,000 crore rights issue appears to cover part of a wider plan to raise up to ₹1,500 crore. Inc42 noted that the route for the remaining ₹500 crore remains unclear.

    What the discount and the partly paid-up structure mean

    At ₹27, the rights price is ₹9.32 below the ₹36.32 closing price on 7 October. A rights issue is usually priced below the market price so that existing shareholders have a reason to take up their entitlement, although the market price can move before the issue opens on 22 October.

    Partly paid-up shares work differently from ordinary shares. The investor pays only part of the issue price at the time of application, and the balance is collected later through calls made by the company. Renunciation means giving up the right to subscribe, and here shareholders can transfer their entitlement on the exchanges until 26 October rather than subscribing themselves.

    What eligible shareholders and new investors should know

    The record date decides eligibility. Only shareholders on the company’s records on 13 October qualify for the entitlement, which can be traded on the exchanges until 26 October.

    Trading the entitlement on an exchange needs a trading account linked to a demat account. Anyone who does not yet hold listed shares in dematerialised form would need to open a demat account with a registered depository participant before they can take part in corporate actions of this kind.

    Investors should read the Letter of Offer for the full payment schedule, fractional entitlement rules and the issue period, which the board can extend within the 30 day limit.

    Related Stock Market Insights

    Explore More IT Stocks
    Bharat Coking Coal Share Price Sandur Manganese Share Price
    Refex Industries Share Price Anmol India Share Price
    MMTC Share Price KIOCL Share Price
    Ashapura Minechem Share Price NMDC Share Price
    MOIL Share Price Valor Estate Share Price
  • HD Fire Protect IPO Opens October 13 With ₹258-271 Price Band

    HD Fire Protect IPO Opens October 13 With ₹258-271 Price Band

    HD Fire Protect will open its ₹712.31 crore initial public offering (IPO) for subscription on Tuesday, 13 October 2026, with a price band of ₹258 to ₹271 per equity share. The issue closes on Thursday, 15 October, and anchor investor bidding takes place on Monday, 12 October.

    The IPO is entirely an offer for sale (OFS) of 2,62,84,500 equity shares by promoters Harish Narshi Dharamshi and Kusum Harish Dharamshi. At the upper end of the band, the company is valued at about ₹4,748.73 crore after listing.

    HD Fire Protect IPO price band, issue size and lot

    Mumbai-based HD Fire Protect makes fire protection equipment and systems built on water, foam and gas suppression technologies. It operates two manufacturing facilities in Maharashtra.

    Detail HD Fire Protect IPO
    Price band ₹258 to ₹271 per share
    Face value ₹5 per share
    Issue size ₹712.31 crore at the upper band (₹678.14 crore at the lower band)
    Fresh issue None
    Offer for sale 2,62,84,500 equity shares
    Lot size 55 shares
    Listing BSE and NSE


    The issue size follows from the share count. Multiplying 2,62,84,500 shares by the upper band of ₹271 gives ₹712.31 crore.

    IPO dates from the anchor book to listing

    The subscription window runs for three days. Bids made through UPI must be confirmed before the 5 PM mandate cut-off on the last day.

    Event Date
    Anchor investor bidding Monday, 12 October 2026
    IPO opens Tuesday, 13 October 2026
    IPO closes Thursday, 15 October 2026
    Basis of allotment Friday, 16 October 2026 (expected)
    Refunds and credit of shares to demat accounts Monday, 19 October 2026 (expected)
    Listing on BSE and NSE Wednesday, 21 October 2026 (expected)

    How much retail and larger investors can bid

    The minimum bid is one lot of 55 shares, which costs ₹14,905 at the upper band of ₹271. Retail investors can apply for up to 13 lots, or 715 shares, worth ₹1,93,765 at the upper band.

    Category Lots Shares Amount at ₹271 (₹)
    Retail, minimum 1 55 14,905
    Retail, maximum 13 715 1,93,765
    Small non-institutional, minimum 14 770 2,08,670
    Big non-institutional, minimum 68 3,740 10,13,540

    HD Fire Protect valuation and financial snapshot

    At ₹271, the IPO values HD Fire Protect at ₹4,748.73 crore, about 40.7 times its FY2026 earnings, according to figures drawn from the red herring prospectus (RHP) and compiled by IPO portals. Those portals show a profit after tax of ₹116.79 crore for FY2026 and no borrowings on the balance sheet.

    The profit trend below comes from the same RHP-based data compiled by IPO portals. It is shown for context and is not a forecast.

    Period Profit after tax (₹ crore)
    FY2024 87.92
    FY2025 109.72
    FY2026 116.79
    April to June 2026 quarter 23.87


    The company’s share count stays at 17,52,30,000 shares before and after the issue, because an OFS creates no new shares.

    What an offer for sale means for the company

    In an OFS, existing shareholders sell part of their holding to new investors. The company does not issue fresh equity, so the sale proceeds go to the selling promoters and not to HD Fire Protect.

    That makes the offer different from IPOs that raise growth capital. Investors comparing issues should read how the RHP describes the selling shareholders, the valuation and the risk factors.

    Before bidding, the RHP is the document to read. It sets out the selling shareholders, the objects of the offer, the valuation basis and the risk factors, and it is available on the exchange websites and the websites of the book running lead managers.

    IPO terms explained

    Anchor investors are large institutional investors who are allowed to bid a day before the issue opens to the public, which is why the anchor book is on 12 October. The basis of allotment is the process through which the registrar decides how many shares each applicant receives when an issue is oversubscribed.

    A UPI mandate is the request an applicant approves on their UPI app to block the bid amount in their bank account. The money is debited only if shares are allotted, and the rest is released after the basis of allotment.

    IPO market backdrop and how to apply

    Primary market activity has been heavy. Business Standard reported that 69 IPOs raised a record ₹90,462 crore in the July to September quarter, with average listing gains of about 20% per issue against roughly 2% between January and June. On 8 October, Vishal Nirmiti shares listed at a 2% discount to the IPO price, a reminder that listing outcomes vary.

    Applying needs an active demat account and a UPI ID linked to the bank account that will fund the bid. Investors who do not have one can open a demat account with a registered broker before the issue opens, complete KYC and then place a bid. Many investors who want to invest in IPO online use the trading platform offered by their broker to select the issue, enter the lot quantity and approve the UPI mandate.

    The sequence for an applicant looks like this:

    • Confirm that the demat account is active and that the UPI ID is linked to the bank account that will hold the blocked funds.
    • Enter a bid between ₹258 and ₹271 per share, in lots of 55 shares, between 13 and 15 October.
    • Approve the UPI mandate before the 5 PM cut-off on 15 October.
    • Check allotment status after the basis of allotment on 16 October, when shares are expected to be credited to demat accounts on 19 October ahead of the expected listing on 21 October.

    Related Stock Market Insights

    Current Open IPOs
    Green Asia Impex Ltd. IPO Shah Investor’s Home Ltd. IPO
    Acme Universal Ltd. IPO Pind Hospitality Ltd. IPO
    Acme Universal Safezone 9 Ltd. IPO Shivchem Agro Ltd. IPO
    Shree TNB Polymers Ltd IPO Papadmalji Agro Foods Ltd. IPO
    Vans Electro Engineerings Ltd. IPO Black Opal Consultants Ltd. IPO
  • SEBI Shares Trade Logs With Jane Street, Seeks Its Response

    SEBI Shares Trade Logs With Jane Street, Seeks Its Response

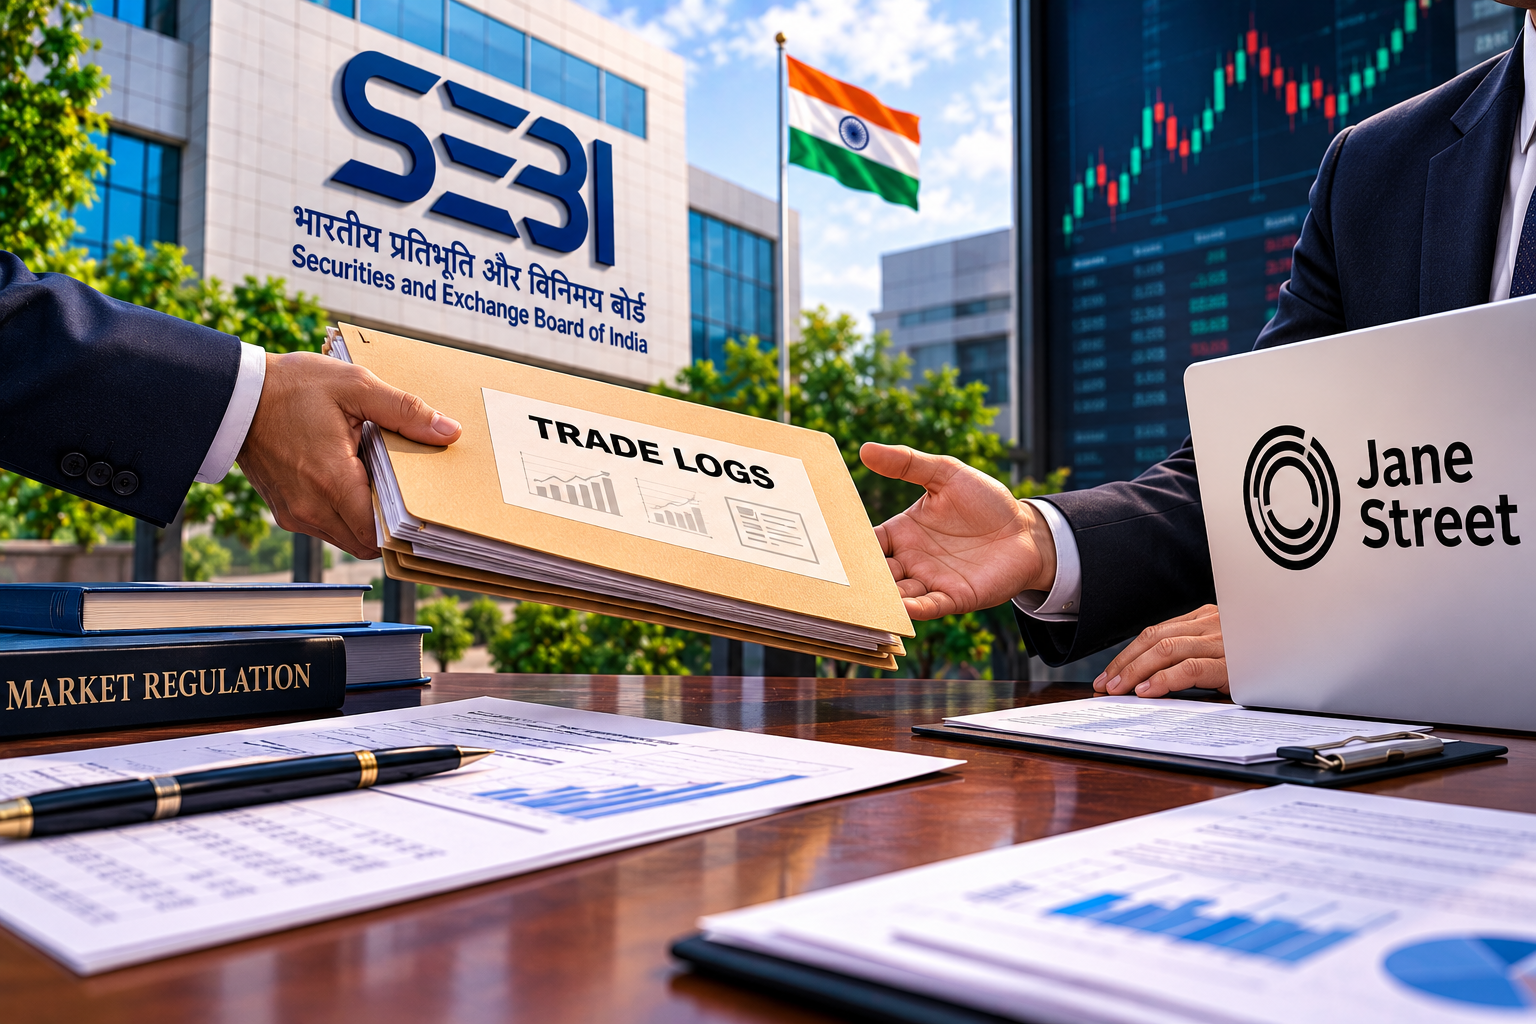
    The Securities and Exchange Board of India (SEBI) has told a court that it has shared with Jane Street Group LLC the trade logs it relied on for its preliminary order, and has asked the Wall Street trading firm to respond to allegations of market manipulation. Bloomberg reported the development on Wednesday, 7 October 2026.

    The case centres on the NSE Nifty Bank index. SEBI alleges that Jane Street influenced the pricing of stocks in the index, while the firm says its trading was conventional index arbitrage.

    What SEBI told the court on 7 October

    SEBI’s lawyer Gaurav Joshi said the regulator has provided details of the actual trades, including their timing, quantity and prices. SEBI has withheld the names and tax identification details of counterparties.

    The regulator will not share additional details, its counsel said, because it did not base its probe on those records. SEBI has asked Jane Street to respond to the allegations now that the trade logs are with the firm.

    Why Jane Street wanted more documents

    The disclosure followed a dispute over redactions. Jane Street’s lawyer had argued until Monday, 5 October, that most of the information in the trade logs shared by SEBI was redacted.

    Jane Street has also been seeking additional documents, including SEBI’s communication with the National Stock Exchange (NSE) that led to the investigation. SEBI’s position is that it will give the records it relied on and no more.

    The allegation around the Nifty Bank index

    SEBI’s interim order of 3 July accused Jane Street and its group entities of manipulating the Nifty Bank index through a two-part trading strategy. The regulator alleged unlawful gains of around ₹4,843 crore.

    The trades are central to the allegation that Jane Street influenced the pricing of stocks in the index. The Nifty Bank index is a closely watched benchmark that serves as the foundation for heavily traded options contracts.

    Jane Street has denied the allegations. It maintains that its trading activity represented conventional index arbitrage and not market manipulation.

    Date Development
    3 July SEBI issues an interim order alleging manipulation of the Nifty Bank index and unlawful gains of about ₹4,843 crore
    18 July Trading restriction on the entities is lifted after Jane Street deposits the alleged gains in an escrow account
    5 October Jane Street’s lawyer argues that most of the information in the trade logs is redacted
    7 October SEBI tells the court it has shared the trade logs and asked Jane Street to respond


    The allegations are at a preliminary stage, and Jane Street denies them. Because the Nifty Bank index is an NSE benchmark, the firm’s request for SEBI’s communication with the exchange goes to how the investigation began, and SEBI has so far declined to go beyond the trade logs it relied on.

    What each side says

    The two positions are far apart, which is why the dispute over documents matters to the final outcome.

    Issue SEBI Jane Street
    Trade data Shared logs it relied on, with timing, quantity and prices Argued that most of the information was redacted
    Counterparty details Names and tax identification withheld Wants more documents, including SEBI’s communication with NSE
    Core allegation Manipulation of Nifty Bank through a two-part strategy Denies it, calling its trading conventional index arbitrage
    Next step Asked the firm to respond to the allegations Response to the allegations now awaited

    Terms in the case explained

    A few terms help in following the dispute:

    • Interim order: A preliminary order passed by the regulator before a final decision, which can include temporary restrictions on trading.
    • Trade logs: Records of individual trades, including their timing, quantity and prices.
    • Escrow account: An account where money is held by a third party until a dispute is resolved.
    • Index arbitrage: A strategy that profits from price differences between an index and its constituent stocks or related contracts, which is how Jane Street describes its trading.

    What the dispute means for derivatives markets

    According to the Bloomberg report, the outcome of the dispute could shape how global trading firms perceive the regulation of high-frequency traders in one of the world’s largest derivatives markets. The Nifty Bank index is the foundation for heavily traded options contracts.

    SEBI published a study on retail participation, trading behaviour and profitability in equity derivatives on 20 August 2026.

    For individual investors, the practical points are straightforward:

    • Anyone who wants to trade in F&O needs a demat and trading account, and access to an online trading platform to place orders in index options and futures.
    • Index derivatives are priced off benchmarks such as Nifty Bank, which is why questions about how those benchmarks are influenced draw regulatory attention.
    • The next step in the case is Jane Street’s response to SEBI’s allegations, following the data share on 7 October.

    Related Stock Market Insights

    Explore Trending Indices
    Bank Nifty Nifty Commodities
    BSE 100 BSE BANKEX
    BSE SENSEX BSE MIDCAP
    Nifty IT Nifty 100
    FINNIFTY Nifty Pharma
  • Demat Additions Fall 11.5% to 2.89 Million in September

    Demat Additions Fall 11.5% to 2.89 Million in September

    New demat account additions slowed by 11.5% in September 2026 to 2.89 million, moderating after a strong August, according to depository data reported by Business Standard on 7 October. The slowdown ended a five-month run of rising monthly additions that began after March.

    The total number of demat accounts rose to 240.6 million. Quarterly additions, however, were the highest since the October to December quarter of 2024.

    September demat account additions at a glance

    The figures come from the two depositories, NSDL and CDSL. Monthly additions in September were similar to those in July, while the year-on-year comparison remained positive.

    Measure Figure
    New accounts, September 2026 2.89 million (down 11.5% from August)
    New accounts, August 2026 3.27 million (highest in seven months)
    New accounts, September 2025 2.46 million (September 2026 is up 17.6%)
    Total demat accounts 240.6 million (up 16.2% year on year)
    Peak monthly additions 4.79 million in September 2024
    Lowest monthly additions in the past year 2.15 million in March 2026

    How the monthly numbers moved

    August 2026 was the strongest month in seven months, with 3.27 million accounts opened. Only January, at 3.72 million, had been higher. September’s 2.89 million is a step down from that level but well above the 2.15 million recorded in March, which was the lowest in a year.

    Compared with a year ago, additions are up 17.6% from the 2.46 million accounts opened in September 2025. They remain well below the all-time monthly peak of 4.79 million set in September 2024.

    Quarterly additions reach a near two-year high

    For the July to September quarter, 9.04 million accounts were added. That is 28.6% more than the 7.03 million added in April to June and 14.2% more than the 7.92 million added a year earlier.

    Quarter New demat accounts (million)
    October to December 2024 9.88
    July to September 2025 7.92
    April to June 2026 7.03
    July to September 2026 9.04

    The July to September 2026 tally is the highest quarterly figure since October to December 2024.

    CDSL and NSDL share of new accounts

    CDSL continued to account for the bulk of the additions. It added 2.41 million accounts in September, against 0.48 million at NSDL, and now holds 193.4 million accounts, or about 80% of the total base.

    The two figures add up to the 2.89 million new accounts for the month, so almost every account opened in September went to one of these two depositories.

    The IPO link behind the account growth

    Business Standard linked the demat additions to heavy activity in the primary market. A total of 69 IPOs raised a record ₹90,462 crore in the quarter ended September.

    Average listing gains were around 20% per issue in that quarter, compared with about 2% between January and June. Newly listed shares continued to draw interest this week, with several 2026 listings gaining more than 10% on Wednesday, according to NSE data cited in the same report.

    G Chokkalingam, founder of Equinomics Research, said that about 7 lakh new investors enter the capital markets for the first time every week on average. He noted that monthly additions fluctuate but stay above 2 million, and described the growth in the demat base as a structural change that will continue for years.

    What a demat account is used for

    A demat account holds shares, bonds, exchange traded funds and other securities in electronic form instead of paper certificates. Shares bought in the market or allotted in an IPO are credited to it, which is why account additions tend to move with market and IPO activity.

    The five-month rise that ended in September started after the March low of 2.15 million and carried the monthly figure to 3.27 million in August. September’s dip should be read against that run, since it still leaves the month 17.6% above the same month a year ago.

    What the data means for investors

    The depository numbers show how many accounts are being opened, not how many investors are active, so they are best read as a measure of entry into the market:

    • The base keeps expanding: At 240.6 million accounts, the demat base is 16.2% larger than a year ago.
    • Monthly numbers swing: September’s fall follows August’s seven-month high, and the series has ranged from 2.15 million to 3.72 million in 2026 so far.
    • Primary market activity matters: IPO listings tend to coincide with higher account openings, and the July to September quarter had both.
    • Account setup is the first step: demat account opening requires identity and address documents and KYC, after which investors can place orders and apply for IPOs.

    Many new investors then use a share market app from their broker to track listings, place orders and monitor holdings. Choosing between brokers is a personal decision that depends on factors such as charges, tools and service.

    Related Stock Market Insights

    Explore More IT Stocks
    Bharat Coking Coal Share Price Sandur Manganese Share Price
    Refex Industries Share Price Anmol India Share Price
    MMTC Share Price KIOCL Share Price
    Ashapura Minechem Share Price NMDC Share Price
    MOIL Share Price Valor Estate Share Price
  • Senco Gold Shares Jump After Q2 Update Shows 31% Revenue Growth

    Senco Gold Shares Jump After Q2 Update Shows 31% Revenue Growth

    Senco Gold shares rose sharply on Thursday, 8 October 2026, after the jewellery retailer released its business update for the July to September quarter (Q2 FY27). Standalone total revenue grew 31% year on year, according to an exchange filing.

    The stock opened nearly 8% higher at ₹346.05 on the NSE, even as the broader market opened lower.

    Senco Gold Q2 FY27 business update in numbers

    Senco Gold said revenue growth at the retail level accelerated to 29% year on year in Q2. It was supported by 19% growth from existing stores, known as same-store sales growth.

    The company also reported its highest-ever topline for a half-year period, at more than ₹5,000 crore in H1 FY27, and reached the landmark of ₹10,000 crore of sales on a trailing twelve month basis.

    Metric Q2 FY27 or H1 FY27
    Standalone total revenue growth (including corporate, e-commerce and export), Q2 31% year on year
    Retail revenue growth, Q2 29% year on year
    Same-store sales growth, Q2 19%
    Total revenue growth, H1 FY27 (April to September) 48% year on year
    Topline, H1 FY27 More than ₹5,000 crore (highest ever)
    Sales on a trailing twelve month basis ₹10,000 crore landmark


    A business update covers sales trends and is separate from the quarterly results, which carry profit figures.

    How Senco Gold shares traded on 8 October

    Senco Gold moved higher while the broader market was under pressure. At 11:00 AM IST, the Sensex was down 0.64% at 72,171.88. The stock was among the most active equities on the NSE by value. Around 2 million shares changed hands in the first five minutes of trade, worth ₹79.85 crore, according to Business Standard.

    Time on 8 October Senco Gold on the NSE
    Open Nearly 8% higher at ₹346.05
    9:20 AM 5.5% higher at ₹338.40
    10:10 AM 11.9% higher at ₹358.80

    Terms in the business update explained

    Same-store sales growth measures the increase in sales from showrooms that were already operating in the comparable period a year earlier, so it strips out the effect of new openings. That is why the 19% figure is read as a gauge of demand at existing stores, while the 29% retail growth also reflects the showrooms added over the year.

    COCO stores are owned and run by the company, while franchisee stores are run by partners. The trailing twelve month figure adds up sales over the latest four quarters, which smooths out seasonal swings in a business where festive demand matters.

    Showroom expansion plans

    Senco Gold opened 6 more showrooms in Q2, of which 3 are company-owned and company-operated (COCO) and 3 are franchisee stores. That took its additions in H1 to 14 and its total network to 215 showrooms.

    The company said it has a strong pipeline of both COCO and franchisee stores and expects to open another 10 to 12 showrooms in H2.

    How other jewellery stocks reacted to Q2 updates

    Jewellery retailers have been releasing quarterly updates this week, and market reactions have differed. Business Standard reported that Titan shares fell 4% on 7 October on slower-than-expected jewellery growth in Q2. On the same day, Kalyan Jewellers shares rose over 3% on its Q2 business update.

    The contrast shows that investors are comparing growth rates across companies, not only reading each update on its own.

    Where the stock sits on the chart

    Sudeep Shah, head of technical and derivatives research at SBI Securities, said Senco Gold has largely consolidated within a range of ₹276 to ₹430 since April 2025 on the weekly chart. During this period the relative strength index (RSI) stayed between 40 and 60, a sideways pattern.

    He added that a flat average directional index (ADX) points to the absence of a strong trend and that a decisive breakout on either side of the range could give further directional cues. These are the analyst’s views and are not endorsed by Business Standard.

    What investors tracking the stock should know

    Business updates like this one are filed with the exchanges, and the numbers can be checked against the filing on the NSE and BSE websites. Three points are worth keeping in view:

    • The full Q2 results, with profit and margins, are the next set of numbers to compare against the update.
    • Growth figures in a gold jewellery business depend on gold prices and festive demand, so they are best compared with the same period a year earlier.
    • The 10 to 12 showroom additions planned for H2 are a stated plan and not a reported result.

    Investors who track a stock like Senco Gold on a stock trading app can follow the filing, the price move and trading volumes in one place. Those who do not yet hold shares can open demat account online with a registered broker, complete KYC and then place orders once the account is active.

    Related Stock Market Insights

    Also Check Market Data
    Penny Stocks Penny Stocks Under ₹1
    Penny Stocks Under ₹10 Penny Stocks Under ₹5
    Stocks Under ₹20 FMCG Stocks
    Automobile Stocks Information Technology Stocks
    Bank Stocks High Return Penny Stocks
  • RBI Raises Repo Rate to 5.50% and Turns to Calibrated Tightening

    RBI Raises Repo Rate to 5.50% and Turns to Calibrated Tightening

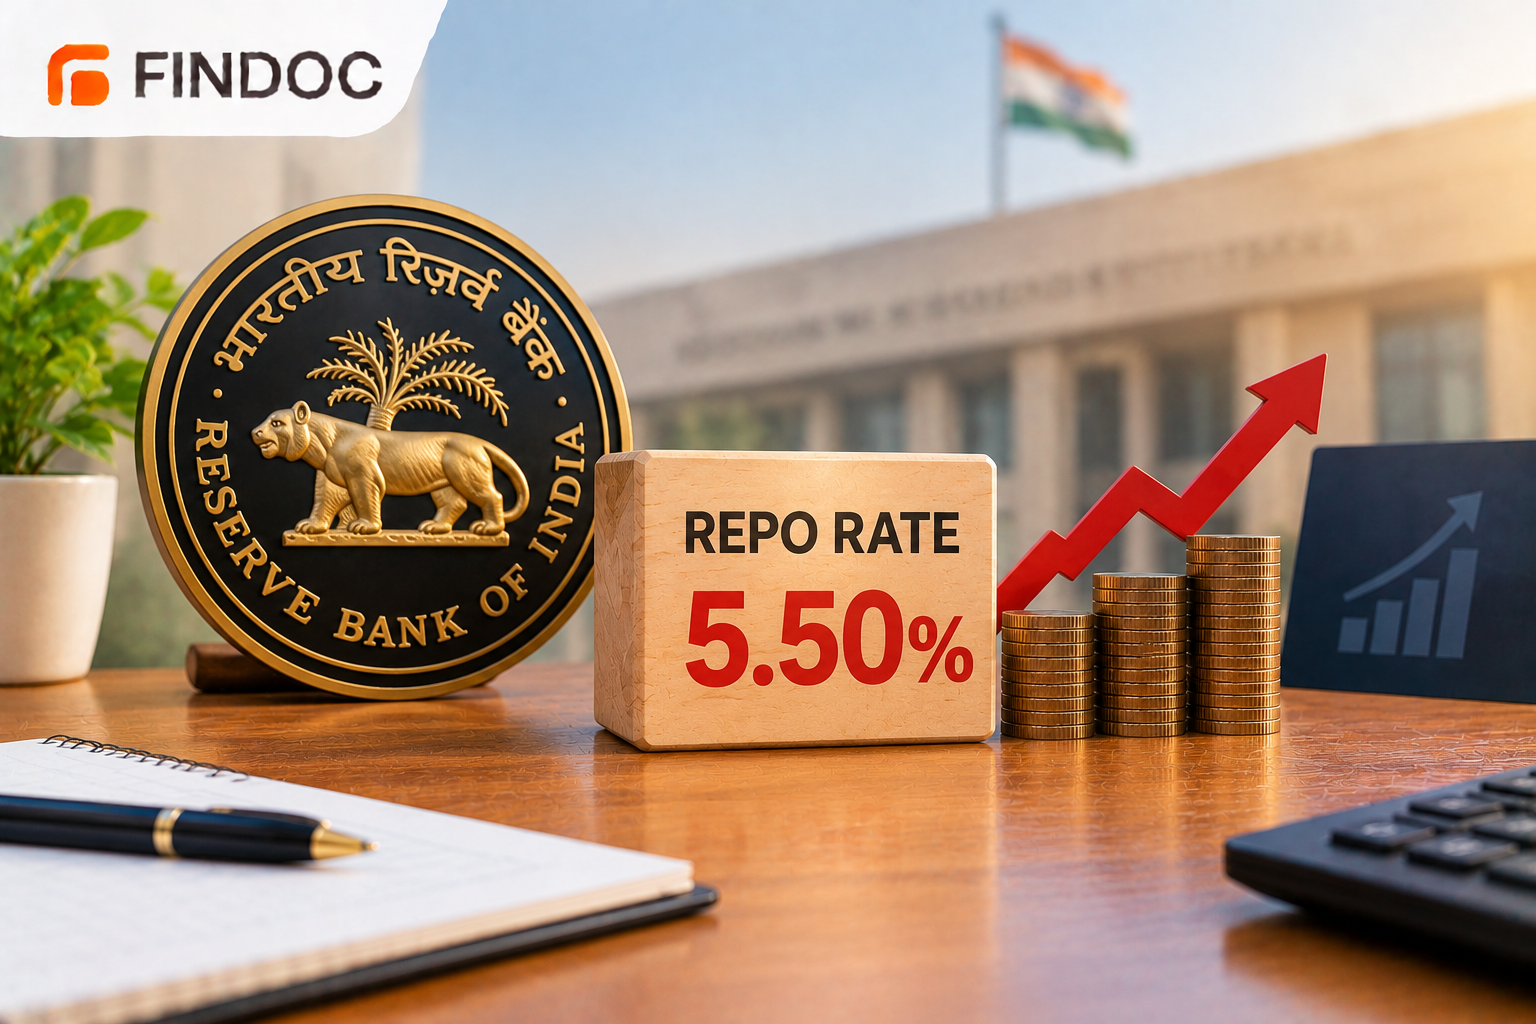
    The Reserve Bank of India (RBI) raised its policy repo rate by 25 basis points to 5.50% on Wednesday, 7 October 2026, and changed its policy stance to calibrated tightening. The Monetary Policy Committee (MPC) voted unanimously for both decisions.

    It is the first RBI rate hike in more than three and a half years. Equity markets closed lower on the day of the announcement, and the Sensex was trading in the red again on Thursday, 8 October.

    What the RBI repo rate hike changes in the rate corridor

    The MPC held its 63rd meeting from 5 to 7 October under Governor Sanjay Malhotra. After assessing the macroeconomic and financial outlook, it raised the repo rate, the rate at which the RBI lends short-term money to banks, from 5.25% to 5.50%.

    The rest of the corridor moved with it. The standing deposit facility (SDF) rate, which acts as the floor, now stands at 5.25%, while the marginal standing facility (MSF) rate and the Bank Rate are both at 5.75%.

    Policy variable Position after the 7 October 2026 decision
    Policy repo rate 5.50% (earlier 5.25%)
    SDF rate 5.25%
    MSF rate and Bank Rate 5.75%
    Policy stance Calibrated tightening (earlier neutral)
    2026-27 CPI inflation forecast 5.2% (earlier 4.8%)
    2026-27 real GDP growth forecast 7.1% (up 40 basis points)


    The change in stance carries as much weight as the rate move itself. By shifting from neutral to calibrated tightening, the MPC signalled that rate cuts are unlikely in the near term.

    How the rate-cut cycle turned

    The repo rate stood at 6.50% in February 2025. Between February and June 2025 the MPC cut it by a total of 100 basis points to 5.50%, and a further 25 basis point cut in December 2025 took it to 5.25%.

    Wednesday’s decision reverses part of that easing. The hike had been widely anticipated by brokerages: HSBC Global Investment Research had predicted a 25 basis point increase, and Goldman Sachs had forecast hikes of the same size in October and December 2026.

    Inflation and growth forecasts behind the decision

    The RBI now expects consumer price index (CPI) inflation of 5.2% for 2026-27, against 4.8% in its earlier projection. It expects inflation to remain elevated through the rest of the year, citing persistent inflation risks and global supply pressures.

    Growth, by contrast, was revised upward. The central bank now projects real GDP growth of 7.1% for the year, 40 basis points higher than before.

    The RBI’s medium-term inflation target is 4%, with a tolerance band of 2 percentage points on either side. A 5.2% projection sits inside that band but well above the target, which is the backdrop for the shift in stance.

    How the Sensex and Nifty reacted to the rate hike

    On 7 October, the Sensex fell 429 points to close at 72,638.70, while the Nifty 50 ended near 22,603.05. Business Today reported that metal stocks were the biggest drag, followed by realty, auto, IT and consumer shares, while PSU banks and media ended with modest gains.

    The weakness carried into Thursday. At 11:00 AM IST, the Sensex was down 466.82 points, or 0.64%, at 72,171.88, and the Nifty 50 was trading around 22,450. The Nifty Midcap and Nifty Smallcap indices were lower by 0.92% and 1.06% respectively at about 11:10 AM.

    Indicator Reading Timing
    Sensex 72,638.70, down 429 points Close, 7 October
    Nifty 50 22,603.05 Close, 7 October
    Sensex 72,171.88, down 0.64% 11:00 AM IST, 8 October
    Nifty 50 Around 22,450 11:00 AM IST, 8 October
    Nifty Midcap and Nifty Smallcap Down 0.92% and down 1.06% About 11:10 AM IST, 8 October
    Rupee against the US dollar 96.72 at open (previous close 96.78) 8 October


    Global cues added pressure. India TV reported that Asian shares fell after Wall Street retreated from its record, with the US 10-year Treasury yield briefly touching 5.36% before settling near 5.28%. Nifty IT was the only major sectoral index in the green early on, with TCS shares rising ahead of its Q2 results.

    What the hike means for banks, borrowers and savers

    Business Standard reported that brokerages and analysts view the rate hike and the calibrated tightening stance as supportive for the earnings outlook of private banks, public sector banks and housing finance companies. ICRA’s Aditi Nayar was quoted as saying that the inflation trajectory holds the key to any further hikes.

    The practical effects depend on the type of loan, deposit or investment:

    • Floating-rate borrowers: Loans tied to external benchmarks such as the repo rate are the ones that typically reset after a policy change, so lenders’ notices on revised rates are worth reading.
    • Equity investors: The sector moves on 7 October were uneven, which matters for anyone reviewing sector exposure in a demat and trading account.
    • Debt and deposit investors: Higher policy rates generally push up yields on new deposits and bonds over time, and many people compare these on an investing platform before choosing a tenure.
    • Rate watchers: Future MPC decisions will depend on how inflation tracks against the 5.2% forecast for 2026-27.

    The next signals will come from inflation data and from how banks pass the 25 basis point increase on to lending and deposit rates.

    Related Stock Market Insights

    Check Indices
    BSE BANKEX Companies BSE Largecap Comapnies
    FINNIFTY Companies Nifty Midcap 50 Companies
    NIFTY MIDCAP 150 Companies Nifty Pharma Companies
    BSE 500 Companies Nifty Smallcap 100 Companies
  • Oman Emerges as India’s Top LNG Supplier in September

    Oman Emerges as India’s Top LNG Supplier in September

    Oman supplied approximately 585,000 tonnes of liquefied natural gas (LNG) to India in September, according to shipment data from commodity analytics firm Kpler. The country accounted for about 27% of India’s LNG imports during the month.

    The development was reported on October 5, 2026, but the data covers September shipments. It reflects a change in India’s monthly import mix, not a new supply contract or a permanent change in its long-term supplier relationships.

    Oman Leads a Changing Supplier Mix

    Oman’s September shipments rose 11.6% from August, allowing it to overtake the United States as India’s largest LNG supplier for the month.

    Nigeria ranked second, supplying around 351,000 tonnes. However, its shipments declined approximately 35% from August.

    The US, which had led India’s LNG supplies in August with about 848,000 tonnes, fell to third place in September. Its shipments dropped 59% month-on-month, reducing its share of India’s LNG imports to approximately 16%.

    The United Arab Emirates and Angola were also notable suppliers, shipping approximately 311,000 tonnes and 205,000 tonnes, respectively.

    Supplier September data
    Oman About 585,000 tonnes; 27% share
    Nigeria About 351,000 tonnes
    United States 16% share; shipments down 59% month-on-month
    UAE About 311,000 tonnes
    Angola About 205,000 tonnes
    Qatar About 94,000 tonnes; 4.3% share

    The supplier-level figures are attributed to Kpler. The Petroleum Planning & Analysis Cell (PPAC), the Government of India’s energy-data agency, maintains official monthly LNG-import data.

    Qatar’s Share Drops to 4.3%

    Qatar supplied approximately 94,000 tonnes of LNG to India in September, giving it a 4.3% share and placing it sixth among suppliers.

    That marks a sharp decline from Qatar’s earlier position. The country had previously accounted for around 45% of India’s LNG imports, according to the reported data.

    The reference report linked Qatar’s reduced contribution to damage at the Ras Laffan industrial area following an Iran-related attack. This explanation remains reported context and should not be treated as an independently confirmed official account based on the available information.

    The report also cited an ICRA executive as saying that Qatar accounts for around 19% of global LNG supply and that restoring full capacity could take months. The pace of any recovery in Qatar’s shipments to India will depend on infrastructure availability and shipping conditions.

    India’s Total LNG Imports Decline

    India imported approximately 2.17 million tonnes of LNG in September, down 14% from nearly 2.5 million tonnes in August.

    The figures indicate that the increase in supplier diversity did not fully compensate for lower shipments from major sources. India imports around half of its total LNG consumption, making the availability and cost of replacement cargoes important for domestic buyers.

    A significant portion of West Asian LNG shipments passes through the Strait of Hormuz. Disruptions along the route could affect shipping schedules, freight costs and the delivered cost of LNG for Indian importers.

    LNG is used across several parts of the Indian economy, including fertiliser production, power generation, industrial activity and city-gas distribution. Changes in supply availability or procurement costs can therefore affect multiple sectors, although the available data does not quantify any company-specific financial impact.

    Implications for Indian Energy Companies

    The September data does not establish a direct movement in the Nifty, Sensex or any individual Indian stock. Its immediate significance lies in India’s changing energy-import profile and the risks faced by businesses dependent on reliable gas supplies.

    The sectors most relevant to the development include:

    • LNG import and regasification terminals.
    • City-gas distribution.
    • Fertiliser production.
    • Gas-based power generation.
    • Oil marketing and energy infrastructure.
    • Energy-related shipping and logistics.

    Potential business effects will depend on replacement LNG costs, the duration of supply disruptions, freight rates, terminal utilisation and whether companies can pass higher fuel expenses to customers.

    GAIL (India), Petronet LNG, Gujarat State Petronet, Gujarat Gas, Indraprastha Gas, Indian Oil Corporation, Bharat Petroleum Corporation, Hindustan Petroleum Corporation and Reliance Industries operate in areas connected to the wider gas and energy value chain. However, no company-specific earnings impact, management commentary or share-price reaction has been verified for this development.

    What Investors Should Monitor Next

    India’s shift towards suppliers such as Oman, Nigeria, the UAE and Angola points to a broader diversification of LNG sources. However, a wider supplier base also exposes importers to different shipping routes, contract terms, freight costs and geopolitical risks.

    The next relevant indicators include:

    • Whether Oman retains its leading position in subsequent monthly data.
    • Whether Qatar’s shipments recover as infrastructure capacity is restored.
    • Whether total Indian LNG imports remain below August levels.
    • How replacement cargo costs affect gas distributors and industrial users.
    • Whether official company disclosures identify any impact on margins or volumes.

    Investors following listed gas and energy companies can use online investing platforms to monitor exchange filings and corporate disclosures. Anyone seeking access to listed securities would generally need to open demat account online through a regulated intermediary. However, the September LNG data alone is not a buy, sell or hold signal.

    The latest figures show two simultaneous trends: India’s LNG supplier mix has become more varied, while total imports have fallen. Whether this represents a temporary disruption or a sustained change will depend on future shipment data and the restoration of supplies from major exporters.

    Related Stock Market Insights

    Check Indices
    BSE BANKEX Companies BSE Largecap Comapnies
    FINNIFTY Companies Nifty Midcap 50 Companies
    NIFTY MIDCAP 150 Companies Nifty Pharma Companies
    BSE 500 Companies Nifty Smallcap 100 Companies
  • Suryoday SFB Shares Jump 5% on Strong Q2 FY27 Business Update

    Suryoday SFB Shares Jump 5% on Strong Q2 FY27 Business Update

    Suryoday Small Finance Bank’s shares rose up to 5% on October 5, 2026 after its Q2 FY27 business update showed 35% deposit growth, 34.6% advance growth and a sharp fall in gross NPAs to 2.9%, signalling improved asset quality and funding stability for the lender.

    Shares Rise as Q2 Metrics Beat Expectations

    Suryoday Small Finance Bank (NSE: SURYODAY) saw its stock climb as much as 4.6% to an intraday high of ₹150.19 on Monday, October 5, 2026, following the release of its provisional business metrics for the July–September 2026 quarter. The previous close was ₹143.55, and the move came alongside a broader set of bank Q2 updates that lifted several banking stocks on the same day.

    The rally was driven by a combination of strong liability-side growth and a marked improvement in asset quality, two factors that matter especially for small finance banks, where funding costs and credit risk can swing sentiment quickly.

    What Changed in Q2 FY27

    Suryoday SFB’s regulatory filing for Q2 FY27 highlighted multiple growth and risk metrics:

    • Gross advances: Up 34.6% year-on-year (YoY) to ₹14,972 crore, after accounting for a ₹591 crore write-off.
    • Total deposits: Up 35% YoY to ₹16,184 crore, underlining robust liability growth.
    • Disbursements: Up 27.4% YoY to ₹3,095 crore, reflecting continued loan-book momentum.
    • CASA deposits: Up 26.8% YoY to ₹3,142 crore; CASA ratio stood at 19.4% as of September 30, 2026.
    • Gross NPA (GNPA): Fell 360 basis points quarter-on-quarter (QoQ) to 2.9% in Q2 FY27 from 6.5% in Q1 FY27.

    The sharp QoQ drop in GNPA is the standout number: it reduces the near-term credit-risk overhang and improves the bank’s risk profile ahead of its full quarterly results.

    Why Asset-Quality Improvement Matters

    For small finance banks, asset quality is a key valuation lever. A GNPA print of 2.9% down from 6.5% just one quarter earlier suggests better collections, tighter underwriting or both, and can support re-rating if sustained.

    At the same time, deposit growth of 35% YoY strengthens the funding base, which is critical for an SFB that relies heavily on retail and small-business liabilities. The CASA ratio of 19.4% remains modest by banking standards, indicating scope for improvement in low-cost deposits, but the absolute growth in CASA (to ₹3,142 crore) is a positive sign.

    Market Reaction and Price Context

    Suryoday SFB’s market capitalisation stood at around ₹1,534.83 crore as of October 5, 2026, placing it among the smaller listed SFBs where quarterly asset-quality swings can have a disproportionate impact on sentiment.

    Recent price context:

    • Intraday high (Oct 5, 2026): ₹150.19
    • Previous close: ₹143.55
    • 1-month performance: Down ~5%
    • YTD performance: Up ~2%
    • 52-week high: ₹218 (July 24, 2026)
    • 52-week low: ₹115.41 (February 24, 2026)

    The stock had been under pressure over the past month, so the Q2 business update provided a clear positive trigger for a relief rally.

    Governance Move: New Chief Risk Officer

    In a separate but relevant development, Suryoday SFB’s board appointed Alok Pathak as Chief Risk Officer, effective October 1, 2026, for a three-year term. This appointment, disclosed in an October 1 filing, reinforces the bank’s focus on risk management at a time when asset-quality trends are being closely watched by investors.

    While not a direct driver of Monday’s price move, the CRO appointment adds a governance layer that may support confidence in the sustainability of the improved GNPA trajectory.

    What Investors Should Track Next

    The key question for investors is whether the Q2 improvements can be maintained:

    • GNPA sustainability: Can the bank keep GNPA near current levels or lower in Q3 and beyond?
    • CASA trajectory: Any improvement in the CASA ratio would help lower funding costs and support margins.
    • Disbursement pace: Continued 20–30% YoY disbursement growth would validate loan-demand strength in its core segments.

    Provisional business updates often precede full quarterly results, and markets typically use them to adjust expectations ahead of the official earnings release.

    How Investors Can Participate

    For investors looking to trade or accumulate positions in small finance bank stocks like Suryoday SFB, participation requires the basic market infrastructure: open a demat account with a SEBI-registered broker and, for active traders, a linked trading account to manage entries and exits around such news-driven moves.

    Given the intraday volatility that can accompany business-update announcements, risk management position sizing, stop-loss discipline and awareness of liquidity is as important as the headline numbers.

    Related Stock Market Insights

    Explore Trending Indices
    Bank Nifty Nifty Commodities
    BSE 100 BSE BANKEX
    BSE SENSEX BSE MIDCAP
    Nifty IT Nifty 100
    FINNIFTY Nifty Pharma