findocblog

Category: Stock Market

  • What Is SENSEX?

    What Is SENSEX?

    What Is SENSEX?

    SENSEX is one of the most widely followed indicators of the Indian stock market and reflects the overall performance of the country’s equity space. It is a benchmark index that tracks 30 large, financially strong companies listed on the Bombay Stock Exchange (BSE), representing key sectors of the Indian economy. When investors look for the meaning of SENSEX, they are essentially seeking insight into broader market direction and investor sentiment. The term SENSEX stands for Sensitive Index, highlighting how closely it responds to movements in share prices, economic developments, corporate results, and global events.

    Due to its sensitivity and wide representation, SENSEX is often used as a reliable gauge of market trends and economic confidence in India.

    History and Evolution of the SENSEX Index

    The history of SENSEX dates back to 1986, when it was introduced by the Bombay Stock Exchange. At the time, it was India’s first stock market index designed to provide a clear snapshot of market performance.

    In its early years, SENSEX used a simple market capitalisation method. As the market evolved, the index methodology was refined to better reflect real market conditions. A major milestone in the SENSEX evolution came in 2003, when the calculation method shifted to free-float market capitalisation.

    How SENSEX Is Linked to the Bombay Stock Exchange (BSE)?

    SENSEX is closely connected to the Bombay Stock Exchange and functions as its flagship index. Often referred to as BSE SENSEX, it represents the performance of select companies listed and traded on the exchange. This relationship explains how SENSEX reflects trends within the broader SENSEX share market:

    • Exclusive BSE listing: Only companies listed on the Bombay Stock Exchange are eligible for inclusion in SENSEX, reinforcing its direct association with the exchange.
    • Index governance by BSE: The BSE oversees the composition, calculation methodology, and periodic review of the index to ensure accuracy and relevance.
    • Market performance indicator: Movements in SENSEX capture price changes in 30 large and influential companies, offering a snapshot of overall market sentiment.
    • Reflection of broader trends: As these companies span key sectors, their performance often mirrors wider developments across the Indian equity market.

    Through this structure, SENSEX serves as a reliable reference point for understanding market direction and investor confidence.

    Composition of SENSEX: The 30 Companies That Form the Index

    SENSEX is made up of 30 companies that rank among the top Indian companies in terms of size, liquidity, and market influence. These SENSEX companies are drawn from a wide range of sectors, including banking, information technology, energy, consumer goods, pharmaceuticals, and manufacturing. Their collective performance provides a balanced view of the Indian equity market.

    Key characteristics of SENSEX companies include:

    • Strong market capitalisation
    • High trading liquidity
    • Established operating and financial history
    • Significant representation of core economic sectors

    The composition of SENSEX is reviewed periodically and may change to remain relevant. The criteria for SENSEX selection are applied to ensure fairness, transparency, and accuracy, including:

    • Mandatory listing on the Bombay Stock Exchange
    • Consistent trading volumes and liquidity
    • Large free-float market capitalisation
    • Sectoral balance within the index
    • A proven compliance and governance record

    These selection criteria help preserve SENSEX as a reliable and credible market benchmark.

    How SENSEX Is Calculated and Why the Methodology Matters?

    To calculate the SENSEX, the Bombay Stock Exchange uses the free-float market capitalisation method. This approach considers only those shares that are available for public trading, while excluding promoter holdings, government stakes, and other restricted shareholdings. As a result, the index reflects actual market participation rather than total company ownership.

    The importance of SENSEX lies in this calculation methodology, as it ensures a more accurate representation of market movements. By focusing on free-float shares, the index avoids distortion caused by large but infrequently traded holdings.

    Free-float market capitalisation refers specifically to the portion of a company’s equity that is actively traded in the open market. Its use in SENSEX calculation helps to:

    • Reflect real-time market activity more effectively
    • Reduce the overrepresentation of closely held companies
    • Improve comparability across different sectors and firms

    This methodology aligns SENSEX with global best practices followed by major international indices.

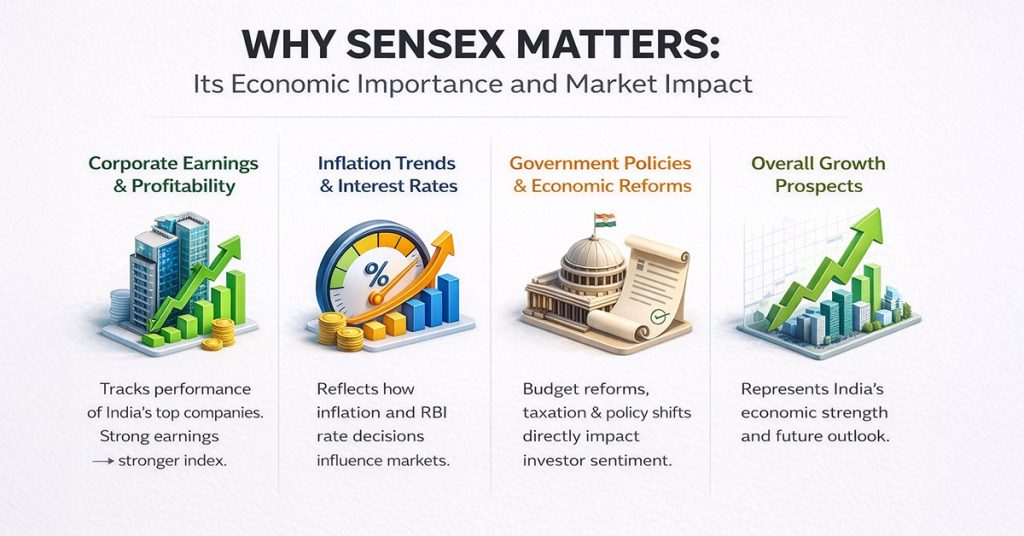
    Why SENSEX Matters: Its Economic Importance and Market Impact

    SENSEX

    The economic impact of SENSEX goes well beyond daily stock price movements. Changes in the index influence investor confidence, market sentiment, and broader financial discussions, often shaping expectations around growth and stability. A consistently rising index is commonly associated with economic optimism, while sustained declines may reflect underlying concerns within the economy.

    The importance of SENSEX also stems from its role as a widely accepted benchmark. Fund managers, analysts, and institutional investors rely on it to assess portfolio performance and compare returns across investment products.

    SENSEX is frequently viewed as a barometer of the Indian economy, as it reflects investor perceptions of key factors such as:

    • Corporate earnings and profitability
    • Inflation trends and interest rate expectations
    • Government policies and economic reforms
    • Overall growth prospects

    When economic conditions are favourable, improved corporate performance is often mirrored in a stronger SENSEX. Conversely, economic uncertainty typically leads to higher volatility in the index.

    Ways to Invest in SENSEX: Investment Options Explained

    Investors cannot directly purchase the SENSEX index, but they can invest in SENSEX through financial products designed to track its performance. These options provide exposure to the broader market without requiring the selection of individual stocks.

    Common ways to invest in SENSEX include:

    • SENSEX ETF: Exchange-traded funds that replicate the index and are bought and sold on stock exchanges like regular shares
    • Index mutual funds: Funds structured to mirror SENSEX returns over the long term by holding the same constituent stocks

    To access these investment options, investors need a trading and demat setup, and many choose to open demat account online for faster onboarding and seamless participation in the equity market. These options are often preferred for their diversification, transparency, and cost efficiency compared to actively managed funds.

    Understanding SENSEX Trends and Market Movements With Findoc

    Monitoring SENSEX market trends allows investors to see how various factors influence the Indian stock market. Key influences include:

    • Changes in interest rates and monetary policy
    • Corporate earnings reports and performance
    • Government regulations and policy announcements
    • Global economic developments and geopolitical events

    Through SENSEX analysis with Findoc, these market movements are broken down in a structured and clear manner. This approach helps investors:

    • Interpret index fluctuations without confusion
    • Identify patterns and trends in the SENSEX share market
    • Make better and more disciplined investment decisions

    By understanding these trends, investors can align their strategies with prevailing market conditions and long-term economic outlooks.

    Conclusion

    SENSEX continues to be a vital indicator of the Indian stock market and investor sentiment. Since its inception in 1986, it has evolved into a benchmark that reflects the performance of major companies across key sectors of the economy. Understanding how SENSEX is constructed, how it responds to market movements, and its broader significance helps investors make better decisions.

    Beyond tracking share prices, it provides insights into economic trends and market confidence, making it an essential reference for both new and experienced participants in India’s equity markets.

    Frequently Asked Questions

    SENSEX companies are reviewed periodically by the BSE to ensure the index reflects the market accurately. Changes are made based on liquidity, market capitalisation, sector representation, and performance of listed firms.

    SENSEX tracks 30 leading companies listed on the Bombay Stock Exchange, whereas NIFTY tracks 50 major companies on the National Stock Exchange, serving as distinct benchmarks for the Indian stock market.

    Investors cannot buy the SENSEX directly. However, exposure is possible through SENSEX ETFs or index mutual funds, which replicate the index’s performance and offer diversified market participation.

    SENSEX movements are influenced by corporate earnings, macroeconomic data, interest rate changes, government policies, and global events, reflecting overall investor sentiment and expectations about the Indian economy.

    While SENSEX comprises large-cap companies, it provides market insights relevant to all investors, helping assess trends, benchmark portfolios, and understand the broader health of the Indian equity market.

    Global developments such as economic trends, geopolitical events, and international market fluctuations impact investor sentiment, often leading to volatility in SENSEX and influencing trading behaviour in the Indian share market.

  • How to Read Intraday Candlestick Chart Patterns?

    How to Read Intraday Candlestick Chart Patterns?

    How to Read Intraday Candlestick Chart Patterns?

    Intraday analysis requires timely, structured information on price movements. Intraday candlestick patterns provide this by presenting market activity in a clear visual format, showing how prices fluctuate within shorter time intervals. These formations help illustrate shifts in buying and selling pressure throughout the trading day and are an essential part of technical analysis. Findoc explains these concepts in a systematic and accessible manner, enabling readers to understand how intraday patterns contribute to short-term market analysis.

    For beginners looking to participate actively in the markets, learning these patterns becomes even more valuable once they open demat account online, as it helps them make informed intraday decisions from day one.

    What Are Intraday Trading Chart Patterns?

    Intraday trading chart patterns are recognisable formations created by candlesticks on a price chart, showing how the market behaves within shorter time intervals. These patterns reflect shifts in buying and selling activity and help present intraday movement in an organised visual structure.

    Every candlestick shows four things for that time period:

    • Opening price
    • Closing price
    • Highest price
    • Lowest price

    When many candles are viewed together, they form identifiable intraday chart patterns. These patterns help in analysing short-term market behaviour and understanding how price movement develops during the trading day.

    Also Read: What is Intraday Trading?

    Common Intraday Chart Patterns

    Intraday chart patterns are recurring candlestick formations observed on short-term price charts. These patterns help analyse how market sentiment evolves during the trading day and offer a structured way to study intraday movement. Individual candles provide immediate price information; multi-candle formations give a broader view of short-term behaviour. Intraday patterns are generally grouped into bullish reversal, bearish reversal and continuation patterns.

    Bullish Patterns

    Bullish patterns suggest that downward momentum may be slowing and that buyers are becoming more active within the intraday timeframe. Common examples include:

    • Hammer: A candle with a small real body and a long lower shadow, indicating that prices moved lower during the period but later recovered.
    • Bullish Engulfing: A larger green candle covers the previous red candle, reflecting a shift in intraday sentiment toward buying pressure.
    • Morning Star: A three-candle formation that appears after a decline, showing a transition from selling pressure to signs of renewed demand.

    Bearish Patterns

    Bearish patterns signal that upward momentum may be weakening and that sellers are beginning to exert more influence on the intraday chart.

    • Hanging Man: Visually similar to a hammer but appears after an upward movement, indicating intraday selling interest at higher levels.
    • Bearish Engulfing: A red candle that completely covers the previous green candle; this reflects increased selling activity within the session.
    • Evening Star: A three-candle pattern that appears after an upmove and reflects a shift from buying strength to emerging selling pressure.

    Continuation Patterns

    This pattern shows that the prevailing intraday trend may remain the same, subject to confirmation from subsequent candles.

    • Doji: A candle with minimal body, this represents indecision. When aligned with the broader context, it may support continuation once the next candle confirms direction.
    • Three White Soldiers: Three consecutive green candles with progressively higher closes, representing sustained intraday buying interest.
    • Three Black Crows: Three successive red candles that close lower each time, reflecting consistent intraday selling momentum.

    Additional Read: How to Start Online Trading?

    Key Components of a Candlestick Chart

    An intraday candlestick chart represents intraday price movement through a set of clearly defined elements. Each candle provides information about how prices behaved within a specific interval. The main components are as follows:

    1. The Real Body

    The real body reflects the difference between the opening and closing prices for the chosen time period.

    • A green body indicates a close above the open.
    • A red body indicates a close below the open.

    The size of the body shows the extent of buying or selling within that interval.

    2. The Wick or Shadow

    The wicks extend above and below the real body and mark the highest and lowest prices reached during the session.

    • The upper wick represents the intraday high.
    • The lower wick represents the intraday low.

    These ranges offer insight into price fluctuations beyond the open and close.

    3. Candle Extremes

    The top and bottom of the candle highlight the key price points for the interval.

    • In a green candle, the bottom of the body marks the open and the top marks the close.
    • In a red candle, the top of the body marks the open and the bottom marks the close.

    These levels help outline the path price has taken within the period.

    4. The Trend

    A sequence of candles forms visible trends on an intraday chart. Several consecutive green candles may indicate sustained buying interest, while repeated red candles may reflect ongoing selling pressure. Trend direction offers essential context when assessing intraday movement.

    5. Pattern Formation

    Patterns emerge in the chart when multiple candles appear in a specific pattern. Their collective structure helps identify reversal or continuation tendencies on an intraday trading chart. Multi-candle formations often provide broader insight than individual candles viewed in isolation.

    You May Also Like: Best Intraday Indicators to Improve Your Trading Strategy

    Steps to Apply Candlestick Patterns in Intraday Trading

    Applying intraday candlestick patterns in trading involves a structured analysis of market conditions rather than just relying on any single formation. The following steps show how these patterns are typically assessed within short-term price analysis

    1. Identify the Market Environment

    Determine whether the price is moving upward, downward, or within a narrow range. Candlestick patterns are more helpful when they are used in the context of an existing trend.

    2. Observe Relevant Patterns

    A sequence of candles is analysed to identify whether any recognised pattern is developing. The surrounding price action helps determine whether the formation aligns with prevailing market conditions.

    3. Refer to Technical Reference Points

    Use tools such as support and resistance levels, moving averages, or volume indicators to better understand market conditions. These references help validate whether the observed pattern aligns with broader market behaviour.

    4. Define Entry and Exit Zones

    Identify the areas on the chart where participation may occur and where positions can be closed. These zones are usually determined by technical levels instead of isolated candles.

    5. Apply Stop-Loss Measures

    Stop-loss levels are essential for effectively managing potential losses. They establish specific points at which a position is deemed no longer valid from a technical standpoint.

    6. Maintain Risk Parameters

    It is advisable to limit exposure to a small percentage of available capital. Implementing a consistent risk management framework is essential for mitigating the potential for disproportionate losses during periods of intraday volatility.

    Also Read: Understanding Trading, Profit and Loss Account

    Conclusion

    Intraday candlestick chart patterns offer a structured way to observe short-term market movement and identify how buying and selling activity develops within the trading day. These formations help present price behaviour in a clear visual format and support a more organised approach to analysing intraday trends. When assessed with confirmation and broader market context, they contribute meaningfully to technical interpretation. Findoc explains these concepts concisely and systematically, enabling readers to understand how intraday patterns fit into overall market analysis.

    Frequently Asked Questions

    The colour of the next candlestick cannot be predicted with certainty. Market participants analyse price structure, support and resistance levels, volume behaviour, and overall trend context to assess potential direction, but outcomes remain probabilistic rather than guaranteed.

    The 3-candle rule involves observing three consecutive candles moving in the same direction before evaluating short-term momentum. This approach helps reduce reliance on isolated candles that may not accurately reflect broader price behaviour.

    Patterns such as Hammer, Engulfing formations, Doji variations, and Morning Star structures are frequently used in intraday analysis. Their effectiveness depends on confirmation, volume support, and alignment with the prevailing market trend.

    The 3-5-7 rule refers to analysing price behaviour over groups of three, five, or seven candles. These groupings help identify short-term momentum shifts and provide a structured way to observe whether strength or weakness is developing in the market.

    The 1% rule is a risk management guideline that limits exposure on a single position to no more than 1% of total trading capital. Its objective is to control downside risk and support long-term consistency.

    Intraday trading carries higher risk due to rapid price movements within short timeframes. Beginners may find these fluctuations challenging without sufficient preparation. A disciplined approach, risk control, and structured analysis are essential in such environments.

    Candlestick patterns tend to be more reliable in stocks with higher liquidity and trading volume. In low-volume stocks, price movements can be erratic, making pattern-based analysis less consistent.

  • Beginner’s Guide to Share Market Basics in India

    Beginner’s Guide to Share Market Basics in India

    If you’re new to investing and curious about what the stock market really is, think of it as a marketplace where people buy and sell units of companies, called shares. In India, most of this action happens on well-known platforms like the Bombay Stock Exchange and the National Stock Exchange. By investing in the stock market, you get a chance to become a part-owner of companies you believe in and potentially grow your money as these companies do well.

    How the Stock Market Works

    Knowing how the stock market world can make investing seem much simpler. Below is how it functions:

    Companies List Shares: Businesses sell a portion of their ownership through shares.

    • Investors Buy & Sell: People trade these shares via stock exchanges.
    • Price Changes: The share prices fluctuate according to demand, supply, and the performance of the company.
    • Profits or Losses: Investors earn through rising prices or dividends.

    The following flowchart will give you a better idea of how the process goes:

    Company Growth Plan → Issues Shares via IPO → Shares Listed on Stock Exchange → Investors Buy/Sell Shares → Share Prices Go Up/Down

    Components of the Stock Market (Exchanges, Instruments, Participants)

    There are various components in the stock market that work together to ensure that you can buy and sell smoothly. Some of the key components are:

    Component Description
    Exchanges Platforms like the National Stock Exchange (NSE) and the Bombay Stock Exchange (BSE) are where shares are listed and traded.
    Instruments It includes stocks, bonds, mutual funds, derivatives, and exchange-traded funds, allowing a wide range of investment and trading.
    Participants Buyers and sellers, including retail investors, institutional investors, brokers, and regulators, ensure smooth market functioning.

    Types of Markets: Primary vs Secondary vs OTC

    Market Type Description
    Primary Market Where new shares are sold for the first time via IPO (Initial Public Offering)
    Secondary Market Where old shares are bought and sold between people (e.g., stock exchanges like NSE)
    OTC (Over-the-Counter) Trading that happens directly between two parties, not on a stock exchange

    Each market plays a unique role in how securities are issued and traded. Together, they ensure companies can raise funds while investors have opportunities to buy, sell, and manage their investments.

    Related Read: What is Online Stock Trading?

    Benefits of the Stock Market

    • Ownership: When you buy shares, you become a part-owner of a company, in turn, having a share in its growth.
    • Earning Potential: When the company performs well, the share has a higher valuation, and you can get profits when it is sold.
    • Dividends: Many companies pay regular dividends, providing a steady income in addition to potential price gains.
    • Liquidity: It is easy to purchase or sell shares and get access to money invested when you need it..
    • Diversification: The share market enables you to invest in various sectors as well as firms, hence minimising risk.
    • Transparency: It is regulated by SEBI, which determines fair trading and investor protection.

    Key Stock Market Terminology Every Beginner Should Know

    By familiarising yourself with the common terms used in the stock market, you can invest more easily. Some of the key terminologies are:

    • Stock: A share in the ownership of a company.
    • Demat Account: An online account to hold shares in digital form.
    • IPO: When a company issues its shares to the public for the very first time..
    • Broker: An individual or company that assists you in buying and selling shares.
    • Bull Market: A time when stock prices are increasing.
    • Bear Market: A time when stock prices are decreasing.
    • Dividend: Money paid to shareholders from company profits.
    • Volatility: How rapidly stock prices increase or decrease.


    Also Read: What is a Demat Account?

    How to Start in the Stock Market in India

    1) Open a Demat and Trading Account: This is required to buy and hold shares.

    2) Choose a Broker: Choose one that is SEBI-registered and has a simple platform.

    3) Conduct Research: About the company, its revenues, projected growth, etc.

    4) Start Small: Start with a small number to learn how the market works.

    5) Use Tools to Assist: Most brokers will have price charts, research, news and feeds.

    6) Monitor Your Investment: Check the share price frequently, as well as the company’s performance.

    You can open a free Demat account online with Findoc and get easy-to-use tools, live updates, and expert research, making it ideal for beginners who wish to invest confidently.

    Additional Blogs

    Frequently Asked Questions

    For trading, you must: open an online Demat and trading account with an SEBI registered broker, deposit money in the account, research stocks, and place the buy/sell orders online via the broker’s website.

    Both are a way to refer to a portion of ownership in a company. “Stock” is the general concept, “shares” is a more specific way to define units of stock. For example, you may have purchased 10 shares of stock from Reliance.

    Equity is another term for shares. When you buy equities, you are purchasing part of the company, which means you could benefit from increased value and profitability of the company.

    Yes, you can invest through the internet with various trading applications and websites. Just open a Demat account, link it to your bank account, and you can invest from any location.

    There are two general types of stock: common stock (which offers voting power and dividends) and preferred stock (which offers preference for dividends but does not have voting power).

    The 5% rule is to put no more than 5% of your money into a single stock. It reduces risk and allows for diversification.

  • What is Muhurat Trading? Meaning, Date and Timing in 2025

    What is Muhurat Trading? Meaning, Date and Timing in 2025

    Muhurat Trading is a special stock market session that happens once a year on Diwali evening. The word “Muhurat” means auspicious time. Investors and traders believe that buying or selling stocks during this time brings good luck and wealth for the new year.

    Even though the stock market is closed for Diwali, exchanges like the National Stock Exchange (NSE)andBombay Stock Exchange (BSE) open for one hour in the evening for Muhurat Trading. For many, it is more about starting the new financial year with positive energy and blessings, rather than chasing profits. It symbolises wealth creation and new beginnings.

    Muhurat Trading 2025 Date and Time

    Muhurat Trading for the year 2025 will be held on Tuesday, October 21, during Laxmi Pujan, one of the most auspicious occasions of Diwali. Both NSE and BSE will conduct this special one-hour session in the evening. Here’s the detailed schedule:

    Session Type Timing
    Pre-Open Session 1:30 PM – 1:45 PM
    Muhurat Trading 1:45 PM to 2:45 PM
    Closing Session 2:55 PM – 3:05 PM

    This symbolic trading session is seen as a way to welcome wealth and prosperity in the new financial year.

    Importance of Muhurat Trading in Indian Stock Markets

    Muhurat Trading holds deep cultural and emotional significance in India. It is more than just a trading session; it marks the beginning of a new financial year with hope, positivity, and blessings. Many investors use this opportunity to buy shares for long-term holding, gift stocks to loved ones, or begin fresh financial planning. Performing Laxmi Pujan, praying for wealth and prosperity, is a common ritual during this time. Stockbrokers often light diyas and wear traditional attire, creating a festive atmosphere. For many, Muhurat Trading is a symbolic act of ushering in good fortune and successful investing.

    Cultural & Astrological Significance of Muhurat Trading

    In Hindu tradition, Diwali signifies the beginning of a new financial year, especially for business communities. It is believed that Goddess Laxmi, the goddess of wealth and prosperity, blesses wealth-related activities during this time. The Muhurat, or auspicious hour, is carefully chosen based on astrological calculations to ensure success and good fortune. Investors and traders participate in Muhurat Trading, even with a small transaction, as a ritual to invite prosperity and positive financial energy for the year ahead.

    Benefits of Muhurat Trading

    Muhurat Trading offers more than just market participation; it blends financial discipline with cultural tradition. Here are some of the key benefits:

    • Auspicious Start: Offers a spiritually and culturally positive way to begin the new financial year.
    • Token Investment: Encourages disciplined investing by making small, meaningful purchases.
    • Long-Term Goals: Investors often choose quality stocks with the intention of holding them long term.
    • Festive Feel: Blends finance with festivity, allowing families to participate in market traditions together.
    • Positive Sentiment: The overall mood is optimistic, reflecting collective hopes for wealth and prosperity.

    These unique aspects make Muhurat Trading a memorable and meaningful experience for investors each year.

    Popular Stocks to Watch During Muhurat Trading 2025

    Here are some popular stock categories to consider during Muhurat Trading 2025, based on past investor preferences and market trends:

    • Blue-Chip Companies: Trusted names like TCS, HDFC Bank, and Reliance are often favoured for long-term stability.
    • Banking & Finance Stocks: Banks and NBFCs are seen as growth enablers in India’s economy.
    • Infrastructure & Power Stocks: Companies in this sector benefit from government spending and reforms.
    • IT Sector Stocks: A preferred choice for global exposure and tech-driven growth.
    • FMCG Companies: Brands like HUL and Nestlé offer consistent returns and low volatility.

    Findoc offers real-time insights and stock recommendations to help you make smart investment choices during this festive season. Additionally, you can easily open a demat account with Findoc to start your investment journey.

    Muhurat Trading Strategies for Beginners

    Here are some beginner-friendly strategies to make the most of Muhurat Trading:

    • Do Your Research: Choose fundamentally strong companies with consistent performance.
    • Keep It Simple: Start with a small, symbolic investment to gain experience.
    • Think Long Term: Focus on stocks you can hold for years, not quick trades.
    • Plan Ahead: Prepare and place your orders early to avoid a last-minute rush.
    • Take Advice: Consult your broker or advisor if you’re unsure where to begin.

    These simple steps can help you start your investment journey on a positive and informed note.

    Things to Avoid During Muhurat Trading

    While Muhurat Trading is festive and symbolic, it’s still important to stay mindful and disciplined. Here are a few things to avoid:

    • Avoid Buying Just Because It’s Trending: Choose stocks with strong fundamentals, not hype.
    • Don’t Follow Unverified Tips: Always cross-check tips or advice before acting on them.
    • Don’t Overinvest: Stick to your budget and risk appetite.
    • Avoid Panic Moves: Remember, this session is more about tradition than aggressive trading.

    By avoiding these mistakes, you can enjoy a more meaningful and mindful trading experience.

    How to Participate in Muhurat Trading?

    Participating in Muhurat Trading is easy if you already have a Demat and trading account. Here’s how to join:

    1. Check the Muhurat timing with your broker.
    2. Log in to your trading account before the session starts.
    3. Do your research and decide what you want to buy or sell.
    4. Place your order during the 1:45 PM to 2:45 PM window.
    5. Confirm the trade and check your account after it settles.

    Even if you’re not an active trader, this is a great time to start investing in the stock market with small steps.

    FAQs

    Muhurat Trading is a special one-hour stock market session held on Diwali evening. It is done to mark the beginning of the Hindu New Year and is believed to bring good luck and prosperity. Investors make small, symbolic investments to seek blessings from Goddess Laxmi, the deity of wealth.

    Muhurat Trading 2025 is scheduled for Tuesday, October 21, 2025. The main trading session will be held between 6:15 PM and 7:15 PM. There are also short sessions before and after for block deals, pre-open, call auction, and closing activities.

    Muhurat Trading is more about tradition and symbolism than quick profits. While some stocks may rise due to festive sentiment, investors mainly use this session to make long-term investments. It’s best not to expect instant profits from this one-hour session.

    Yes, beginners can invest during Muhurat Trading. It’s a great time to start with small, symbolic investments in strong companies, learn market basics, and begin one’s financial journey positively.

    Muhurat Trading is a one-hour special session held on Diwali, marked by cultural significance and symbolic investing, unlike regular trading which follows normal hours and is purely profit-focused.

  • What Is the India Volatility Index and How Is It Calculated?

    What Is the India Volatility Index and How Is It Calculated?

    India Volatility Index reflects the amount that traders believe the stock market will fluctuate in the coming 30 days. It is based on NIFTY index option prices and is used to check market uncertainty. A high India VIX means traders expect big price changes, usually due to uncertain market conditions. A low India VIX means the market is calm and stable. It is commonly referred to as the “fear index” since it reflects how anxious or optimistic investors are. India VIX assists investors and traders in comprehending market risk and making better trade plans.

    What Is India VIX Index?

    India VIX Index is a special index that measures the “volatility” or expected movement in the NIFTY VIX, but it doesn’t predict whether prices will go up or down. A higher value signals nervousness or uncertainty in the market, while a lower value suggests stability and confidence.

    • High Value: Indicates big price swings due to fear or uncertainty.
    • Low Value: Suggests calm conditions with fewer price changes.
    • Helps in Risk Planning: It is Useful for traders and investors to decide on strategies.
    • Short-Term Focus: Represents expectations only for the next 30 days.

    How Is India VIX Calculated?

    The India VIX is calculated using a special formula to show how much market movement is expected in the next 30 days, expressed as an annual percentage. It uses option prices and the Black-Scholes Model to find implied volatility.

    Below is the formula to calculate India VIX:

    India VIX = 100 × √((Sum [Weighted Implied Volatility Squared]) / Total Weight)

    Element Description
    Weighted IV² Squared implied volatilities, each weighted for relevance
    Total Weight Total of all the weights used for calculation.
    Result Gives the expected annual volatility of the NIFTY for the next 30 days.

    This formula is based on the global VIX method but adapted for Indian NIFTY options.

    Interpreting India VIX Levels (Low, Medium, High)

    Understanding VIX levels helps you know how much the market may move.

    VIX Level What It Indicates
    Low (Below 15) The market is calm with less price movement expecteds
    Medium (15 to 25) Normal volatility, typical for most trading sessions
    High (Above 25) Traders are cautious or fearful, expecting big price swings
    • High VIX = More risk and price swings
    • Low VIX = More stability, less movement

    History & Evolution of India VIX

    India VIX was launched in 2008 by the National Stock Exchange (NSE) to help traders and investors understand how much the market prices might move. It was inspired by the U.S.-based CBOE VIX, also called the “fear index.” India VIX uses NIFTY options data to predict how much the market could move in the next 30 days. Over time, it became popular as a way to see market fear or confidence during events like elections, global problems, or financial crises. Today, India VIX is an important tool that helps investors manage risks and plan their trading strategies more easily and clearly.

    Significance of India VIX for Traders and Investors

    India VIX is an important tool for traders and investors because it helps them understand the market conditions and plan their strategies better. It works as an early signal of possible price changes.

    • Measures Market Fear or Confidence: A high VIX means more uncertainty, while a low VIX shows stability.
    • Helps in Risk Management: Traders can adjust their positions when market volatility is expected to rise.
    • Supports Option Pricing: Useful for options traders to price contracts more accurately.
    • Assists in Hedging Decisions: Investors use VIX trends to protect their portfolios.
    • Gives Clarity During Events: Important during elections, budgets, or global news that may impact markets.
    • Guides Long and Short-Term Strategies: Helps in planning trades effectively.

    How to Use India VIX in Trading & Risk Management

    • Track India VIX daily: It helps in understanding the market mood.
    • Adjust position size: Reduce exposure when VIX is high.
    • Options strategies: Use VIX to decide when to buy or sell options.
    • Hedging risk: During high VIX, investors may use put options to protect investments.
    • Avoid overtrading: High VIX often leads to sharp price swings.
    • Set wider stop losses: In high-VIX conditions, give trades more room.

    Findoc offers real-time access to India VIX, helping traders stay updated and manage their risks better.

    India VIX vs CBOE VIX: Global Comparisons

    India VIX and CBOE VIX are both volatility indexes, but are used in different markets. While India VIX is linked to NIFTY 50 options, CBOE VIX is linked to the S&P 500 index in the U.S. These indexes help traders understand market mood and possible price changes.

    Feature India VIX CBOE VIX (US)
    Market Tracked NIFTY 50 (India) S&P 500 Index (USA)
    Volatility Range Typically 15–35 Typically 10–30
    Usage Indian stock & options traders Global risk indicator
    Purpose Shows the expected NIFTY volatility index Shows expected S&P 500 volatility
    Calculation Based on NIFTY options & Black-Scholes Model Based on S&P 500 options & similar model

    India VIX Derivatives: Futures, Options & ETFs

    Apart from using India VIX as an indicator, traders also have access to financial products that let them trade directly on volatility expectations. Some popular instruments include:

    • VIX Futures: Trade on expected future volatility levels
    • VIX Options: Options contracts based on VIX movement
    • VIX ETFs (abroad): Funds that follow volatility indices.

    These tools help advanced traders bet on volatility without needing to guess the market direction.

    Conclusion

    India VIX is a smart way to measure market risk and confidence. Whether you’re a short-term trader or a long-term investor, understanding India VIX helps you make informed decisions. It doesn’t tell you the market’s direction, but it warns you how much prices might move. That alone can make a big difference when planning your trades or managing your portfolio.

    Read Other Interested Blog:

    Frequently Asked Questions

    A “good” VIX level depends on your view. Usually, a level below 20 indicates a stable market and above 25 implies high uncertainty or fear among traders.

    You can trade VIX futures on NSE using your trading account, similar to other derivatives. It requires margin money and understanding of volatility strategies, not direct stock price movement.

    VIX cannot predict crashes directly, but rising VIX often signals growing fear or uncertainty. A sudden spike can indicate higher chances of big price swings, including market declines.

    You can check the live India VIX value on the NSE website, your broker’s trading platform, or financial news apps that show real-time market data and volatility levels.

    Yes, VIX helps everyday traders understand market sentiment and risk. It doesn’t show which way the market will move, but signals how volatile it may be in the short term.

  • India Has Become the World’s 4th Largest Economy by Surpassing Japan

    India Has Become the World’s 4th Largest Economy by Surpassing Japan

    India has officially ascended to the position of the world’s fourth-largest economy in 2025, surpassing Japan, as reported by the International Monetary Fund (IMF) in its April 2025 World Economic Outlook. India’s nominal Gross Domestic Product (GDP) is projected at $4.187 trillion, slightly edging out Japan’s $4.186 trillion.

    Key Drivers of India’s Economic Ascent

    1. Structural Reforms and Policy Initiatives

    Since 2014, India has implemented significant structural reforms, including the introduction of the Goods and Services Tax (GST), the Insolvency and Bankruptcy Code (IBC), and the ‘Make in India’ initiative. These measures have streamlined taxation, improved the ease of doing business, and attracted foreign direct investment (FDI) .

    2. Digital Infrastructure and Financial Inclusion

    India’s emphasis on digital infrastructure, exemplified by the Unified Payments Interface (UPI), has revolutionized financial transactions. The Jan Dhan-Aadhaar-Mobile (JAM) trinity has facilitated financial inclusion, bringing millions into the formal banking system.

    3. Demographic Dividend and Labor Force Participation

    With a median age of around 28 years, India boasts a young and dynamic workforce. This demographic advantage has contributed to increased productivity and consumption, fueling economic growth.

    4. Export Growth and Diversification

    India has diversified its export portfolio, with significant growth in pharmaceuticals, information technology services, and engineering goods. This diversification has enhanced India’s resilience to global economic fluctuations.

    Comparative Economic Indicators (2025)

    Country Nominal GDP (USD Trillion) Real GDP Growth Rate (%)
    United States 30.5 2.1
    China 19.2 4.8
    Germany 4.74 1.5
    India 4.19 6.2
    Japan 4.18 0.6
    Source: IMF World Economic Outlook, April 2025

    Future Outlook

    The IMF projects that India will surpass Germany to become the third-largest economy by 2027, with a nominal GDP exceeding $5.5 trillion . Continued emphasis on infrastructure development, education, and healthcare is expected to sustain this growth trajectory.

  • BSNL, MTNL Aim to Monetise ₹1,000 Crore in Land Assets to Reduce Debt Burden

    BSNL, MTNL Aim to Monetise ₹1,000 Crore in Land Assets to Reduce Debt Burden

    In a renewed effort to improve their financial health, state-owned telecom companies Bharat Sanchar Nigam Ltd (BSNL) and Mahanagar Telephone Nigam Ltd (MTNL) plan to monetise land assets worth ₹1,000 crore during FY26. This move is part of a broader revival strategy aimed at reducing debt and boosting liquidity.

    However, the timeline may face delays due to procedural hurdles at the state level.

    What This Article Covers

    • Overview of the land monetisation plan
    • BSNL and MTNL’s current financial status
    • Execution challenges and bottlenecks
    • Alignment with the government’s asset monetisation goals

    Key Highlights of the Land Monetisation Plan

    • Target Value: ₹1,000 crore
    • Execution Timeline: FY26 (by March 2026)
    • Mode: Sale or lease of commercially viable land parcels
    • Coordinating Department: Department of Public Enterprises (DPE), Ministry of Finance

    BSNL has identified two to three prime land parcels for sale or lease. MTNL is also expected to contribute to the total target. These properties are situated in commercially attractive zones and may draw interest from institutional investors. However, challenges like state-level approvals and title verifications could complicate execution.

    Financial Overview: BSNL and MTNL

    Both BSNL and MTNL continue to grapple with financial distress, primarily due to:

    • Declining subscriber bases
    • Legacy infrastructure
    • Fierce competition from private telecom operators

    Debt Status:

    • BSNL (as of November 2024): ₹23,297 crore
    • MTNL (as of March 31, 2025): ₹33,000 crore in total liabilities
    • MTNL Loan Defaults: ₹8,346 crore across seven public sector banks

    Despite receiving a revival package in 2019—which included sovereign guarantee bonds and a Voluntary Retirement Scheme (VRS)—the fiscal pressure remains high.

    In response to MTNL’s financial distress, Cabinet Secretary T.V. Somanathan recently held a high-level meeting with heads of public sector banks to prevent these loans from turning into Non-Performing Assets (NPAs).

    Execution Challenges: Why Monetising Land Isn’t Easy

    While the ₹1,000 crore target appears modest relative to the companies’ liabilities, officials caution that achieving it will be complex. Land is a state subject, making the process dependent on state-level cooperation.

    Key hurdles include:

    • Ownership verification
    • Clear and updated land titles
    • Multiple layers of approval from state governments

    Officials suggest that actual monetisation could extend into FY27, depending on the speed of these clearances.

    Government’s Larger Asset Monetisation Push

    This move aligns with the Government of India’s broader infrastructure financing agenda through asset monetisation.

    • Budget 2025 Target: ₹10 lakh crore worth of asset monetisation between 2025 and 2030
    • Previous Target (2021): ₹6 lakh crore up to 2025
    • BSNL & MTNL’s Contribution (So Far): ₹12,984 crore via earlier monetisation efforts

    Although there have been discussions about potential privatisation, the government has reaffirmed that no such plans are currently under consideration.

    Will Monetisation Deliver Relief?

    The proposed land monetisation worth ₹1,000 crore represents a crucial step toward reducing the debt burden of BSNL and MTNL. However, the success of the initiative hinges on resolving procedural bottlenecks at the state level.

    Timely execution will be critical to converting these dormant assets into financial resources that can stabilize the balance sheets of these public sector undertakings.

  • Mahindra Lifespace Developers Announces ₹1,496 Crore Rights Issue – Record Date Set for May 23

    Mahindra Lifespace Developers Announces ₹1,496 Crore Rights Issue – Record Date Set for May 23

    Mahindra Lifespace Developers Ltd (MLDL), the real estate and infrastructure arm of the Mahindra Group, has announced a rights issue to raise up to ₹1,496.28 crore. The capital raised will support the company’s ongoing growth initiatives, including debt repayment and funding for future real estate acquisitions.

    The record date to determine shareholders eligible for the rights entitlement is May 23, 2025. The issue will open on June 2, 2025, and close on June 17, 2025.

    Rights Issue Highlights

    • Issue Price: ₹257 per share
    • Face Value: ₹10 per share
    • Total Issue Size: 5,82,20,901 equity shares (₹1,496.28 crore)
    • Entitlement Ratio: 3 rights equity shares for every 8 fully paid-up equity shares held as of the record date
    • Renunciation Deadline: June 12, 2025
    • Expected Listing Date: June 20, 2025

    About Mahindra Lifespace Developers Ltd

    Mahindra Lifespace Developers Ltd is a pioneer in sustainable urban development and industrial infrastructure. It operates across two key verticals:

    1. Residential Development

    Through the Mahindra Lifespaces and Mahindra Happinest brands, the company develops eco-conscious residential projects across major metros such as Mumbai, Bengaluru, Pune, Chennai, and Hyderabad.

    2. Integrated Cities and Industrial Clusters (IC&IC)

    This vertical comprises large-scale infrastructure developments under Mahindra World City and Origins by Mahindra. These projects focus on creating industrial ecosystems, urban infrastructure, and economic corridors.

    Operational Pipeline (as of March 2025):

    • Completed Projects: 22.70 million sq. ft.
    • Ongoing Projects: 10.05 million sq. ft.
    • Future Development Phases: 2.73 million sq. ft.
    • Upcoming Launches: 11.98 million sq. ft.

    In FY25, the Residential vertical reported pre-sales of ₹2,803.56 crore, while the IC&IC vertical covered 5,737 acres, highlighting MLDL’s scale and execution capabilities.

    Objectives of the Rights Issue

    The net proceeds from the rights issue will be allocated towards:

    • Repayment or prepayment of borrowings – up to ₹1,005 crore
    • Acquisition of land, real estate projects, development rights, and FSI premiums
    • General corporate purposes

    This capital raise is a key component of the company’s strategic growth roadmap, aimed at enhancing balance sheet strength and capital flexibility for future expansion.

    Financial Snapshot (Consolidated, ₹ in crore)

    Metric FY24 FY23
    Revenue ₹18,463.10 ₹15,796.85
    Profit After Tax ₹2,260.87 ₹1,943.05
    Net Worth ₹21,529.46 ₹19,933.25
    Total Borrowings ₹0.00 ₹0.00

    MLDL continues to maintain a debt-free balance sheet, underscoring its financial prudence while aggressively scaling operations in residential and industrial segments.

    Market Outlook and Investment Considerations

    At the time of the announcement, Mahindra Lifespace shares were trading at ₹351.85, offering a significant discount compared to the rights issue price of ₹257 per share. However, after adjusting for dilution (1.4x factor), the fair value per share is estimated at ₹325.98.

    Despite a 24% decline in stock value in 2025, this rights issue is expected to unlock long-term value by strengthening project execution capabilities and reducing future financing constraints.

    Key Dates to Remember

    Event Date
    Last Date to Buy Shares May 22, 2025
    Record Date May 23, 2025
    Credit of Rights Entitlements May 26, 2025
    Issue Opens June 2, 2025
    Last Date for Renunciation June 12, 2025
    Issue Closes June 17, 2025
    Basis of Allotment Finalized June 18, 2025
    Shares Credited to Demat Accounts June 19, 2025
    Listing on Stock Exchanges June 20, 2025

    Final Thoughts

    Mahindra Lifespace’s ₹1,496 crore rights issue signals its confidence in India’s real estate recovery and its commitment to sustainable, large-scale development. Eligible shareholders as of May 23, 2025, should assess the attractive pricing, dilution impact, and long-term growth potential before subscribing.

    Disclaimer: This article is for informational purposes only and should not be considered investment advice.

  • Aditya Birla Fashion & Retail (ABFRL) Demerges Madura Unit to Unlock Shareholder Value

    Aditya Birla Fashion & Retail (ABFRL) Demerges Madura Unit to Unlock Shareholder Value

    Aditya Birla Fashion and Retail Ltd (ABFRL) has formally demerged its Madura Fashion & Lifestyle (MFL) business, creating a standalone listed entity—Aditya Birla Lifestyle Brands Ltd (ABLBL). The record date for the demerger, May 22, 2025, marks a pivotal shift in the company’s structural and strategic framework.

    Strategic Rationale Behind the Demerger

    The vertical demerger is designed to sharpen the strategic focus of both entities. MFL, a legacy business housing major menswear brands like Louis Philippe, Van Heusen, Allen Solly, and Peter England, accounted for nearly 70% of ABFRL’s consolidated revenue in FY23.

    Under the new structure, MFL will operate independently under ABLBL, allowing ABFRL to focus on high-growth segments such as ethnic wear, luxury brands, innerwear, digital-first labels, and value retail (e.g., Pantaloons). According to Chairman Kumar Mangalam Birla, “This realignment is aimed at unlocking value and empowering each business to pursue its growth journey with sharper strategic intent.”

    Shareholding & Listing Mechanics

    The demerger follows a mirror shareholding model—shareholders of ABFRL will receive one share of ABLBL for every share held in ABFRL, maintaining identical ownership structures in both companies. This strategy ensures value continuity for existing investors.

    ABLBL is expected to be listed as a separate entity by the end of 2025, subject to regulatory approvals from SEBI and the NCLT.

    Financial Restructuring and Capital Deployment

    Post-demerger, ABFRL plans to raise ₹2,500 crore in equity within 12 months. The capital infusion is aimed at strengthening the company’s balance sheet and fueling expansion in its core growth areas. The promoter group has committed full support for this fundraising initiative.

    In terms of debt allocation, approximately ₹1,000 crore will be transferred to ABLBL, while ABFRL retains the remaining liabilities. This structured realignment is expected to improve capital efficiency and reduce leverage pressure on both sides.

    Historical Context and Corporate Trajectory

    ABFRL was created in 2015 through the consolidation of Madura Garments and Pantaloons. Over the last decade, it has grown through acquisitions such as Forever 21 India, Jaypore, and Sabyasachi. The MFL demerger is the company’s most significant corporate restructuring since its inception, aligning with the group’s broader strategy of fostering focused business verticals.

    Market Implications and Sectoral Impact

    This move places ABFRL among Indian conglomerates such as Reliance and Tata that have embraced demergers to enable operational agility. According to ICICI Securities, “The demerger could unlock substantial value given MFL’s strong EBITDA-generating potential and high brand recall across Tier I and Tier II markets.”

    With India’s fashion and apparel sector undergoing rapid consolidation, this realignment sets a precedent for similar moves across the retail landscape.

    Execution Risks and Outlook

    While the market has responded positively to the demerger announcement, analysts caution against near-term volatility. Key risks include:

    • Margin pressure from input cost inflation
    • Shifting consumer behavior in post-pandemic retail
    • Integration challenges for ABFRL’s remaining verticals

    However, the long-term outlook remains optimistic. ABLBL, with its established brand portfolio and wide distribution network, is expected to command a premium valuation once listed.

    What Investors Should Watch

    Investors should track:

    • ABLBL’s listing timeline and governance structure

    • ABFRL’s capital raise progress and reinvestment plans

    • Q1FY26 results from both entities for clarity on post-demerger performance

    Final Thoughts

    The strategic demerger of Madura Fashion & Lifestyle positions both ABFRL and ABLBL for greater focus, financial independence, and investor transparency. As the retail ecosystem evolves, this move underscores the group’s commitment to sustainable, long-term value creation in India’s growing fashion market.

  • Mahindra & Mahindra Financial Services Ltd Announces ₹2,996 Crore Rights Issue

    Mahindra & Mahindra Financial Services Ltd Announces ₹2,996 Crore Rights Issue

    Mahindra & Mahindra Financial Services Ltd (MMFSL), one of India’s leading non-banking financial companies (NBFCs), has launched a rights issue worth ₹2,996.16 crore to strengthen its capital base and support future growth initiatives. The record date for shareholder eligibility has been set as May 14, 2025, and the issue will open for subscription on May 22, 2025.

    This rights issue aims to bolster the company’s long-term lending capacity, improve regulatory capital buffers, and accelerate its digital transformation plans.

    Rights Issue Details

    • Issue Size: ₹2,996.16 crore

    • Number of Shares Offered: 15.44 crore fully paid-up equity shares

    • Issue Price: ₹194 per share (Face value: ₹2; Premium: ₹192)

    • Rights Ratio: 1 equity share for every 8 fully paid-up shares held

    • Record Date: May 14, 2025

    • Issue Opens: May 22, 2025

    • Issue Closes: June 6, 2025

    Shareholders will be required to pay the full issue price at the time of application. They can either subscribe to the entitled shares or renounce their rights, partially or fully, through stock exchanges or off-market transfers within the specified dates.

    About Mahindra & Mahindra Financial Services Ltd

    Mahindra & Mahindra Finance is a prominent NBFC under the Mahindra Group umbrella, catering primarily to rural and semi-urban India. The company specializes in vehicle financing, SME loans, and other financial products tailored to underserved markets.

    As of now, MMFSL has over 1,300 branches across India and serves more than 8 million customers. The rights issue is seen as a strategic move to prepare the company for the next leg of expansion, especially in the post-pandemic credit demand recovery phase.

    Financial Performance Snapshot

    FY25 Performance Highlights:

    • Post-Tax Profit: ₹2,345 crore (up 33% YoY)

    • Loan Book Growth: 17%

    • Net Interest Income (NII): ₹2,156 crore (up 9% YoY)

    • Interest Margin: 6.5% (down from 7.1% YoY)

    Q3 FY25 was notably strong, with:

    • PAT: ₹899 crore (up 63% YoY)

    • Total Income: ₹4,144 crore (up 19% YoY)

    • Disbursements: ₹16,467 crore (up 7% YoY)

    These results reflect overall strength in business momentum, albeit with some recent pressure on margins and provisioning.

    Shareholder Outlook

    Ahead of the rights issue announcement, shares of Mahindra Finance traded 2.35% lower, closing at ₹255.15 on the BSE. The market appears to be cautiously optimistic, with attention now shifting to subscription levels and the deployment of raised capital.

    This capital infusion is expected to:

    • Enhance capital adequacy
    • Improve long-term lending capabilities
    • Support digital and operational growth
    • Meet evolving regulatory norms

    For existing shareholders, the rights issue presents an opportunity to increase their stake at a discount to the current market price. However, the decision to subscribe or renounce will depend on individual investment strategies and outlook on the company’s future trajectory.

    Looking Ahead

    With a steady loan book expansion and focus on rural credit delivery, Mahindra Finance continues to be a key player in India’s financial inclusion landscape. The successful execution of this rights issue could position the company to capitalize on upcoming credit cycles, especially in the rural and semi-urban segments where it enjoys strong brand equity.

    Disclaimer: This article is for informational purposes only and should not be considered as investment advice.