
We are excited to share that Findoc is all set to integrate TradingView charts on all our platforms (Web and Mobile App). Now, you can easily analyze charts using TradingViews’s robust charting features and functions.
Here are some of the key features that will be unlocked as a result of this integration between Findoc and TradingView:
Multiple Full-screen Charts View with Pop-Out Feature
Now, you can open multiple charts for different stocks and also keep track of each one of them individually. With the help of a stock screener, you can easily filter and analyze stocks based on various criteria, ensuring you focus on the most relevant opportunities. You can also set your own timeframes in each chart, allowing you to concentrate on both short-term movements and long-term trends simultaneously.
It is quite easy to switch between these different charts or view them all at once. Thus, making sure to manage multiple stocks at the same time. This setup helps you stay on top of the market whether you’re day trading on simply monitoring instruments.
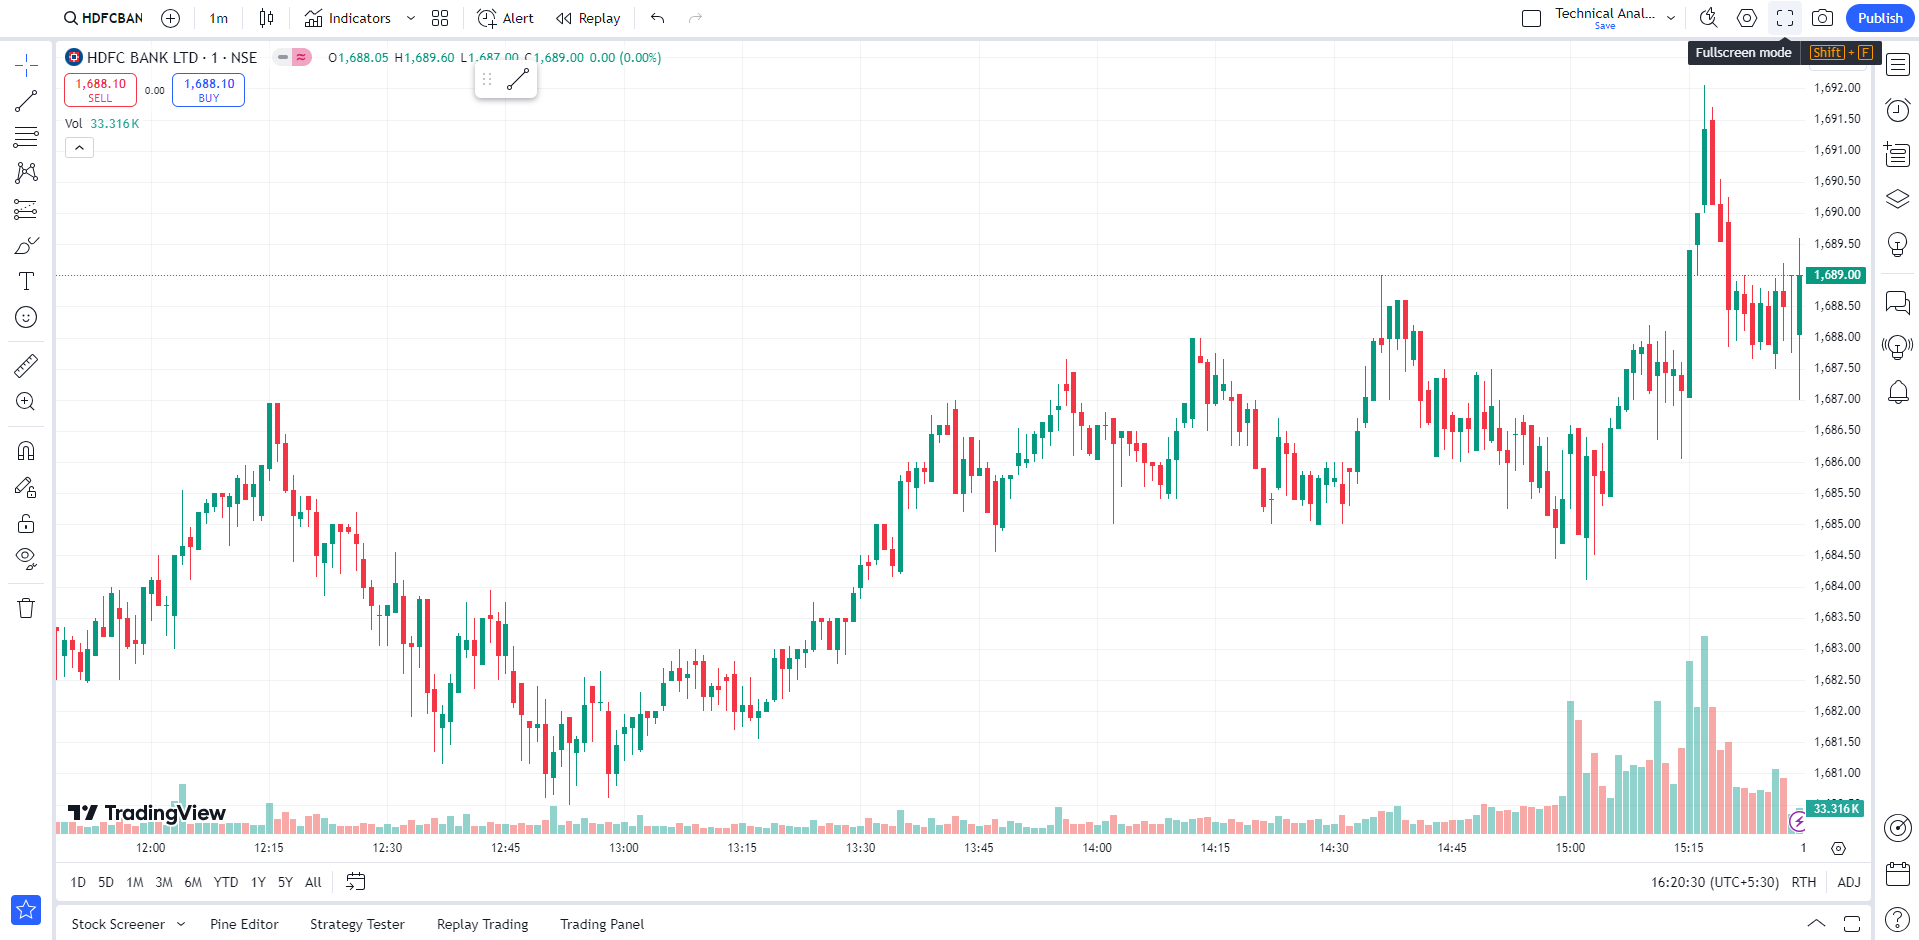
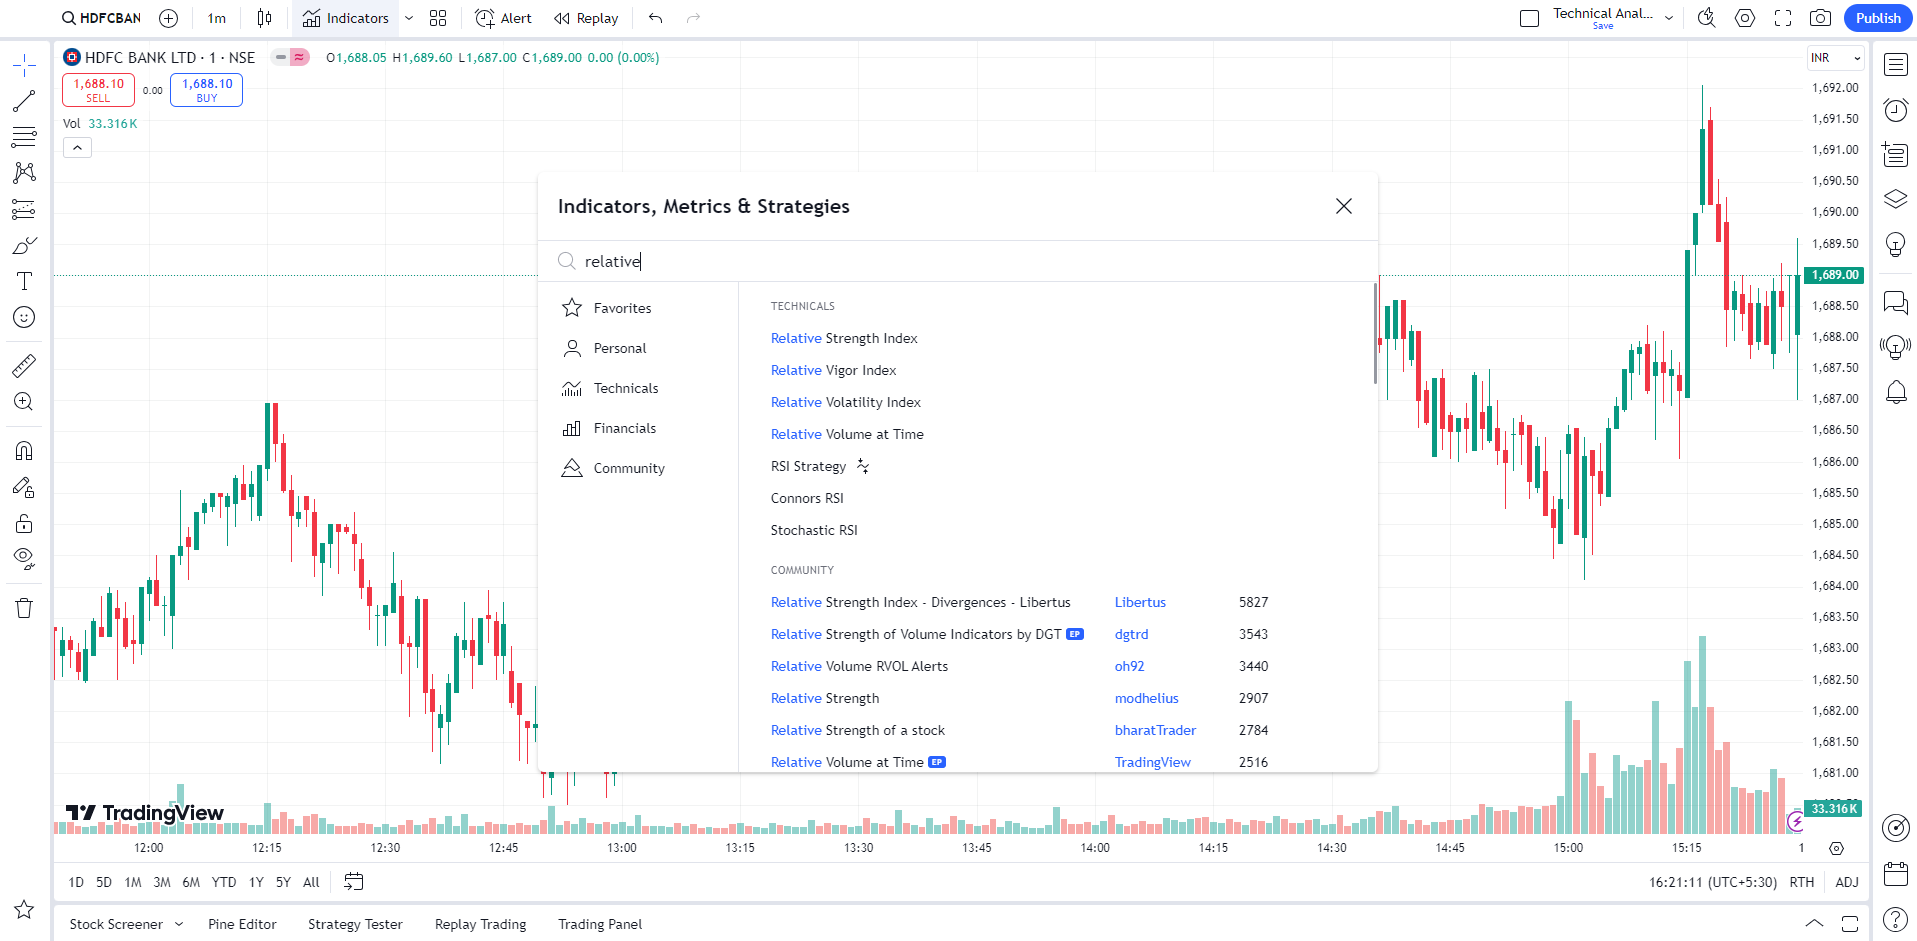
Advanced Indicators and Drawing Tools
With the new advanced indicators and drawing tools on TradingView, you can level up your technical analysis game. This new feature will help you track trends, identify support and resistance levels and also analyze chart patterns. Be it moving averages, oscillators, trendlines or Fibonacci retracements, this new feature gives you all the power to make informed decisions. This is perfect for advanced traders looking for more precision and depth in their analysis to spot opportunities and manage risks better.
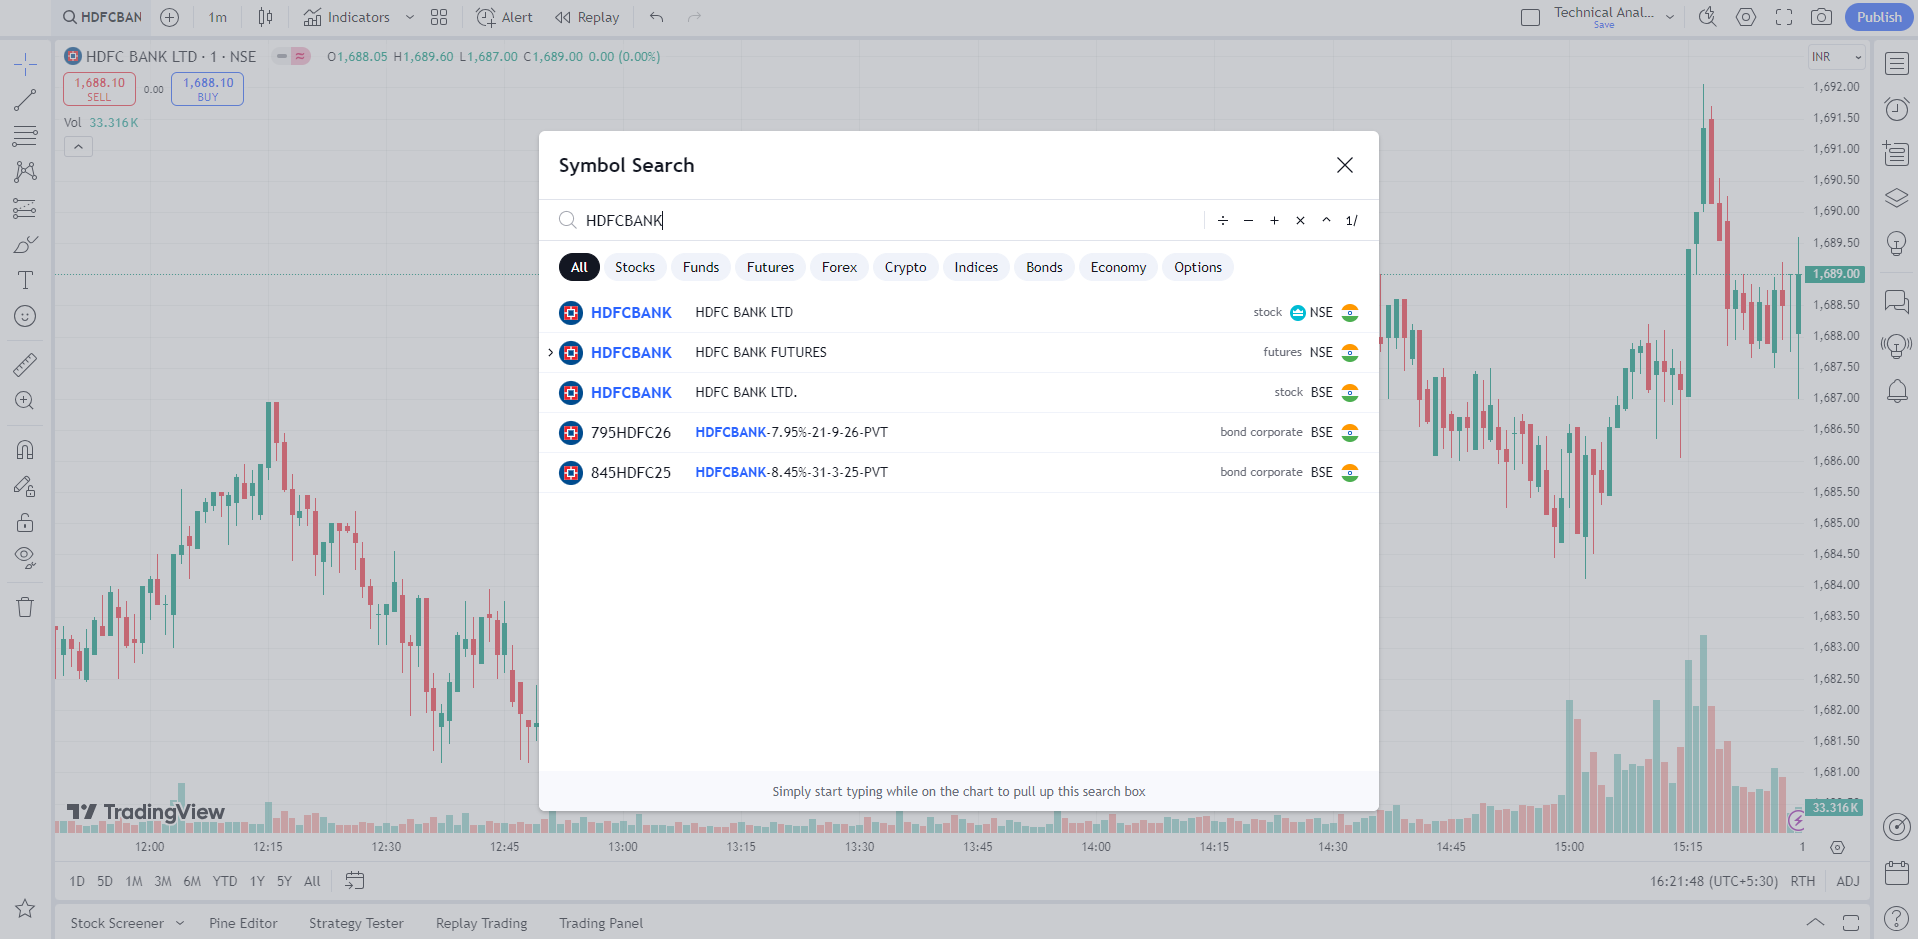
Effortless Stock Search and Addition
Adding new stocks with just a few keystrokes is now a reality. It has become a lot easier to find stocks and add them to your watchlist and your full screen chart. No need to navigate through different menus. This feature helps you to switch between different stocks, allowing you to focus on analysis and not on managing your setup. This feature will help you stay agile and efficient during the fast moving markets.
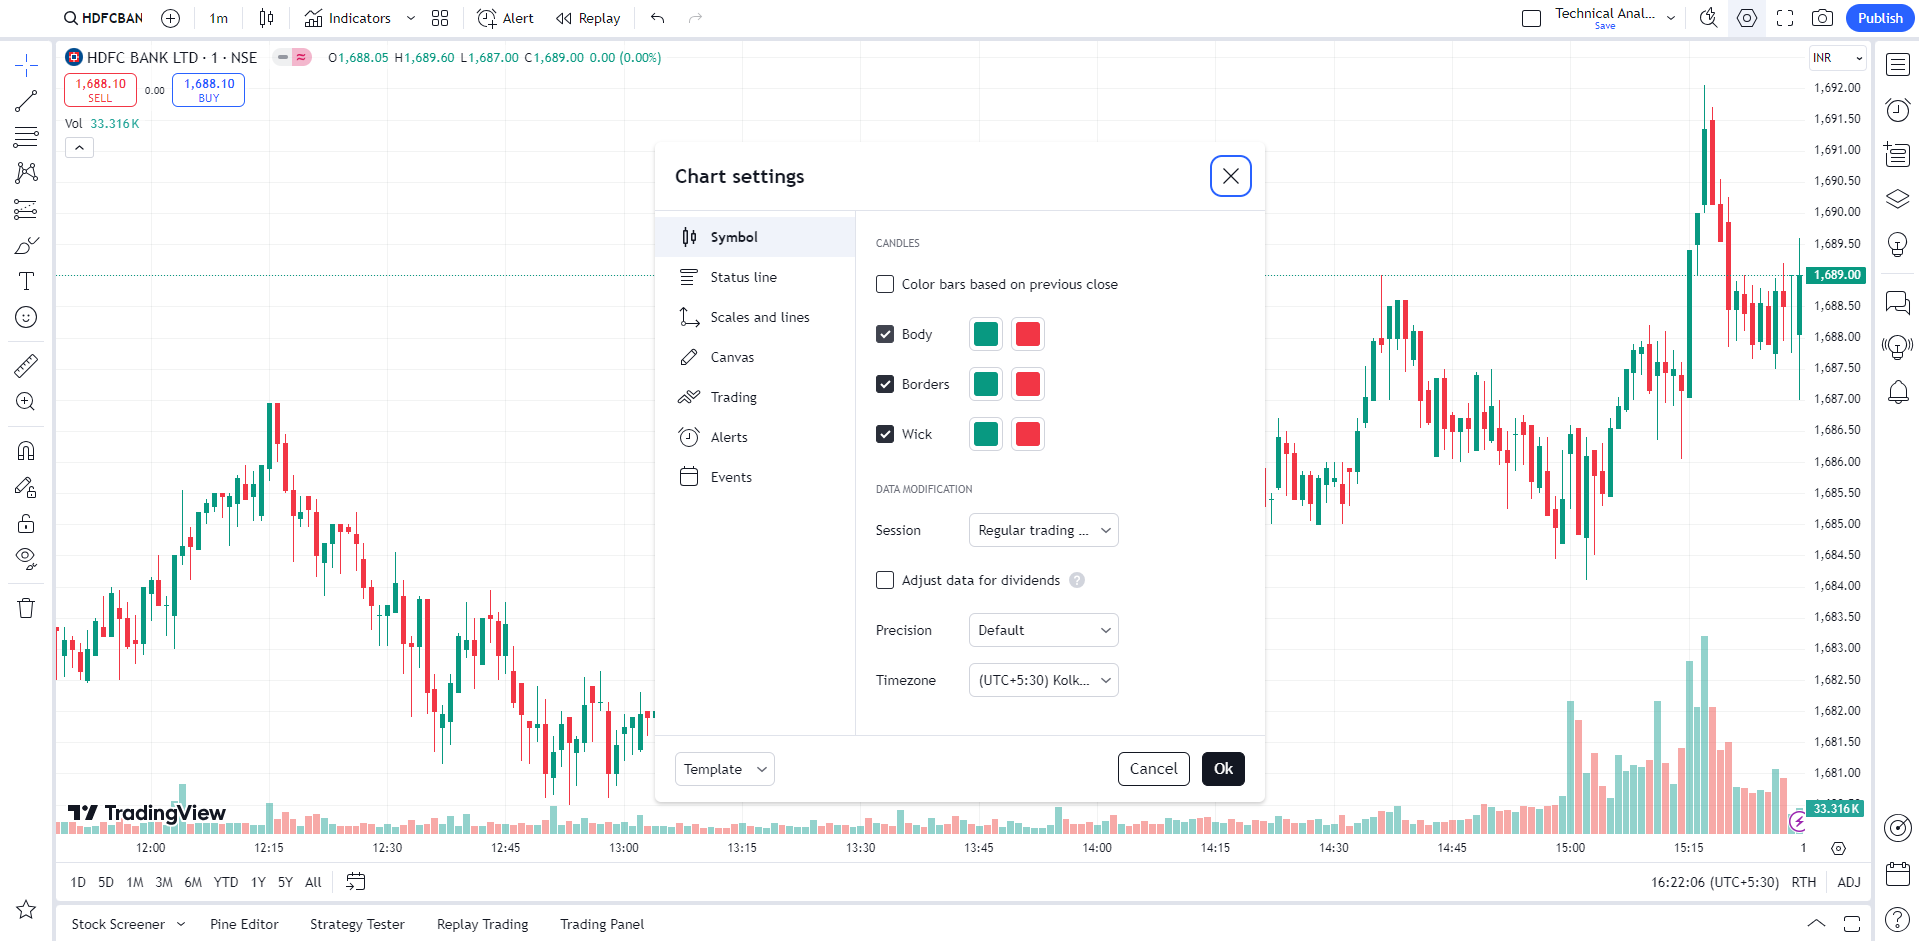
Customizable Chart Colors and Lines
Now, it is easy to customize your charts by choosing from a wide range of colors and lines to suit your preferences. Be it highlighting trends, making certain data stand out or simply creating a cleaner view. These customization options also allow you to design charts to enhance readability and customize your workflow to fit your needs. You can even adjust the thickness of lines or apply different color schemes to indicators, interpret data more clearly and efficiently. This feature helps traders to clearly see the charts and tailor it specifically to their needs.
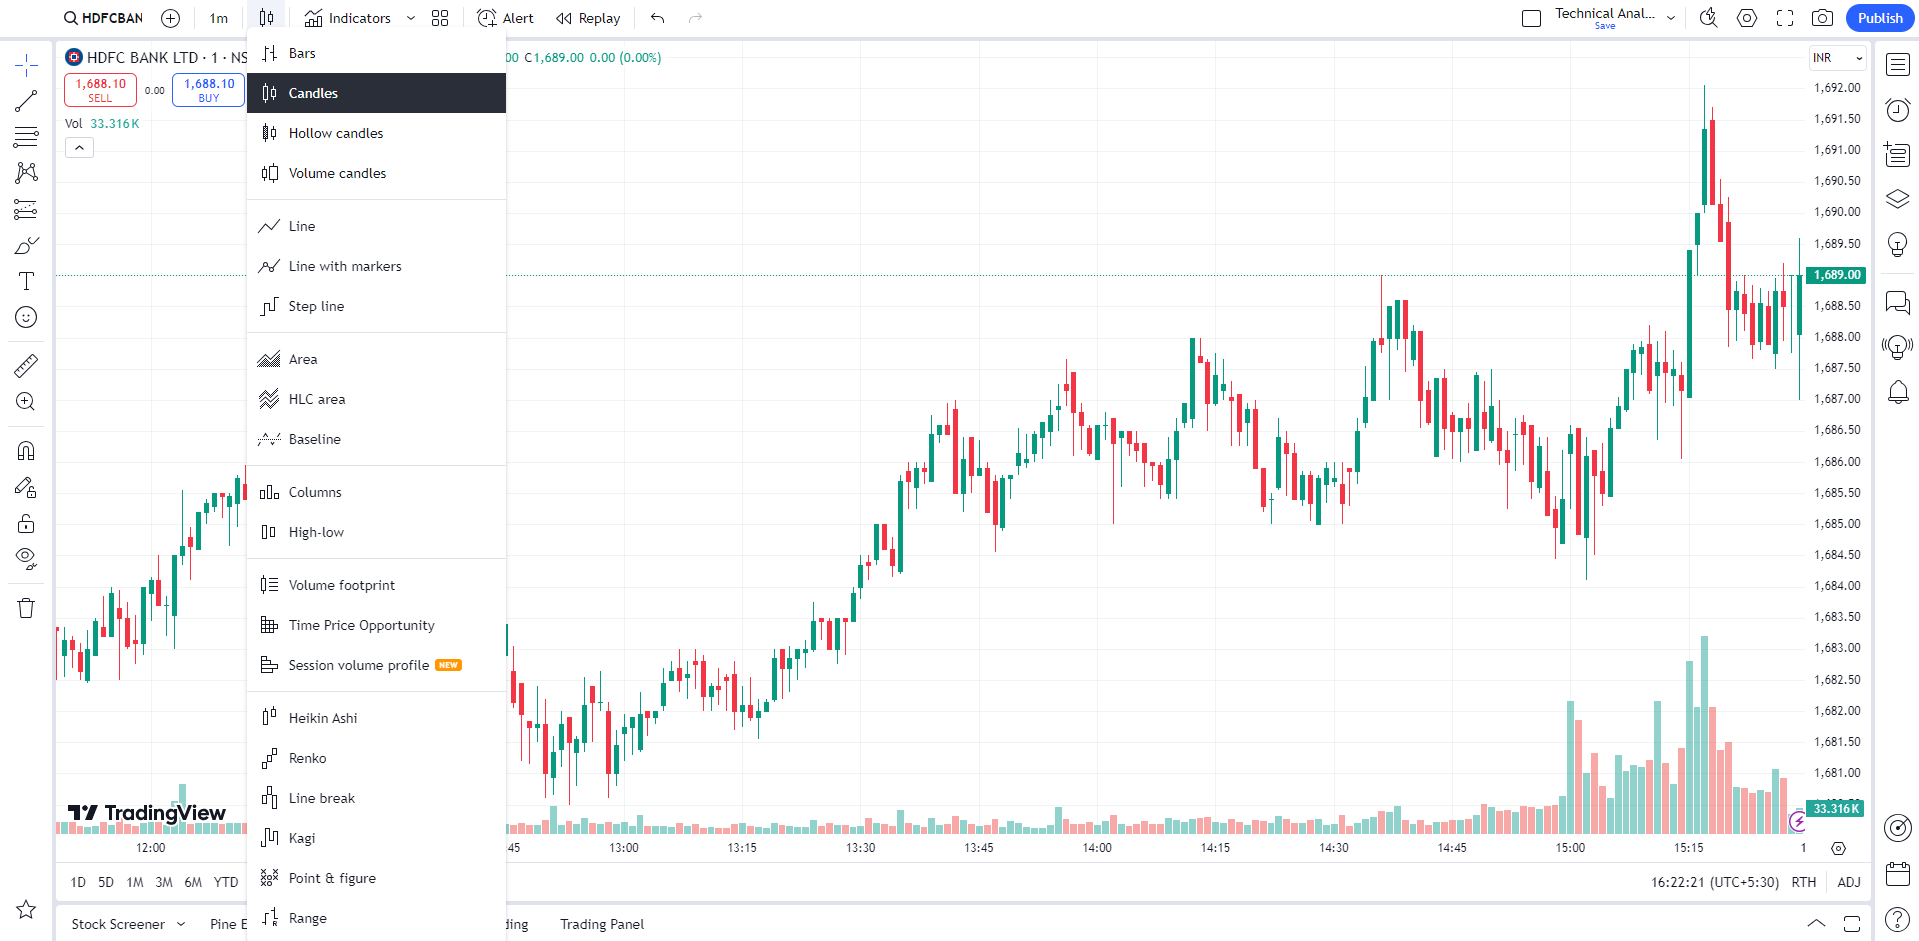
Diverse Chart Types
Be it candlesticks, bar charts, line graphs or even Heiken-Ashi, it is now easy to choose a chart type from all these varieties of chart types. Each chart type offers a different view on price action and allows you to gain deeper insights into market trends and patterns. Now, you can easily switch between them and choose the one that fits your trading strategy or current market conditions. This flexible approach allows us to best visualize the data that is meaningful and personalized for you.
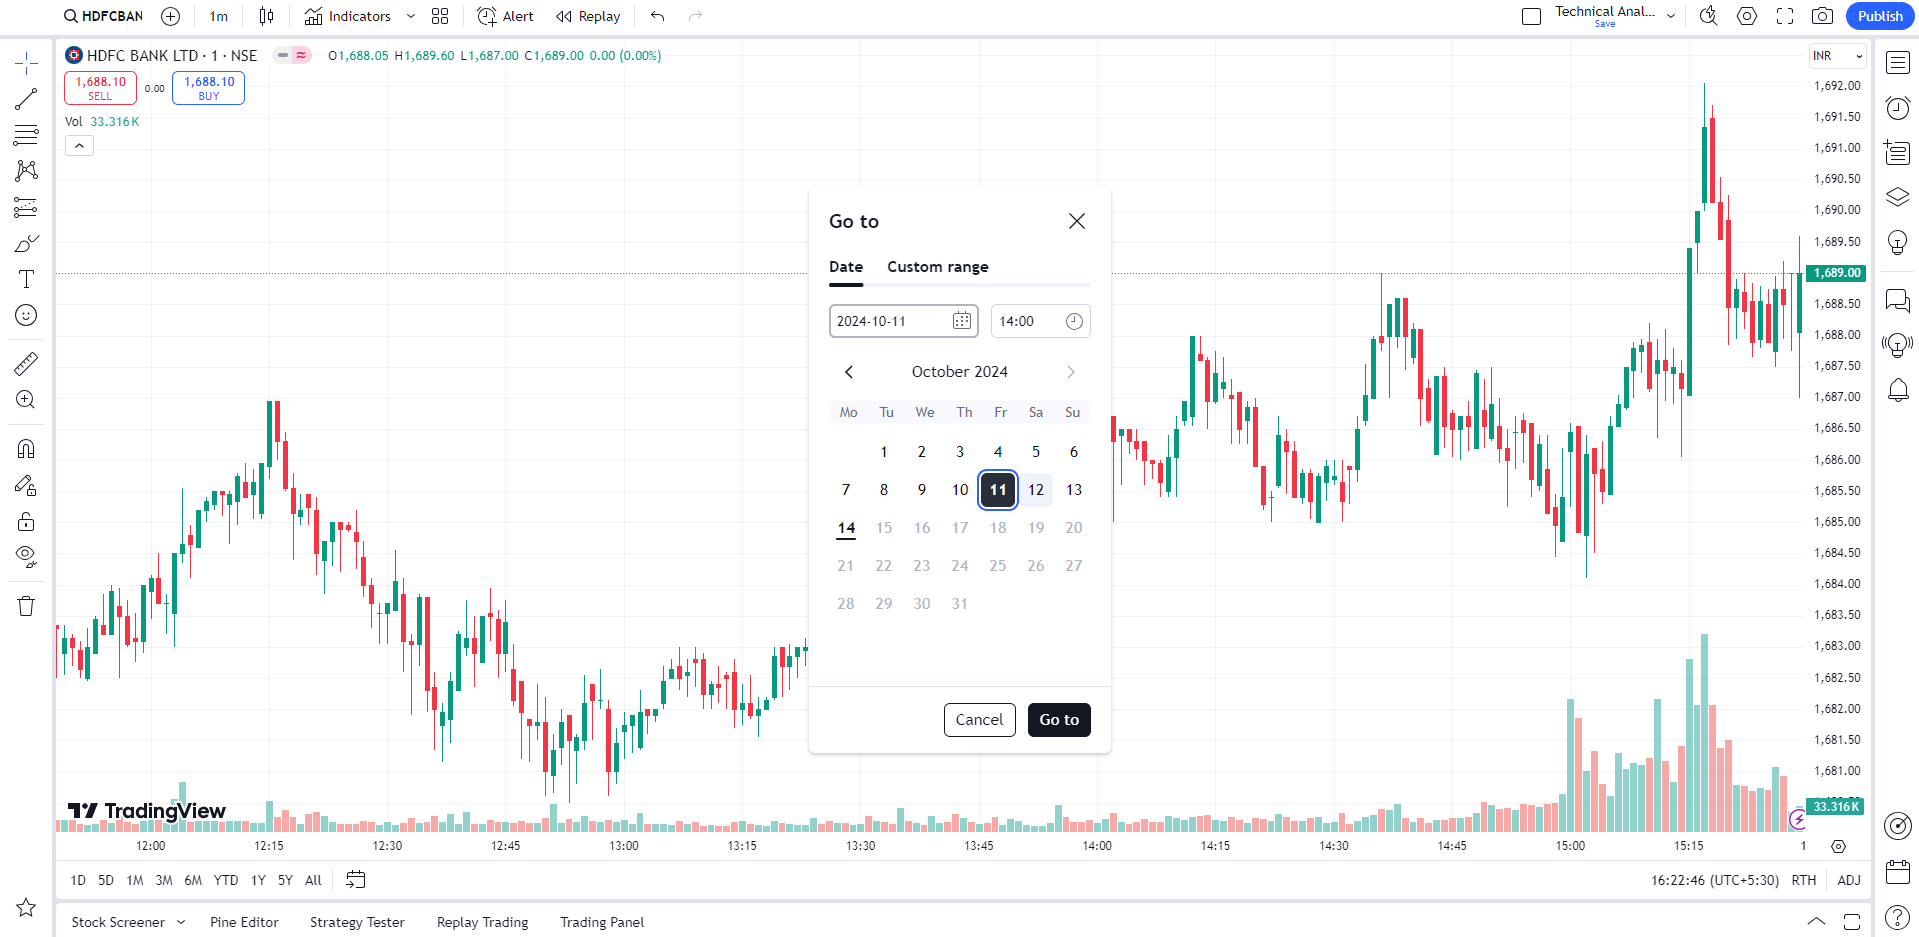
Navigate to Specific Dates and Timeframes
It has now become easy to explore a stock’s historical performance by jumping to specific dates and time frames in just a few clicks. If you’re looking to analyze how a stock behaved during a particular day or during a period, this will help you zoom in and out on the exact data you need. This is perfect for traders who rely on detailed historical data to spot trends, past market reactions or even fine tune or optimize their algo trading strategies. This will also help you stay focused on making informed decisions without getting lost in the data.
This integration will allow you to dive deep into advanced technical analysis with familiar tools and layouts, making it easier to track your investments. You’ll also have access to real-time stock news, keeping you updated on market-moving events, and an economic calendar so you never miss key data releases that could impact your trading strategy.
With everything in one place—from customizable charts to market insights—Findoc is set to become your go-to platform for algo trading. Get ready to take your investments to the next level—happy trading!
Leave a Reply