Nestle India Ltd recently released its Q3 FY25 financial results, and the numbers show a steady performance. Let’s dive into the details and see what’s driving the company’s growth!
Sales and Revenue of Nestle India
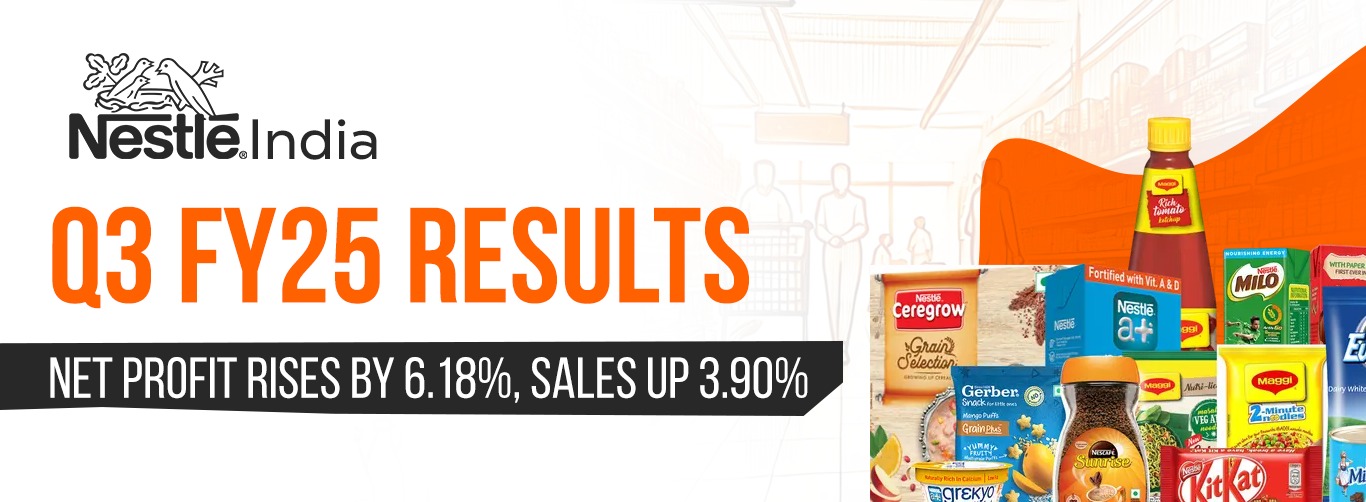
The sales of Nestle India Ltd climbed to Rs. 47,797.30 million this quarter, reflecting a 3.90% increase compared to Rs. 46,004.20 million in the same quarter last year. The company’s year-to-date sales reached Rs. 146,976.80 million, marking a 2.81% rise from Rs. 142,957.70 million. This growth highlights Nestle’s resilience in a competitive market.
Other Income of Nestle India
The other income dropped significantly this quarter. It fell by 85.35%, from Rs. 303.00 million to Rs. 44.40 million. This dip might signal a need for Nestle to explore additional revenue streams beyond its core business.
Profit Before Interest, Depreciation, and Tax (PBIDT) of Nestle India
PBIDT for Q3 stood at Rs. 10,893.70 million, a slight decline of 3.20% from Rs. 11,254.20 million last year. The company’s year-to-date PBIDT reached Rs. 34,174.10 million, showing a marginal decrease of 1.32%. While the numbers dipped slightly, Nestle continues to maintain a solid operational performance.
Interest and Financial Costs of Nestle India
Interest expenses surged by 50.76%, rising from Rs. 229.50 million to Rs. 346.00 million this quarter. The higher financial costs could be linked to increased borrowings or shifts in interest rates.
Profit Before Tax (PBT) of Nestle India
PBT saw a healthy growth of 4.04%, moving from Rs. 8,864.80 million to Rs. 9,222.60 million this quarter. The year-to-date PBT also improved by 6.18%, demonstrating the company’s efficient cost management and strategic planning.
Net Profit (PAT) of Nestle India
Net profit rose to Rs. 6,961.30 million, marking a 6.18% increase from Rs. 6,556.10 million in the previous year’s corresponding quarter. Nestle’s strategic initiatives seem to be translating into stronger bottom-line performance.
Q3 FY25 Financial Summary of Nestle India
| Parameter | Q3 FY25 | Q3 FY24 | % Change |
|---|---|---|---|
| Sales (Rs. in Million) | 47,797.30 | 46,004.20 | +3.90% |
| Net Profit (PAT) | 6,961.30 | 6,556.10 | +6.18% |
| PBIDT | 10,893.70 | 11,254.20 | -3.20% |
| Interest | 346.00 | 229.50 | +50.76% |
| PBT | 9,222.60 | 8,864.80 | +4.04% |
| PBIDT Margin (%) | 22.79% | 24.46% | -6.83% |
The Bottom Line
Nestle India Ltd’s Q3 FY25 results indicate steady growth in sales and net profit, despite challenges in other income and rising interest costs. The company’s focus on cost efficiency and market expansion continues to drive its performance.
Disclaimer: This blog is for informational purposes only and should not be considered as financial advice or any buy/sell recommendations.
Leave a Reply