findocblog

Blog

  • Exxaro Tiles Announces 10:1 Stock Split to Enhance Liquidity and Accessibility

    Exxaro Tiles Announces 10:1 Stock Split to Enhance Liquidity and Accessibility

    Exxaro Tiles Ltd, a prominent player in the refractory ceramic industry, has announced its first-ever stock split to enhance share liquidity and attract more small investors. This move, approved by the company’s Board of Directors on October 14, 2024, marks a strategic effort to make its shares more accessible and appealing in the market.

    Stock Split Details

    The company plans to subdivide its existing equity shares from a face value of ₹10 to ₹1 each. The split is subject to shareholder approval, with the record date set for Friday, December 13, 2024. Upon completion, the increased number of shares in circulation is expected to boost trading activity and improve liquidity.

    BofA Securities Europe SA recently acquired 6,66,366 shares of Exxaro Tiles at ₹96.22 per share, amounting to ₹6.41 crore. This purchase represents 1.48% of the company’s outstanding equity, signaling strong institutional interest in the company’s future.

    About Exxaro Tiles Ltd

    Founded in 2008, Exxaro Tiles Ltd is known for manufacturing and marketing a wide array of high-quality vitrified tiles. Its product portfolio includes double-charge vitrified tiles, glazed vitrified tiles, full-body vitrified tiles, wall tiles, and parking tiles. The company’s tiles are widely used in large-scale projects such as educational institutions, hotels, retail malls, and hospitals.

    The company prides itself on innovation, incorporating advanced features such as 3D effects, FGVT technology, high gloss finishes, and full-color body vitrified tiles. With a strong clientele, including industry giants like Lodha, Amul, and Shapoorji Pallonji, Exxaro Tiles has established itself as a trusted name in the industry.

    Financial Performance

    Despite its growth potential, Exxaro Tiles faces financial challenges:

    • In Q1FY25, the company reported total income of ₹60.04 crore but incurred a net loss of ₹4.27 crore.
    • As of March 2024, the company’s total debt stood at ₹97.45 crore, highlighting a need for financial improvement.

    However, with a market cap of over ₹400 crore and a strategic focus on enhancing shareholder value through the stock split, Exxaro Tiles is looking to turn things around.

  • Achyut Healthcare Announces Stock Split and Bonus Issue

    Achyut Healthcare Announces Stock Split and Bonus Issue

    Achyut Healthcare Ltd, a rising SME stock, has announced a stock split and bonus issue for shareholders. These corporate actions aim to improve liquidity and enhance shareholder value. The healthcare stock, which has delivered multibagger returns of over 300% in recent years, continues to attract investor attention. Below, we break down the details of the stock split, bonus issue, and the company’s recent financial performance.

    Stock Split and Bonus Issue Details

    Achyut Healthcare’s Board of Directors has approved two major proposals:

    1. Stock Split:
      • Each equity share with a face value of ₹10 will be subdivided into ten equity shares with a face value of ₹1.
      • The subdivision will increase the number of shares in circulation, enhancing liquidity.
    2. Bonus Issue:
      • The company will issue four bonus shares for every ten shares held (4:10 ratio) after the stock split.
      • Both the stock split and bonus issue have the same record date: Tuesday, December 10, 2024.

    These measures aim to make the stock more affordable and accessible to investors while increasing shareholder value.

    About Achyut Healthcare

    Founded in 1996, Achyut Healthcare Ltd is a pharmaceutical trading company specializing in APIs, pharmaceutical products, and medical devices. The company also manufactures pharmaceutical formulations, including tablets, capsules, oral liquids, and injectables. As of June 2024, Achyut Healthcare is debt-free, with a market capitalization of ₹128.29 crore.

    Financial Performance

    The company’s financials reflect strong growth and profitability:

    • Q2FY25 vs. Q2FY24:
      • Net sales increased by 44% to ₹2.13 crore.
      • Net profit rose by 35% to ₹1.48 crore.
    • Annual Results (FY24):
      • Net sales reached ₹6.14 crore.
      • Net profit stood at ₹0.66 crore, highlighting consistent annual growth.
  • Global Education Ltd Announces Stock Split

    Global Education Ltd Announces Stock Split

    Global Education Ltd (GEL), a prominent educational service provider, has announced a stock split, dividing its equity shares from a face value of ₹5 to ₹2 each. The split aims to increase share liquidity and make the stock more accessible. Below, we outline the stock split details, provide an overview of Global Education Ltd, and examine its financial performance.

    Stock Split Details

    The stock split will create two new shares for every existing share. Although the authorized share capital remains at ₹12 crore, it will now comprise:

    • 5,97,50,000 equity shares of ₹2 each
    • 5,00,000 redeemable preference shares of ₹1 each

    The record date for the stock split is Tuesday, December 10, 2024. Shareholders on this date will be eligible for the split.

    About Global Education Ltd

    Established in 2011, GEL offers a comprehensive range of services to educational institutions, corporations, and banks. These include:

    • Business consulting and skill development programs
    • Admission assistance and online examinations
    • Infrastructural support, marketing, and branding

    GEL also provides computer hardware and educational materials to institutions. Its clientele includes major firms like Capgemini, HCL, and Wipro, reinforcing its reputation as a trusted partner in the education sector.

    Financial Performance

    GEL’s financial results reflect strong growth:

    • Q2FY25 vs. Q1FY25:
      • Total income increased by 68.6% to ₹25.66 crore.
      • Net profit rose by 50.9% to ₹10.65 crore.
    • H1FY25 vs. H1FY24:
      • Total income grew by 6.5% to ₹40.88 crore.
      • Net profit declined by 8.8% to ₹17.75 crore.

    GEL is debt-free with a 35.5% CAGR in profit growth over the last five years. The company maintains a healthy dividend payout of 28%, reflecting strong shareholder returns.

    Strengths and Market Position

    GEL has a market capitalization of ₹401.06 crore and has show operational efficiency in core business: 

    • Return on Equity (ROE): 40%
    • Return on Capital Employed (ROCE): 55%
    • Stock Performance: The stock has delivered 1,430% returns over the past five years, cementing its status as a multibagger.
  • NTPC Green Energy IPO Details, Open Date, Price, Lot Size & More

    NTPC Green Energy IPO Details, Open Date, Price, Lot Size & More

    NTPC Green Energy plans to raise ₹10,000 crore through a fresh issue of 92.59 crore shares.

    The IPO will open on Tuesday, November 19, and close on Friday, November 22. The company will finalize allotments on November 25, and it will credit the shares on November 26. NTPC Green Energy will get listed on Wednesday, November 27, 2024.

    The price band for the IPO ranges between ₹102 and ₹108 per share, with a minimum lot size of 138 shares.

    NTPC Green Energy Limited IPO Details

    IPO Date November 19, 2024 to November 22, 2024
    Listing Date November 27, 2024
    Face Value ₹10 per share
    Price Band ₹102 to ₹108 per share
    Lot Size 138 Shares
    Total Issue Size 925,925,926 shares
    Fresh Issue 925,925,926 shares
    Employee Discount Rs 5 per share
    Issue Type Book Built Issue IPO
    Listing At NSE, BSE
    Share holding pre issue 7,500,000,000
    Share holding post issue 8,425,925,926

    NTPC Green Energy IPO Timeline

    IPO Open Date Tuesday, November 19, 2024
    IPO Close Date Friday, November 22, 2024
    Basis of Allotment Monday, November 25, 2024
    Initiation of Refunds Tuesday, November 26, 2024
    Credit of Shares to Demat Tuesday, November 26, 2024
    Listing Date November 27, 2024
    Cut-off time for UPI mandate confirmation 5 PM on November 22, 2024

    NTPC Green Energy IPO Reservation

    Investor Category Shares Offered
    QIB Shares Offered Not less than 75% of the Net Issue
    Retail Shares Offered Not more than 10.00% of Net Issue
    NII (HNI) Shares Offered Not more than 15.00% of the Net Issue

    NTPC Green Energy IPO Lot Size

    Application Lots Shares Amount
    Retail (Min) 1 138 ₹14,904
    Retail (Max) 13 1794 ₹193,752
    S-HNI (Min) 14 1,932 ₹208,656
    S-HNI (Max) 67 9,246 ₹998,568
    B-HNI (Min) 68 9,384 ₹1,013,472

    About NTPC Green Energy Limited

    NTPC Green Energy Ltd, a subsidiary of NTPC Ltd (a Maharatna Central Public Sector Enterprise), plays a prominent role in India’s renewable energy sector, focusing on solar and wind energy. The company is launching its initial public offering (IPO). This overview provides details about the IPO, the company’s profile, its core strengths, and the potential risks involved.

    As part of NTPC’s renewable energy division, NTPC Green Energy works to advance India’s sustainable energy goals. The company specializes in solar and wind power projects and actively participates in long-term Power Purchase Agreements (PPAs) to supply power primarily to other public sector undertakings (PSUs) and private corporations.

    As of June 30, 2024, the company manages a portfolio of 14,696 MW in renewable projects, including 3,071 MW of operational solar capacity and 100 MW of wind capacity. The remaining 11,771 MW includes awarded or contracted projects that are not yet operational, highlighting significant growth potential.

    NTPC Green Energy Limited Financial Information

    Period Ended 30 Sep 2024 31 Mar 2024 31 Mar 2023
    Assets 32,408.30 27,206.42 18,431.40
    Revenue 1,132.74 2,037.66 170.63
    Profit After Tax 175.30 344.72 171.23
    Net Worth 8,189.18 6,232.14
    Reserves and Surplus 596.08 512.60 167.88
    Total Borrowing 17,057.50 12,796.74

    Key Performance Indicator

    KPI Values
    ROE 7.39%
    Debt/Equity 1.91
    RoNW 2.14%
    P/BV 9.89
    PAT Margin (%) 16.2

    NTPC Green Energy IPO Peer Comparison

    Company Name EPS (Basic) EPS (Diluted) NAV (per share) (Rs) P/E (x) RoNW (%) P/BV Ratio Financial Statements
    NTPC Green Energy Limited 0.73 0.73 10.90 5.53 9.91 Consolidated
    Adani Green Energy Ltd 6.21 6.20 62.08 259.83 12.81 28.82 Consolidated
    Renew Energy Global PLC 9.94 9.92 290.15 47.05 3.94 1.61 Consolidated

    Strengths of the Company

    1. NTPC Green Energy ranks among the top 10 renewable energy companies in India in terms of operational capacity as of mid-2024, providing a solid foundation and experience in project execution.

    2. Support from NTPC, a well-established player in India’s energy sector, offers NTPC Green Energy an advantage in executing large-scale projects. 

    3. With a portfolio of 14,696 MW in solar and wind projects across six states, the company minimizes geographical risk and expands its reach. 

    4. The company’s strong credit rating and growth in revenues allow it access to capital at lower costs, which enhances its financial flexibility. 

    5. NTPC Green Energy’s operating model includes robust revenue generation and a high EBITDA margin, underscoring its efficient project management and resource allocation.

    Risks Related to the Company

    1. Like many in the renewable energy sector, NTPC Green Energy faces potential cost overruns or delays in project completion, which could impact business results, financial health and cash flow stability.

    2. A significant portion of the company’s renewable energy operations is concentrated in Rajasthan. Any adverse economic, political, or natural disruptions in this region could negatively affect the business.

    3. NTPC Green Energy’s reliance on utility off-takers for revenue makes it vulnerable to delays or non-payment issues. 

    4. Renewable energy projects are capital-intensive and NTPC Green Energy may require additional financing to meet its expansion goals. 

    5. The company depends heavily on a limited pool of off-takers, with over 87% of revenue derived from the top five clients in FY 2024. 

    Investor Outlook

    NTPC Green Energy’s IPO presents a promising opportunity to invest in India’s renewable energy sector, backed by NTPC’s strong reputation and resource base. With an extensive portfolio, operational efficiency and solid financial performance, the company is well-positioned for future growth.

    However, potential investors should be mindful of the associated risks, including project completion timelines, geographic concentration and receivables management. Careful evaluation of these factors is essential for making an informed decision before applying for the IPO.

    Frequently Asked Questions

    The NTPC Green Energy IPO is a main-board IPO offering 925,925,926 equity shares. Each share has a face value of ₹10, with the total issue size amounting to ₹10,000 Crores. The minimum order quantity is 138 Shares.

    The IPO will open on November 19, 2024, and close on November 22, 2024.

    The registrar of NTPC Green Energy IPO is Kfin Technologies Limited.

    Contact Information

    Kfin Technologies Limited

    Phone: 04067162222, 04079611000

    E-mail: ntpcgreen.ipo @ kfintech.com

    Website: https://kosmic.kfintech.com/ipostatus/

    The IPO will open for subscription by November 19, 2024 and will close by November 22, 2024.

    Once the IPO will be live, you will be able to apply directly at Findoc website.

    The listing date is not yet announced. The tentative date of NTPC Green Energy IPO listing is Wednesday, November 27, 2024.

  • Options Explained: Meaning, Types, Features, and How They Work?

    Options Explained: Meaning, Types, Features, and How They Work?

    Option trading is a flexible financial instrument that allows investors to buy or sell assets at a predetermined price on or before a specific date. In India, options have become popular in the derivatives market, providing ways for traders to hedge risk, speculate, or leverage investments. Let’s explore what options are, along with their features, types, and how they work.

    What are Options?

    Options are financial contracts that give buyers the right, but not the obligation, to buy or sell an underlying asset (like stocks) at a fixed price within a certain timeframe. There are two types of options; Call Options and Put Options. 

    Call Options let you buy an asset at a set price while Put Options let you sell an asset at a set price.

    Options can be based on various assets, such as stocks, indices, or commodities. For instance, traders in India often use options on popular stocks like Tata Steel for hedging or speculative purposes.

    Understanding Options With Example


    Let’s take a look at a real-time example of an Options contract on Tata Steel Company to understand it better:

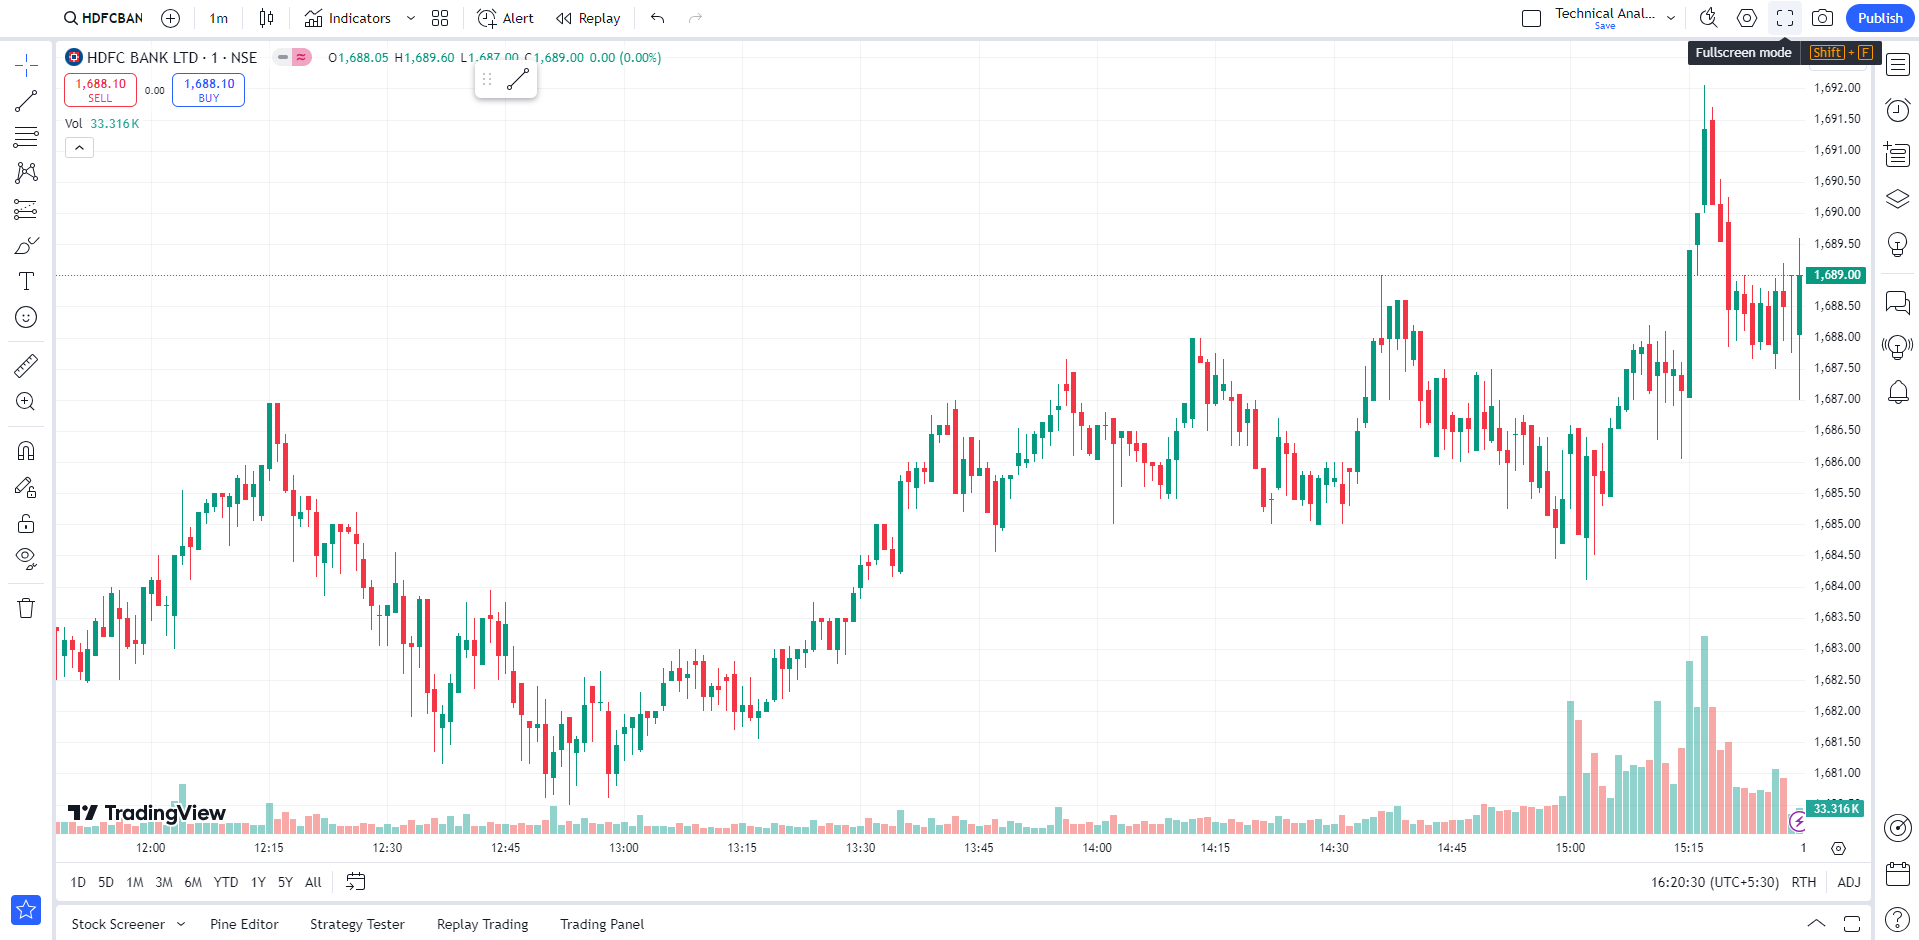
    On October 31, 2024, the TATASTEEL 28-Nov-24 155 CE gained 4.5% in one day, closing at ₹8. Sounds interesting, right? But what does this actually mean?

    Let’s understand this option contract step by step:

    • The term “TATASTEEL 28-Nov-24 155 CE” represents an Options contract on the Tata Steel Ltd. stock as the underlying asset.
    • The date 28-Nov-24 shows the option expires on November 28, 2024. You can exercise it only on this date.
    • CE stands for a Call Option of the European type. This call option gives you the right to buy Tata Steel shares at the strike price on the expiration date.
    • The number 155 is the strike price, which means that you have the option to buy Tata Steel shares at ₹155 on November 28, 2024, no matter what the market price is on that date.

    To buy this option, you pay a premium. Let’s say on November 4, 2024, this premium is ₹10 per contract. This cost is much lower than buying the stock outright, allowing you to gain potential upside with limited upfront investment.

    In this case, if Tata Steel’s stock price rises above ₹155 by November 28, 2024, your option becomes valuable because you can buy it at ₹155, even if the market price is higher. This setup allows you to profit from price increases with a controlled cost

    Types of Options

    Option trading offers flexibility for both buyers and sellers, allowing them to profit from stock market movements without directly buying or selling the underlying asset. There are two primary types of options: Call Options and Put Options. Each serves a distinct purpose depending on the market outlook. Let’s explore these two main types of options in more detail.

    1. Call Option

    A Call Option gives you the right to buy a stock at a specific price, known as the strike price, within a set time period. It’s useful if you believe the stock’s price will rise.

    For example, Reliance Industries stock is trading at ₹2,500 per share. You believe it will rise, so you buy a Call Option with a ₹2,600 strike price that expires in one month. This option gives you the right to buy Reliance shares at ₹2,600, regardless of the market price.

    If Reliance’s price increases to ₹2,700, you can exercise the option, buy the shares at ₹2,600, and then sell them at the market price of ₹2,700, thereby booking a profit. However, if the price doesn’t reach ₹2,600, you don’t have to exercise the option, and your only loss is the premium you paid for the option.

    2. Put Option

    A Put Option gives you the right to sell a stock at a specific price, known as the strike price, within a set time period. This is helpful if you believe the stock’s price will decline.

    For example, Infosys stock is trading at ₹1,400 per share. You expect it to drop, so you buy a Put Option with a ₹1,350 strike price, expiring in one month. This option lets you sell Infosys shares at ₹1,350, regardless of the market price.

    If Infosys’s price falls to ₹1,300, you can exercise the option, sell the shares at ₹1,350, and book a profit. However, if the price stays above ₹1,350, you don’t have to exercise the option, and your only cost is the premium you paid for the option.

    Options are also classified based on when they can be exercised:

    • American Options: Can be exercised anytime before expiration.
    • European Options: Can only be exercised at expiration.

    In India, index options are European-style, while stock options are American-style, offering different strategic advantages to traders.

    Features of an Options Contract

    Options contracts have unique features that make them flexible trading instruments:

    • Strike Price: The price at which the underlying asset can be bought or sold.
    • Premium: The cost of buying an option contract. This premium fluctuates based on the underlying asset’s price, time to expiration, and market volatility.
    • Expiration Date: The date the option expires, beyond which it becomes invalid.
    • Lot Size: The number of units in each option contract, standardized on stock exchanges.

    American Options vs. European Options

    American options and European options are two common types of options contracts that primarily differ in when the option holder can exercise their rights.

    American Options allow the holder to exercise the option at any time before the expiration date. This flexibility can be advantageous when market conditions change rapidly, allowing for potential profits to be realized sooner.

    European Options, on the other hand, can only be exercised on the expiration date itself. This more restrictive approach can be beneficial in specific market scenarios, such as when there’s a high probability of the underlying asset’s price moving in the desired direction near the expiration date

    How Do Options Work?

    Options allow traders to speculate on asset price movements with limited risk. When you buy a Call Option, you’re betting that the asset’s price will rise above the strike price before expiration. If it does, you can buy the asset at the lower strike price and sell it at the higher market price, booking a profit. Conversely, if you buy a Put Option, you profit if the asset’s price falls below the strike price.

    Traders often use various option trading strategies to maximize their potential gains or minimize losses. For instance, combining Call and Put options can create protective strategies that align with market conditions.

    Options offer leverage, meaning you only pay a premium instead of the full price of the asset. However, they also expire, so timing is crucial.

    How To Use Options in Trading?

    Traders use options for several purposes:

    • Hedging: Investors use options as a hedging strategy to protect their holdings from market volatility.
    • Speculation: Traders can profit from price changes without owning the underlying asset.
    • Income Generation: Some investors sell options to earn premiums, a strategy known as covered call writing.

    For instance, if you hold RIL shares but are concerned about short-term volatility, buying a Put Option can offset potential losses if the stock price drops.

    Understanding Options Pricing

    Options pricing depends on multiple factors, mainly:

    • Intrinsic Value: The difference between the asset’s current price and the strike price.
    • Time Value: The additional value due to the time left until expiration.
    • Volatility: Higher volatility means higher premiums, as the potential for profit (and risk) increases.

    For example, a Call Option on RIL with a strike price close to the market price and high volatility will have a higher premium.

    Advantages of Option Trading

    1. Limited Loss: Buyers’ losses are limited to the premium paid, even if the market moves against them.
    2. Leverage: Options allow control over a large amount of assets with a smaller initial investment.
    3. Flexibility: Traders can profit from different market conditions, whether they expect prices to rise, fall, or remain stable.

    Disadvantages of Options

    1. Time Decay: Options lose value as expiration approaches, potentially leading to a loss if the asset doesn’t move as expected.
    2. Complexity: Options involve multiple factors in pricing, making them more complex than direct stock investments.
    3. Risk for Sellers: While buyers’ losses are capped, sellers can face unlimited losses if the market moves significantly against their position.

    Conclusion

    Option trading offers investors a unique way to manage risk and capitalize on market movements. By understanding the types of options, their features, expiration dates, and premiums, traders can make informed decisions. While options offer the potential for significant profits, they also come with risks, including the loss of the premium paid. Therefore, it is essential to approach option trading with a clear strategy and a thorough understanding of the underlying asset. With careful planning and market analysis, options can be a valuable tool in an investor’s trading toolkit.

    FAQs

    Options provide a way to hedge risk, speculate on price changes, and leverage capital without directly buying or selling the asset.

    No, options are only available on selected stocks like Nifty 50 and indices in the Indian market, as approved by the stock exchanges.

    The premium is the price paid to buy an option contract, determined by factors like strike price, time to expiration, and market volatility.

    Yes, if the underlying asset’s price does not reach a profitable level, the option will expire worthless, and the buyer loses only premium.

    Options require a solid understanding of stock market movements, so it’s best for beginners to learn thoroughly or consult with stock brokerage firms like Findoc before trading in options.

  • Swiggy IPO Analysis: Know Key Details Before You Apply

    Swiggy IPO Analysis: Know Key Details Before You Apply

    Swiggy, one of India’s largest consumer-focused platforms, is set to launch its Initial Public Offering (IPO). Before applying, review these details to understand what this offering involves. This article gives an overview of Swiggy’s IPO, highlights of the company, its main strengths, and potential risks.

    Swiggy IPO Details

    Bidding Dates

    6 Nov 2024 – 8 Nov 2024

    Minimum Investment

    Price Range

    ₹371 – ₹390

    Maximum Investment

    Retail Discount

    To be announced

    Issue Size

    ₹11,327 Crores

    Investor Category and Subcategory

    Qualified Institutional Buyers (QIBs) |  Retail Individual Investors |  Non-institutional Investors (NIIs)

    Swiggy IPO Dates

    IPO Opening Date 6 Nov 2024
    IPO Closing Date 8 Nov 2024
    IPO Allotment Date 11 Nov 2024
    Initiation of Refunds 12 Nov 2024
    Listing Date 13 Nov 2024

    Swiggy’s IPO issue size is around ₹12,750 crore. This includes a fresh issue of ₹4,500 crore and an Offer for Sale (OFS) of ₹8,250 crore. The expected price per share is ₹395, targeting a market cap of ₹95,000 crore upon listing. The IPO will tentatively open on November 6, close on November 8, and list on November 13.

    About Swiggy

    Founded in 2014, Swiggy has grown into one of India’s largest online food delivery platforms. The app allows users to browse, order, and pay for food easily. Beyond food delivery, Swiggy offers services like:

    • Instamart: Quick-commerce delivery for groceries and household items.
    • Dineout: Restaurant reservation platform.
    • SteppinOut: Booking for events and experiences.
    • Swiggy Genie: Hyperlocal pick-up and drop-off service.
    • Swiggy Minis: Smaller hyperlocal commerce activities.

    As of June 30, 2024, Swiggy served 112.73 million users and employed over 5,400 people. It operates with a strong delivery partner network across multiple cities and has 605 dark stores supporting Instamart as of September 2024.

    Things to Know Before Applying for Swiggy IPO

    Peer Details:

    Company EPS PE Ratio RoNW % NAV Market Cap
    Zomato Limited 0.41 742.50 1.72 23.14 ₹2,24,399 Cr

    Strengths of the Company

    1. Versatile Platform

    Swiggy’s platform covers services beyond food delivery. It offers grocery delivery, event bookings, and restaurant reservations, attracting more revenue streams and a wider audience.

    2. Growing User Base

    Swiggy reached over 112.73 million transacting users by mid-2024. This large base allows Swiggy to use data for targeted marketing.

    3. In-App Payment Options

    Swiggy offers payment choices like Swiggy Money, Swiggy UPI, and a co-branded credit card with HDFC Bank. These options give customers added discounts and benefits.

    4. Revenue Growth

    Swiggy’s revenue rose from ₹5,704.90 crore in FY22 to ₹8,264.60 crore in FY23, and ₹11,247.39 crore in FY24, showing steady demand growth.

    5. Technology-Driven Operations

    Swiggy uses analytics to personalize recommendations and improve delivery routes, reducing last-mile delivery times and enhancing the user experience.

    Risks Related to the Company

    1. Ongoing Losses

    Swiggy has posted annual losses since its inception. In FY24, it reported a loss of ₹2,350.24 crore, improving from ₹4,179.30 crore in FY23. Swiggy’s path to profitability remains unclear, which could affect investor interest.

    2. Reliance on Delivery Partners

    Swiggy relies on delivery partners but lacks exclusive contracts with them. Partner shortages or retention issues could disrupt its operations.

    3. Challenges in Retaining Partners

    Swiggy’s success depends on restaurant, merchant, and brand partners. High turnover or rising costs to retain these partners may impact financial performance.

    4. Challenges in Quick Commerce

    Swiggy’s quick commerce service Instamart depends on factors like dark store location and density. Inefficient operations may lead to higher costs and reduced profitability.

    5. Legal and Regulatory Risks

    Swiggy, along with its subsidiaries and some directors, faces ongoing legal cases. Negative rulings could impact the company’s financial position and reputation.

    6. Debt Obligations

    Swiggy’s debt stood at ₹255.58 crore as of July 31, 2024. Inability to service this debt could affect financial stability.

    Financial Information of the Company

    Period Ended Year ending on March 31, 2024 Year ending on March 31, 2023 Year ending on March 31, 2022
    Assets 10,529.42 11,280.65 14,405.74
    Revenue from Operations (in ₹ million) 11,634.35 8,714.45 6,119.78
    Profit After Tax (PAT) (in ₹ million) -2,350.24 -4,179.31 -3,628.9
    Net Worth (in ₹ million) 7,791.46 9,056.61 12,266.91
    Reserves and Surplus -7,880.85 -6,510.34 -3,311.1
    Total Borrowings (in ₹ million) 211.19

    Source: Swiggy Limited RHP | Company Profile: Swiggy Limited

    Conclusion

    Swiggy’s IPO offers an opportunity to invest in high-growth sectors like online food delivery and quick commerce. The company’s strengths include a diverse platform, strong revenue growth, and tech-driven operations. However, investors should weigh risks like profitability, reliance on delivery partners, and challenges in a competitive market.

    Before applying for any IPO, it is essential to evaluate these risks and follow the latest developments.

    FAQs

    Swiggy IPO is a main-board IPO. The company is set to raise ₹11,327.43 Cr via Initial Public Offering. The Swiggy IPO issue price is ₹371 to ₹390 per equity share. The IPO is to be listed on NSE and BSE India.

    The registrar of Swiggy IPO is Link Intime India Private Limited.

    Contact Information

    Link Intime India Private Limited

    C-101, 1st Floor, 247 Park
    L.B.S. Marg, Vikhroli West
    Mumbai 400 083
    Maharashtra, India

    Phone: +91 810 811 4949

    E-mail: swiggy.ipo@linkintime.co.in

    Website: www.linkintime.co.in

    The IPO will open for subscription by 6 November 2024 and will close by 8 November 2024.

    The investors’ portion of Swiggy IPO is 50% for QIB, 15% for NII, and 35% for Retail Investors.

    Once the IPO will be live, you will be able to apply directly at Findoc website.

    The IPO allotment date is 11 November 2024.

    The IPO listing date is 13 November 2024. It will be listed on both stock exchanges NSE and BSE.

  • Maximize the Benefits of Your Demat Account for Long-Term Wealth Creation

    Maximize the Benefits of Your Demat Account for Long-Term Wealth Creation

    A demat account is not just another digital shares locker. It’s your hallway to long-term wealth accumulation. Demat account growth momentum in India has been accelerating, with 6.28 crore demat accounts added since January 2023. Looking back to 2023, 4.2 million demat accounts were opened in December alone.

    This exponential rise in the opening of new demat accounts shows how Indian investors are embracing securities investment and are looking to tap into the benefits that a demat account presents. This is also your chance to embrace the same journey and diversify your investments and income streams.

    In this article, we’ll discuss 8 benefits of a demat account for long-term wealth creation and how to open one. Let’s dive in!

    8 Top Benefits That Your Demat Account Offers

    To exploit the full potential of your demat account, you should look beyond holding securities. Your demat account offers various benefits to accelerate your financial growth and maximize your long-term wealth creation. From frequent investments to future perspectives on risks and diversification, every benefit uniquely optimizes your overall investment. Let’s explore the 8 key benefits in detail.

    1. Periodic Investments

    With a demat account, you can periodically and systematically commit your funds to diverse investment vehicles like bonds, stocks, or mutual funds. As a result, you enjoy the benefits of compounding, meaning you earn income from your original investment and accrued returns. If you remain consistent, you’ll accumulate significant lifetime wealth.

    In addition, you leverage the rupee cost averaging to lower the negative effect of market volatility. This is when you buy additional security units when the prices are falling and less as the prices rise. Say you set aside a specific amount every month to invest in securities. You’ll automatically purchase more stocks when the market dips, which decreases your average share cost. This helps maximize your investment return as the market becomes favorable.

    2. Risk Control

    It’s important to have a well-balanced and resilient investment portfolio. Armed with your demat account, you’re exposed to various security classes, which helps you buffer your portfolio against rising market volatility and security prices. For example, government securities and bonds are safer, lower-risk options to include in your portfolio.

    Moreover, you can frequently calibrate your risk level to correspond with your investment approach and future financial objectives. If, for example, you realize the market is increasingly becoming volatile, you can swap your equity investments with bonds to contain your portfolio’s risk exposure.

    3. Long-Term Outlook

    A demat account offers long-term investments, allowing your investments to gain and compound over a longer period. As a long-term investor, you benefit from reduced tax on all your capital gains and escape short-run market variations.

    Unlike short-term trading, which is prone to market fluctuation impact, quality future-looking securities tend to appreciate with time, rewarding your investment patience. For instance, when you hold on to a quality stock for 15 years, you recoup significant returns, surpassing short-term trading approaches susceptible to inflated fees and a turbulent market.

    4. Due Diligence and Research

    With a demat account, you’re able to access relevant financial reports, securities performance data, and analyst recommendations. This allows you to conduct due diligence and exhaustively understand every reward and risk associated with the stock you plan to invest in.

    As a result, you avoid making poor investment decisions based purely on subjective judgment. Let’s say you plan on investing in stocks in the health industry. The performance data allows you to examine the industry’s stock growth prospects, and you avoid companies with poor stock performance.

    5. Specialized Financial Advice

    Brokers linked to your demat account, like Findoc, offer professional investment advice. They help you optimally balance your portfolio with the right security choices and advise when to adjust accordingly. They can also tailor tax-saving schemes that augment your wealth accumulation journey. For example, your broker may recommend certain equities customized to optimize your investment profile. This way, you remain focused on meeting your future financial goals.

    6. Investment Performance Tracking

    A demat account enables you to have a real-time view of your investment performance, including the number of dividends received and the cumulative stock value. With this data, you can learn about and plan the stock to reallocate on a need basis, allowing you to align your financial objectives with the prevailing market conditions. For example, if you overly invest in one security class, such as equities, and after some time, want to rebalance it and spread your risk, you can dispose of some securities and purchase bonds.

    7. Systematic Investment Plans (SIPs)

    With SIPs, you can automate your mutual fund investments effectively via your demat account. It allows you to cultivate an investment discipline by regularly committing to a fixed investment amount at specific time intervals. So you don’t have to worry about when to time the market. In addition, you steer clear of making a lumpsum ill-timed investment by averaging out the market.

    8. Tax Efficiency

    A demat account allows you to capitalize on investment options with tax-saving benefits, such as the Equity Linked Saving Scheme (ELSS). Additionally, when you hold your investment portfolio over an extended time, you may benefit from reduced tax on your capital gains. This is because long-term capital gains are subjected to a lower tax rate compared to short-term returns. For example, when you invest in a mutual fund, you benefit from market-linked stock growth and tax savings.

    Conclusion

    Maximizing your demat account helps build long-term wealth through regular investing, compounding, and risk diversification. It also offers easy portfolio tracking, tax optimization, and access to SIPs for better returns. Align your investments with market trends and boost your wealth potential. Ready to get started? Open a hassle-free demat account with Findoc today!

  • TradingView Charts Integration with Findoc

    TradingView Charts Integration with Findoc

    We are excited to share that Findoc is all set to integrate TradingView charts on all our platforms (Web and Mobile App). Now, you can easily analyze charts using TradingViews’s robust charting features and functions.

    Here are some of the key features that will be unlocked as a result of this integration between Findoc and TradingView:

    Multiple Full-screen Charts View with Pop-Out Feature

    Now, you can open multiple charts for different stocks and also keep track of each one of them individually. With the help of a stock screener, you can easily filter and analyze stocks based on various criteria, ensuring you focus on the most relevant opportunities. You can also set your own timeframes in each chart, allowing you to concentrate on both short-term movements and long-term trends simultaneously.

    It is quite easy to switch between these different charts or view them all at once. Thus, making sure to manage multiple stocks at the same time. This setup helps you stay on top of the market whether you’re day trading on simply monitoring instruments.

    pop out fullscreen mode in stock chart

    Advanced Indicators and Drawing Tools

    With the new advanced indicators and drawing tools on TradingView, you can level up your technical analysis game. This new feature will help you track trends, identify support and resistance levels and also analyze chart patterns. Be it moving averages, oscillators, trendlines or Fibonacci retracements, this new feature gives you all the power to make informed decisions. This is perfect for advanced traders looking for more precision and depth in their analysis to spot opportunities and manage risks better.

    multiple advanced indicators

    Effortless Stock Search and Addition

    Adding new stocks with just a few keystrokes is now a reality. It has become a lot easier to find stocks and add them to your watchlist and your full screen chart. No need to navigate through different menus. This feature helps you to switch between different stocks, allowing you to focus on analysis and not on managing your setup. This feature will help you stay agile and efficient during the fast moving markets.

    Customizable Chart Colors and Lines

    Now, it is easy to customize your charts by choosing from a wide range of colors and lines to suit your preferences. Be it highlighting trends, making certain data stand out or simply creating a cleaner view. These customization options also allow you to design charts to enhance readability and customize your workflow to fit your needs. You can even adjust the thickness of lines or apply different color schemes to indicators, interpret data more clearly and efficiently. This feature helps traders to clearly see the charts and tailor it specifically to their needs.

    Diverse Chart Types

    Be it candlesticks, bar charts, line graphs or even Heiken-Ashi, it is now easy to choose a chart type from all these varieties of chart types. Each chart type offers a different view on price action and allows you to gain deeper insights into market trends and patterns. Now, you can easily switch between them and choose the one that fits your trading strategy or current market conditions. This flexible approach allows us to best visualize the data that is meaningful and personalized for you.

    stock-chart-type

    Navigate to Specific Dates and Timeframes

    It has now become easy to explore a stock’s historical performance by jumping to specific dates and time frames in just a few clicks. If you’re looking to analyze how a stock behaved during a particular day or during a period, this will help you zoom in and out on the exact data you need. This is perfect for traders who rely on detailed historical data to spot trends, past market reactions or even fine tune or optimize their algo trading strategies. This will also help you stay focused on making informed decisions without getting lost in the data.

    timeframe

    This integration will allow you to dive deep into advanced technical analysis with familiar tools and layouts, making it easier to track your investments. You’ll also have access to real-time stock news, keeping you updated on market-moving events, and an economic calendar so you never miss key data releases that could impact your trading strategy.

    With everything in one place—from customizable charts to market insights—Findoc is set to become your go-to platform for algo trading. Get ready to take your investments to the next level—happy trading!

  • Analyzing Hyundai’s Upcoming IPO Before You Invest

    Analyzing Hyundai’s Upcoming IPO Before You Invest

    Hyundai Motor India Limited has become a key player in the Indian automobile sector and is coming up with a highly anticipated initial public offering (IPO). However, before you invest, it is essential to understand the key details about this large-cap automotive company: Hyundai Motor India Limited. In this blog, we provide an overview of Hyundai’s upcoming IPO, explore insights into the company, highlight its core strengths, and examine potential risks.

    Hyundai IPO Details

    Bidding Dates

    15 Oct ’24 – 17 Oct ’24

    Minimum Investment

    ₹ 13,720 / 1 Lot (7 Shares)

    Price Range

    ₹ 1,865 – ₹ 1,960

    Maximum Investment

    ₹1,92,080 / 14 Lot (98 Shares)

    Retail Discount

    To be announced

    Issue Size

    ₹ 27,870.16 Cr

    Investor Category and Subcategory

    Qualified Institutional Buyers (QIBs) |  Retail Individual Investors |  Non-institutional Investors (NIIs) |  Eligible Employees and Eligible Shareholders

    Hyundai IPO Dates

    IPO Opening Date Oct 15, 2024
    IPO Closing Date Oct 17, 2024
    IPO Allotment Date Oct 18, 2024
    Initiation of Refunds Oct 21, 2024
    Listing Date Oct 22, 2024

    Hyundai Motor India Limited is planning to offer 14,21,94,700 equity shares, making the IPO issue size approximately ₹27,870.16 crore, positioning it as one of India’s biggest mainboard IPOs.

    The issue is entirely an Offer for Sale (OFS). The Hyundai IPO will open for subscription on Tuesday, 15th October, and will close on 17th October. The price band is set at ₹1865 to ₹1960 per share, with a minimum lot size of 7 shares. After the IPO, the offered shares will represent 17.50% of company’s total equity share capital.

    About Hyundai Motor India Ltd

    Founded in 1996, Hyundai is a part of the global group based in Korea and is one of the leading automobile industry groups.

    Their production includes a variety of passenger vehicles, ranging mostly from sedans to hatchbacks, SUVs, and electric vehicles. By offering such cars, Hyundai has emerged as one of India’s two largest automakers, by domestic sales as well as being the largest exporter, supplying cars to more than 150 countries around the world.

    The company has a manufacturing plant near Chennai, capable of producing Hyundai’s whole range of passenger vehicles. Additionally, they have an R&D center in Hyderabad that caters to global R&D needs from Korea.

    Peer Details:

    Company Market Cap
    Maruti Suzuki India Limited ₹4,01,088 Cr
    Tata Motors Limited ₹3,45,690 Cr
    Mahindra & Mahindra Limited ₹3,92,240 Cr

    Things to Know Before Investing in Hyundai IPO

    Strength of the company

    • Wide product range: Hyundai offers a diverse range of models and electric vehicles. This lineup allows the company to appeal to different types of buyers across India, maintaining a broad customer base.
    • Export leadership: Hyundai is a large exporter, sending out 3.53 million vehicles to more than 150 countries since its inception. This enables the company to serve markets in Latin America, Africa, the Middle East, and Asia, solidifying its role as a key supplier in global automobile production.
    • Local R&D support: The R&D center in Hyderabad supports global research for compact vehicles. This focus on local customizations is essential for catering to Indian customer preferences, helping Hyundai remain competitive.
    • Extensive sales and service network: Hyundai has established a strong presence in India, with 1,366 sales outlets and 1,550 service centers, ensuring customers can easily access sales and support in both urban and rural areas.
    • Healthy financial growth: The revenue of the company has consistently grown over the years, from ₹40,972.25 crore in 2021 to ₹60,307.58 crore in 2023. This financial growth reflects strong customer demand and efficient operations.

    Risks Related to the Company

    • Supply chain risks: Hyundai relies on a limited number of suppliers for its parts. Any disruptions could impact production and overall operations.
    • Legal challenges: Hyundai faces several legal cases, including tax claims and civil litigations amounting to ₹5,469.80 crore. Negative outcomes in these proceedings could affect the company’s financial stability.
    • Single production facility: Hyundai’s manufacturing operations are concentrated in one plant in Chennai. Any disruption at this facility could significantly impact their ability to meet market demand.
    • Competition from sister companies: Hyundai’s parent group includes other companies like Kia, which operate in similar market segments. This competition could affect Hyundai’s growth and market presence.
    • Large focus on SUVs: A substantial part of Hyundai’s success in India is due to its SUV models. Any decline in SUV demand could negatively impact the company’s sales.
    • Financial liabilities: Hyundai has borrowings of ₹784.48 crore (as of December 2023). Failing to meet these obligations could lead to financial strain.

    Financial Information of the Company

    Particulars Year ending on March 31, 2023 Year ending on March 31, 2022
    Revenue from Operations (in ₹ million) 603,075.80 473,784.32
    Profit After Tax (PAT) (in ₹ million) 47,092.50 29,015.91
    Cash & Cash Equivalents (in ₹ million) 177,411.47 141,388.42
    Total sales volume (x) 720,565 610,760
    Net Worth (in ₹ million) 200,548.18 168,562.55
    Earnings Per Share (“EPS”) 57.96 35.71
    Total Borrowings (in ₹ million) 11,586.00 11,400.33
    Return On Capital Employed (%) 28.75 20.37

    Source: Hyundai India RHP | Company Profile: Hyundai Motor India Limited

    Conclusion

    Hyundai IPO presents a good opportunity for investors seeking exposure to the automobile sector. The company has a strong foundation, offering a diverse range of vehicles, a proven track record, and impressive financial growth. However, investors should consider potential risks like supplier dependence, legal liabilities, and competition with sister companies before making any decisions. Pay close attention to the upcoming Hyundai IPO details and proceed with caution.

  • A Comprehensive Guide to Foreign Portfolio Investment (FPI)

    A Comprehensive Guide to Foreign Portfolio Investment (FPI)

    Imagine sipping your favorite drink somewhere in Europe while your money works for you in India. The Indian stock market has grown tremendously over time. In fact, Bloomberg noted a 270% rally in the Bombay Stock Exchange (BSE), designating it as a leading stock performer.

    In this guide, we’ll walk you through the meaning of foreign portfolio investment (FPI), its benefits, eligibility criteria, risks, and how to invest.

    What is Foreign Portfolio Investment (FPI)?

    Foreign portfolio investment (FPI) includes cross-border securities such as stocks, bonds, and derivatives held by investors in a different country. For example, a foreign investor interested in India’s publicly traded securities can invest through FPI. Although FPI is highly liquid and offers quicker returns on investment, the investor has no direct control over the investments.

    Who is Eligible for Making Foreign Portfolio Investments?

    To qualify for making foreign portfolio investments, an investor should meet the following criteria:

    • Should not be a resident of India under the Income-tax Act of 1961.
    • Should not be a Non-Resident Indian (NRI), which refers to Indian nationals residing abroad indefinitely.
    • Must be a resident of a country whose securities regulatory body is a signatory to IOSCO’s multilateral memorandum or a bilateral memorandum with SEBI.
    • Should reside in a nation categorized by the FATF as:
      • Having strategic Anti-Money Laundering measures or one dealing with terrorism financiers subject to counter-measures.
      • Failing to make adequate advancements in addressing identified deficiencies or showing no commitment to developing a plan with FATF to address them.
    • Should be legally allowed to invest in cross-border securities beyond their country.
    • If the investor is a bank, its resident central bank must be a member of the Bank for International Settlements (BIS).
    • If a corporation or trust, it must be expressly permitted by its memorandum or articles of association.
    • Should be financially sound, sufficiently experienced, professionally suitable, and display integrity and fairness.
    • Should meet the Schedule II SEBI 2008 criteria.

    How Are Foreign Portfolio Investments Categorized?

    FPIs are categorized based on the mode of registration. Here are the three categories:

    • Category I: Comprises government or related investors, such as central banks, governments, multilateral agencies, and international organizations.
    • Category II: Includes broad-based funds like insurance and mutual funds, regulated persons like portfolio managers, and unregulated broad-based funds with regulated investment managers.
    • Category III: Covers entities not included in Categories I and II, such as individuals, charitable societies, family offices, corporate bodies, and foundations.

    Key Benefits of Foreign Portfolio Investments

    • Portfolio diversification: FPI allows investors to diversify their portfolios and spread risk in international securities markets. This reduces their dependence on the domestic market and broadens their risk-adjusted returns. For example, if you have invested in U.S. stocks but want to add Asian equities to your portfolio, this helps buffer your investments against U.S. market downturns.
    • Higher liquidity: Since most foreign portfolio investments are highly liquid, investors can easily sell them to generate quick cash. Likewise, they can take advantage of buying opportunities as they arise.
    • Access to new investment markets: FPI opens investment opportunities in markets lacking in an investor’s home country. For instance, a Scandinavian investor focused on renewable energy may want to tap into manufacturing securities in Southeast Asia, particularly India. FPI makes this possible.
    • Higher return prospects: Investing in new frontiers can lead to increased returns. For example, India’s rapidly growing economy offers investors higher potential for aggressive returns. Foreign investors who invested in India’s financial growth sector via FPI have often seen significant gains compared to their domestic markets.
    • Exchange rate benefit: FPI allows investors to hedge against their home country’s currency depreciation. If an investor’s home currency becomes unstable, they can leverage FPI returns from more stable currencies, such as the Indian Rupee, to mitigate losses.

    Foreign Portfolio Investment Risks

    • Currency volatility: When investing, you buy securities in a foreign country’s currency at the prevailing exchange rate. Depending on how your home currency moves after the sale, this could impact your returns positively or negatively.
    • Liquidity risk: This refers to the difficulty in selling your investments promptly without significant losses, often due to economic or political instability. As a foreign investor, it’s difficult to completely shield yourself from liquidity risks.
    • Increased transaction costs: Depending on your choice of foreign market, transaction costs may be minimal or significant. You may incur fees such as brokerage fees, transaction taxes, exchange fees, depository charges, and exit loads. Additionally, if you hire a fund manager, fees will multiply.

    Here’s an example of typical transaction costs for investing in India:

    Transaction Cost Rate
    Brokerage fees 0.01% – 0.5%
    Securities Transaction Tax (STT) 0.025% on purchase and sale
    Depository Participant charges INR 12.5 plus 18% GST per stock per day
    Exit load Varies

    Note: These costs are just an example and are often negligible.

    How to Venture into Foreign Portfolio Investment

    1. Designate a legal representative to help you obtain an FPI license as per SEBI regulations.
    2. Choose a tax advisor to assist with record maintenance, fund repatriation, annual tax compilation, and tax representation.
    3. Designate a domestic partner or custodian like Findoc to help you open a demat account and manage other custodial services.

    Key Takeaways on Foreign Portfolio Investments (FPI)

    Foreign portfolio investment allows you to diversify your portfolio and take advantage of international markets. To enter this space, it’s important to understand the regulatory framework and select the right investment vehicles cautiously.

    Findoc is here to guide you through the entire foreign portfolio investment process hassle-free. Let’s get started with our FPI broking and execution services.