findocblog

Blog

  • Ranjeet Mechatronics Ltd Announces Stock Split: Shares to Become More Affordable for Investors

    Ranjeet Mechatronics Ltd Announces Stock Split: Shares to Become More Affordable for Investors

    Ranjeet Mechatronics Ltd, a small-cap company in the civil construction and systems integration space, has officially announced its first-ever stock split, aiming to make its shares more accessible to retail investors.

    The board of directors has approved the sub-division of its equity shares, reducing the face value from ₹10 to ₹5, effectively splitting each share into two new shares. The record date for this corporate action has been set for Monday, April 21, 2025.

    Stock Split Details

    According to the company’s regulatory filing, the stock split will occur as follows:

    • Stock Split Ratio: 1:2

    • Pre-Split Face Value: ₹10 per share

    • Post-Split Face Value: ₹5 per share

    • Record Date: April 21, 2025 (Monday)

    This means shareholders holding one equity share of ₹10 as of the record date will receive two equity shares of ₹5 each, fully paid-up. The objective is to enhance liquidity in the stock, improve affordability, and broaden shareholder participation.

    About Ranjeet Mechatronics Ltd

    Ranjeet Mechatronics Ltd is a fast-growing player in mechanical, electrical, plumbing (MEP), automation, and fire safety systems. As a turnkey solutions provider, the company caters to large infrastructure and civil construction projects across India. Since its listing on the BSE SME platform in September 2018, the company has gained investor attention for its consistent operational growth and focus on value addition.

    Clarification on Earlier Filing

    There was an initial confusion due to a typographical error in the company’s earlier announcement, suggesting a split into one share of ₹5 instead of two. This was quickly rectified, with the company confirming the correct ratio as 1:2, ensuring clear communication with shareholders and regulatory bodies.

    Background: Bonus Shares and Rising Momentum

    This stock split announcement comes shortly after the company declared a 1:1 bonus issue, rewarding shareholders with an additional share for every one they held. The record date for the bonus shares was April 2, 2025.

    This dual corporate action—bonus issue followed by a stock split—demonstrates the company’s intent to reward existing shareholders and build momentum in its stock, which is already catching the attention of investors.

    Final Thoughts

    The 1:2 stock split by Ranjeet Mechatronics Ltd, following its recent 1:1 bonus issue, reflects a strategic move to enhance liquidity, reward shareholders, and boost investor sentiment.

    As the stock prepares for a critical record date on April 21, all eyes are on how the market reacts post-split. Given its performance track record and niche presence in the infrastructure support space, Ranjeet Mechatronics is a penny stock to watch closely.

    Disclaimer: This article is for informational purposes only and should not be considered as investment advice.

  • Are banks slowing down, amid slowing credit expansion? Here’s what experts say

    Are banks slowing down, amid slowing credit expansion? Here’s what experts say

    The Indian banking sector has been one of the market’s bright spots in recent quarters, consistently outperforming broader indices. While the Nifty has slipped over 6% year-to-date (YTD), the Bank Nifty is down just 2%, showing relative resilience.

    But beneath this outperformance lies a more nuanced story—credit growth is clearly losing steam.

    With multiple headwinds converging—from regulatory tightening to macroeconomic caution—the critical question now is: Are Indian banks entering a slowdown phase? And if so, is it a temporary breather or the start of a longer trend?

    Let’s break it down.

    Slower Loan Growth: A Growing Concern

    Bank credit growth, which once galloped in the 14–16% range, has cooled sharply. As of February 2025, year-on-year credit growth stood at 10.9%, down significantly from 16.6% (ex-HDFC merger) and 20.6% (incl. merger) in February 2024.

    The deceleration is widespread:

    • Personal loans growth halved to 8.4% from nearly 20% last year.

    • Credit card loan growth plunged to 11.2% from 31% a year ago.

    • Loans to NBFCs and the services sector also slowed dramatically.

    • Industry loans saw tepid growth at 7.3% YoY, down from 8.4%.

    The slowdown isn’t surprising. In late 2023, the RBI tightened norms for unsecured lending, requiring banks to hold more capital against risky assets like personal loans and credit card debt. The result? Banks pulled back sharply from aggressive lending, especially in the retail segment.

    Deposit Growth Keeps Pace, But CD Ratio Remains Elevated

    Interestingly, deposit growth has largely kept pace with credit growth. As of Feb 2025, deposits were up 10% YoY, almost matching the growth in loans. However, the credit-deposit (CD) ratio—a key metric that shows how much of the deposits are being lent—remains high at over 80%.

    Some banks are actively working to lower this ratio. For instance:

    • HDFC Bank’s CD ratio improved to 97% in March from 101% in September 2024, reflecting a deliberate focus on liability management.

    • The bank’s deposit growth (14% YoY) outpaced its loan growth (5.4% YoY), a rare but telling shift.

    The Outlier: Gold Loans Buck the Trend

    While most loan segments are cooling, gold loans have surged—up a whopping 87.4% YoY in February. This growth stems from:

    • Reclassification of agri-gold loans to retail gold loans (which have higher credit limits).
    • A sharp 37% rise in gold prices, making gold-backed lending more attractive for both banks and borrowers.

    Banks like CSB Bank, with a strong gold loan portfolio, reported 30% YoY loan growth, showing how this niche segment has become a major driver amid otherwise tepid credit conditions.

    What Does This Mean for Bank Earnings?

    Despite slower credit expansion, bank earnings have held up, so far.

    • Asset quality remains benign in most segments, except for microfinance and unsecured credit, which are showing some stress.

    • Net Interest Margins (NIMs) are expected to shrink in coming quarters, especially after the RBI’s February 2025 rate cut.

    • However, lower credit costs and better operating efficiency may cushion the impact on profits.

    That said, most analysts agree that banking sector profitability has peaked, and the FY26 outlook will hinge on margin management and cost discipline.

    The Regulatory Tailwind: A Silver Lining

    There is good news, though. The RBI, under Governor Sanjay Malhotra, has signaled a more supportive stance:

    • 25 bps rate cut in April 2025 (with more expected).

    • Liquidity infusion through OMOs, VRR auctions, and dollar swaps.

    • Postponement of stricter regulations on LCR norms and project finance provisioning.

    • Relaxation of risk weights for microfinance and NBFC loans.

    These steps suggest a regulatory pivot to stimulate lending and ease liquidity, which could pave the way for a rebound in credit growth later this year.

    What Do Experts Say?

    Market analysts widely believe that the recent slowdown in loan growth was largely anticipated following the Reserve Bank of India’s regulatory tightening in late 2023. 

    The measures, especially higher capital requirements for unsecured lending, prompted banks to recalibrate their risk strategies and focus on improving credit quality and deposit traction.

    Experts also point to a meaningful policy shift by the RBI in early 2025, including liquidity infusion measures and the first rate cut in several quarters. 

    These steps are seen as early signs of a more accommodative stance aimed at reviving lending momentum and supporting broader economic activity.

    According to research firms and brokerage houses, large private sector banks such as HDFC Bank, ICICI Bank, and Kotak Mahindra Bank are expected to weather the transition better than smaller peers, owing to their stronger balance sheets, robust liability franchises, and better digital ecosystems.

    Conclusion

    The Indian banking sector is clearly in a phase of moderation—not distress. Slower credit growth is a natural correction after years of rapid retail lending and aggressive expansion.

    While near-term pressures on margins and growth may persist, strong asset quality, improving deposit traction, and supportive regulatory policies offer a cushion. If the macroeconomic environment stabilizes and RBI’s rate cuts spur demand, banks could very well resume their growth journey in the second half of FY26.

    Until then, the sector may be cooling—but it’s far from cold.

    Disclaimer: This article is for informational purposes only and should not be considered as investment advice.

  • Viji Finance Q4 FY25 Results: Net Profit Soars 33,900%, PBIDT Up 562%

    Viji Finance Q4 FY25 Results: Net Profit Soars 33,900%, PBIDT Up 562%

    Viji Finance Ltd has reported an impressive turnaround in its Q4 FY25 performance, showcasing a significant jump in profitability and operational efficiency.

    Result Summary:

    • Net Profit (PAT) surged to ₹6.80 million from just ₹0.02 million in Q4 FY24. That’s a staggering 33,900% growth, indicating a strong recovery in business performance.
    • Sales revenue grew by 7.83%, rising to ₹5.92 million from ₹5.49 million in the same quarter last year.
    • The company earned ₹4.44 million in other income, a dramatic increase from ₹0.02 million – suggesting gains from non-core operations like investments or asset sales.
    • Profit Before Interest, Depreciation, and Tax (PBIDT) jumped by 562.07%, reaching ₹9.60 million compared to ₹1.45 million in Q4 FY24.
    • Profit Before Tax (PBT) stood at ₹7.34 million, sharply up from just ₹0.01 million, reflecting an unmatched 733000% increase.
    • Despite higher interest costs, which rose by 150.91% to ₹1.38 million, the overall profitability saw robust improvement due to strong income growth and better operational leverage.
    • The PBIDT margin also saw a notable improvement, expanding from 26.41% to 162.16%, indicating better cost control and improved income mix.
    Metrics Q4 FY25 (₹ in Millions) Q4 FY24 (₹ in Millions) % Change
    Sales 5.92 5.49 7.83%
    Other Income 4.44 0.02 22100%
    PBIDT 9.60 1.45 562.07%
    Interest 1.38 0.55 150.91%
    PBT 7.34 0.01 733000%
    TAX 0.54 -0.01 -5500%
    PAT 6.80 0.02 33900%
    PBIDT Margin (%) 162.16% 26.41% 513.98%

    Year-to-Date & Annual View

    • For the full year ending March 2025, PAT rose by 38.84% to ₹1.68 million, compared to ₹1.21 million in FY24.
    • Annual Sales grew by 20.78%, while Other Income shot up to ₹6.04 million from ₹0.02 million – underlining the company’s ability to generate returns beyond its core lending business.
    • PBIDT for the year stood at ₹10.31 million, marking a 40.08% growth, and PBT increased to ₹2.16 million from ₹2.01 million.

    Final Thoughts

    Viji Finance Ltd has delivered a solid set of numbers in Q4 FY25. The huge spike in net profit and operational margins indicates an efficient financial strategy. The rise in other income might not be recurring, but it definitely contributed positively to the quarter. Moving forward, if the company continues to scale its lending business and keeps costs in check, profitability could stay strong.

    Disclaimer: This blog is for informational purposes only and should not be considered as financial advice or any buy/sell recommendations.

  • Orient Cement Q4 FY25 Results: Net Profit Falls 38%, Revenue Down 7%

    Orient Cement Q4 FY25 Results: Net Profit Falls 38%, Revenue Down 7%

    Orient Cement Ltd announced its Q4 FY25 financial results, reflecting a weaker performance compared to the same quarter last year. The company reported a 38.32% decline in net profit and a 7.08% drop in sales during the quarter ended March 2025.

    Result Summary:

    • Revenue from operations fell to ₹8,251.88 million, compared to ₹8,880.28 million in Q4 FY24, showing a 7.08% drop.

    • Operating profit (PBIDT) declined sharply by 28.88% to ₹1,106.78 million.

    • Profit before tax (PBT) stood at ₹678.71 million, a 38.31% fall from ₹1,100.16 million in the same quarter last year.

    • Net profit (PAT) dropped to ₹420.69 million from ₹682.01 million, marking a 38.32% decline.

    • EBITDA margin (PBIDTM%) also contracted to 13.41% from 17.52%, indicating weaker cost control or operational pressures.

    Orient Cement Q4 FY25 Financial Results
    Metric Q4 FY25 (₹ Mn) Q4 FY24 (₹ Mn) YoY Change (%)
    Sales 8,251.88 8,880.28 -7.08%
    PBIDT 1,106.78 1,556.12 -28.88%
    PBT 678.71 1,100.16 -38.31%
    PAT 420.69 682.01 -38.32%
    EBITDA Margin 13.41% 17.52% -23.46%

    What Contributed to the Weak Performance?

    • The fall in sales signals a possible decline in cement demand or pricing pressures in key markets.

    • Input cost inflation and higher operational costs likely compressed margins, as seen from the lower PBIDTM.

    • Interest expenses also dropped by 29.07%, offering some cushion, but it wasn’t enough to offset the decline in operating profit.

    • Tax outflow reduced by 38.29%, in line with the lower pre-tax earnings.

    Year-To-Date and Annual Overview

    Looking at the full-year performance (FY25), Orient Cement posted a 47.82% drop in net profit, down to ₹912.46 million from ₹1,748.53 million in FY24. Revenue declined 14.95%, while operational profit (PBIDT) slipped by nearly 31%. The profitability margin fell to 11.86% from 14.59% last year.

    Disclaimer: This blog is for informational purposes only and should not be considered as financial advice or any buy/sell recommendations.

  • Dolphin Medical Q4 FY25 Results: Net Loss Narrows by 48%, Sales Up 3.6%

    Dolphin Medical Q4 FY25 Results: Net Loss Narrows by 48%, Sales Up 3.6%

    Dolphin Medical Services Ltd reported its Q4 FY25 financials with signs of marginal recovery, though the company remains in the red. The topline showed modest growth, and losses reduced significantly compared to the same quarter last year.

    Result Summary:

    • Sales growth remains positive at 3.6% YoY in Q4 FY25.
    • Losses narrowed substantially, with PAT loss reduced by nearly half compared to last year.
    • Operating margins improved sharply, indicating better cost control despite negative PBIDT.
    • Depreciation expenses tripled, possibly due to asset additions or revaluation.
    • Overall, the company is moving toward operational stability but still remains in the loss zone.
    Financial Summary
      Quarter ended Year to Date Year ended
    202503 202403 % Var 202503 202403 % Var 202503 202403 % Var
    Sales1.441.393.607.796.7914.737.796.7914.73
    Other Income0.090.090.000.370.370.000.370.370.00
    PBIDT-0.34-1.13-69.910.41-0.41-200.000.41-0.41-200.00
    Interest0.020.020.000.100.100.000.100.100.00
    PBDT-0.36-1.15-68.700.31-0.51-160.780.31-0.51-160.78
    Depreciation0.300.10200.000.630.4734.040.630.4734.04
    PBT-0.66-1.25-47.20-0.32-0.98-67.35-0.32-0.98-67.35
    TAX0.030.08-62.500.030.08-62.500.030.08-62.50
    Deferred Tax0.030.08-62.500.030.08-62.500.030.08-62.50
    PAT-0.69-1.33-48.12-0.35-1.06-66.98-0.35-1.06-66.98
    Equity151.00151.000.00151.00151.000.00151.00151.000.00
    PBIDTM(%)-23.61-81.29-70.965.26-6.04-187.165.26-6.04-187.16

    Revenue Performance

    For the quarter ended March 2025 (Q4 FY25), Dolphin Medical posted sales of ₹1.44 million, marking a 3.60% increase from ₹1.39 million in Q4 FY24. The year-to-date (YTD) sales for FY25 stood at ₹7.79 million, up by 14.73% compared to ₹6.79 million during the same period last year. This steady increase indicates marginal recovery in operating performance.

    Profitability Still in the Negative Zone

    While the Profit Before Interest, Depreciation, and Tax (PBIDT) showed a significant year-on-year improvement in Q4, it still remained in the negative territory. PBIDT narrowed to ₹-0.34 million in Q4 FY25 from ₹-1.13 million in Q4 FY24—a 69.91% improvement. However, year-to-date PBIDT remains unchanged at ₹-0.41 million compared to the previous year.

    Net Loss Reduced

    The net loss (PAT) for Q4 FY25 came in at ₹-0.69 million, compared to ₹-1.33 million in Q4 FY24, showing a notable 48.12% reduction. For the full year as well, PAT losses reduced by 66.98%, coming down from ₹-2.08 million in FY24 to ₹-0.69 million in FY25. The drop in losses can be attributed to better cost control and slightly higher revenue.

    Margins Showed Signs of Life

    PBIDT margins improved substantially in Q4 FY25 to -23.61% from -81.29% in Q4 FY24. This shows that although the company is still operating at a loss, its efficiency in managing operating expenses has improved. On a yearly basis, the margin stood at -6.04% against -18.67% last year.

    Other Key Highlights

    • Depreciation cost increased to ₹0.30 million in Q4 FY25 from ₹0.10 million in Q4 FY24.
    • Tax and deferred tax each stood at ₹0.03 million in the quarter, compared to ₹0.08 million last year.
    • Equity capital remained unchanged at ₹151.00 million.

    The Bottom Line

    Dolphin Medical Services Ltd showed signs of recovery in Q4 FY25, with narrowing losses and improved margins. The modest increase in sales and better cost efficiency helped cushion the bottom line. However, the company still needs to achieve profitability and scale operations to sustain long-term growth. Investors should continue to watch the trend in operating margins and revenue growth in upcoming quarters.

    Disclaimer: This blog is for informational purposes only and should not be considered as financial advice or any buy/sell recommendations.

  • Anand Rathi Wealth Q4 FY25 Results: Net Profit Rises 30% YoY, Revenue Up 21%

    Anand Rathi Wealth Q4 FY25 Results: Net Profit Rises 30% YoY, Revenue Up 21%

    Anand Rathi Wealth Ltd has announced its Q4 results for FY25, delivering strong financial performance across key metrics. The company reported solid growth in sales, profitability, and margins, reflecting robust demand and effective cost management.

    Key Highlights – Q4 FY25 (Quarter Ending March 2025)

    • Revenue from Operations (Sales) surged to ₹2132.94 million, a YoY growth of 20.69% compared to ₹1767.34 million in Q4 FY24.
    • Other Income increased by 48.41%, reaching ₹184.37 million from ₹124.23 million.
    • PBIDT (Profit Before Interest, Depreciation & Tax) stood at ₹1071.10 million, growing by 29.14% year-on-year.
    • Interest Expense rose to ₹36.54 million, up by nearly 99.45%, which suggests increased borrowings or higher finance costs.
    • PBDT (Profit Before Depreciation & Tax) increased by 27.55%, reaching ₹1034.56 million.
    • Depreciation jumped to ₹58.53 million (vs. ₹39.44 million), marking a 48.40% rise.
    • PBT (Profit Before Tax) rose to ₹976.03 million, registering 26.49% YoY growth.
    • Tax Expense grew by 16.24% to ₹251.76 million.
    • Deferred Tax showed a sharp increase of 48.71%, amounting to ₹28.85 million.
    • PAT (Profit After Tax) came in at ₹724.27 million, a strong YoY growth of 30.40% compared to ₹555.04 million in the same quarter last year.
    • Equity Capital rose to ₹415.10 million, up by 98.48%, likely due to equity infusion or bonus issuance.
    • PBIDT Margin expanded to 50.22%, from 46.93% in Q4 FY24, indicating improved operational efficiency.
    Anand Rathi Wealth Ltd – Q4 FY25 Financial Statement
    Metric Q4 FY25 (₹ in Millions) Q4 FY24 (₹ in Millions) YoY % Change
    Sales 2132.94 1767.34 20.69%
    Other Income 184.37 124.23 48.41%
    PBIDT 1071.10 829.39 29.14%
    Interest 36.54 18.32 99.45%
    PBDT 1034.56 811.07 27.55%
    Depreciation 58.53 39.44 48.40%
    PBT 976.03 771.63 26.49%
    TAX 251.76 216.59 16.24%
    Deferred Tax 28.85 19.40 48.71%
    PAT 724.27 555.04 30.40%
    Equity 415.10 209.14 98.48%
    PBIDT Margin (%) 50.22% 46.93% +7.01%

    The Bottom Line

    The company has delivered an impressive set of numbers in Q4 FY25, supported by double-digit revenue growth and significant margin improvement. The sharp rise in PAT reflects effective cost control and strong topline momentum. However, the surge in interest and depreciation costs could be monitored in upcoming quarters to assess their long-term impact on bottom line.

    Overall, Anand Rathi Wealth Ltd continues to strengthen its financials, driven by higher client engagement, wealth management traction, and expansion in equity base.

    Disclaimer: This blog is for informational purposes only and should not be considered as financial advice or any buy/sell recommendations.

  • Padam Cotton Q4 FY25 Result: Net Profit Surges 717.81%, Revenue Up

    Padam Cotton Q4 FY25 Result: Net Profit Surges 717.81%, Revenue Up

    Padam Cotton Yarns Ltd has delivered an exceptional turnaround in its Q4 FY25 results, reflecting a robust recovery in operations and profitability. The company has seen a significant surge across all major financial metrics when compared to the same quarter last year (Q4 FY24).

    Key Highlights – Q4 FY25 (Quarter Ending March 2025)

    • Revenue Growth: Sales jumped to ₹131.12 million, a massive increase from just ₹0.05 million in Q4 FY24. This reflects a growth of 262140%, indicating a sharp revival in the company’s core business operations.
    • Other Income rose sharply to ₹6.96 million, up from ₹0.24 million, marking a 2800% rise.
    • Operating Profit (PBIDT) turned around significantly to ₹29.93 million compared to a loss of ₹-1.93 million last year, showing strong operational efficiency.
    • Profit Before Tax (PBT) came in at ₹29.66 million versus a loss of ₹-4.51 million in Q4 FY24, showing a complete reversal in profitability.
    • Net Profit (PAT) rose to ₹22.55 million from a loss of ₹-3.65 million in the same period last year, marking a growth of 717.81%.
    • The PBIDT margin for the quarter stood at 22.83%, compared to a negative margin of -3860.00% in Q4 FY24, highlighting efficient cost management.

    Padam Cotton Yarns Q4 2025 Financial Statement

    Metric Q4 FY25 (₹ in Millions) Q4 FY24 (₹ in Millions) % Change
    Sales 131.12 0.05 262140%
    Other Income 6.96 0.24 2800%
    PBIDT 29.93 -1.93 1650.78%
    PBT 29.66 -4.51 757.65%
    PAT 22.55 -3.65 717.81%
    PBIDT Margin (%) 22.83 -3860.00 100.59%

    Year-To-Date & Full Year Performance

    For the full year ended March 2025, sales stood at ₹142.19 million, up significantly from ₹0.05 million in FY24. PAT rose to ₹105.99 million compared to ₹16.54 million in FY24, recording a growth of 540.81%.

    Operating profit for the year came in at ₹131.03 million, up from a loss in the previous year. These results clearly reflect a strong financial comeback for the company.

    The Bottom Line

    Padam Cotton Yarns Ltd has delivered a stellar set of numbers for Q4 FY25. The massive jump in revenue and profits indicates that the company has effectively navigated its previous challenges. Improved operational efficiency, along with strong top-line and bottom-line performance, positions the company well for future growth.

    Disclaimer: This blog is for informational purposes only and should not be considered as financial advice or any buy/sell recommendations.

  • TCS Q4 FY25 Results: Revenue Rises 5.14% YoY, Net Profit Falls 2.43%

    TCS Q4 FY25 Results: Revenue Rises 5.14% YoY, Net Profit Falls 2.43%

    Tata Consultancy Services Ltd (TCS) reported its financial results for the fourth quarter ended March 2025 (Q4 FY25), reflecting a stable operational performance with notable growth in revenue and a slight dip in profitability.

    Result Summary:

    • Sales grew by 5.14% YoY in Q4 FY25.
    • PBIDT margin contracted to 29.54% from 31.76% last year.
    • PAT declined by 2.43% YoY to ₹111,160 million.
    • Depreciation cost increased significantly by 14.67%.
    • Deferred tax adjustments surged by 57.97%.

    TCS Q4 Financial Statement 2025 (₹ in Million)

    Metric Q4 FY25 (202503) Q4 FY24 (202403) % Change
    Sales 541,360 514,880 5.14%
    Other Income 19,220 18,060 6.42%
    PBIDT 159,910 163,520 -2.21%
    Interest 2,010 1,970 2.03%
    Depreciation 11,180 9,750 14.67%
    PBT 146,720 151,800 -3.35%
    TAX 35,560 37,870 -6.10%
    Deferred Tax -2,180 -1,380 57.97%
    PAT 111,160 113,930 -2.43%
    PBIDT Margin (%) 29.54 31.76 -6.99%

    Revenue Growth Outpaces Profit

    For the quarter ended March 2025, TCS reported sales of ₹541,360 million, registering a 5.14% growth compared to ₹514,880 million in the same quarter last year. The robust top-line performance indicates sustained demand across key verticals and geographies.

    Other income stood at ₹19,220 million, up 6.42% YoY, reflecting better treasury income or gains from non-core activities.

    Margins Witness Slight Pressure

    Despite higher revenues, operating performance saw marginal compression. The Profit Before Interest, Depreciation, and Tax (PBIDT) came in at ₹159,910 million, slightly down by 2.21% from ₹163,520 million in Q4 FY24. This resulted in a PBIDT margin of 29.54%, lower than last year’s 31.76%.

    Interest expenses rose marginally by 2.03% to ₹2,010 million, while depreciation expenses increased significantly by 14.67% to ₹11,180 million.

    Profitability Declines

    Profit Before Tax (PBT) for the quarter stood at ₹146,720 million, a decline of 3.35% YoY. TCS reported Profit After Tax (PAT) at ₹111,160 million, marginally down by 2.43% compared to ₹113,930 million in the corresponding period last year. The drop in PAT was primarily due to increased depreciation and higher tax expenses.

    Tax outgo reduced by 6.10% to ₹35,560 million, but deferred tax adjustments increased significantly by 57.97%, standing at -₹2,180 million compared to -₹1,380 million in Q4 FY24.

    Year-to-Date and Annual Performance

    On a year-to-date basis (FY25), the company clocked total sales of ₹2,148,530 million, showing a 6.17% growth from the previous year. Annual PAT reached ₹480,570 million, rising 10.33% YoY, indicating a strong full-year performance despite a weaker Q4.

    Equity Capital Remains Unchanged

    The company maintained its equity capital base at ₹3,620 million during the quarter and full year.

    TCS has delivered steady revenue growth for Q4 FY25 backed by resilient demand and improved other income. However, cost pressures—particularly from higher depreciation and marginally increased interest—impacted its profitability. Investors should watch margin trends in the coming quarters, especially amid evolving macroeconomic conditions and changing client IT budgets.

    Disclaimer: This blog is for informational purposes only and should not be considered as financial advice or any buy/sell recommendations.

  • Earnings season begins: With Q4 results round the corner, here’s what to expect!

    Earnings season begins: With Q4 results round the corner, here’s what to expect!

    April has arrived, and with it, the much-anticipated Q4 earnings season. Over the next few weeks, a flurry of financial results from major Indian firms will give investors a critical read on how corporate India wrapped up FY25, and what might lie ahead as we head into FY26.

    The first week kicks off with big names and a mix of small- and mid-cap companies, all set to declare their performance for the January–March 2025 quarter. While some sectors may shine, others are entering this earnings cycle under a cloud of global uncertainty, margin pressure, and cautious forward guidance.

    So, what should you be watching for?

    TCS to Set the Tone for IT Services

    All eyes are on Tata Consultancy Services (TCS), which will report its Q4FY25 results on April 10. As India’s IT bellwether, TCS often sets the tone for the entire IT pack.

    In Q3, TCS posted healthy revenue growth and a strong $10.2 billion TCV (total contract value), thanks to disciplined execution and operational efficiencies. But Q4 may be trickier. Market watchers expect muted numbers this time, with persistent global uncertainty and soft discretionary IT spending in the West likely weighing on deal momentum.

    That said, investors will pay close attention to management commentary, particularly on deal pipelines, client budgets, and hiring outlook, for cues on the health of the tech sector in FY26.

    Mid & Small-Cap Earnings: Volatility Meets Opportunity

    Beyond TCS, a number of smaller names will unveil their results this week:

    • Anand Rathi Wealth (April 11): A key player in the wealth management space, its earnings will shed light on investor behavior amid recent market volatility.
    • Transformers & Rectifiers (India) (April 8): A mid-cap industrial player whose results could offer insights into the broader capex and infrastructure trends.
    • BF Utilities (April 9): Investors will be keen to see if this small-cap name has maintained financial discipline and capital efficiency in a choppy environment.
    • OK Play India (April 9): Operating in the plastics segment, its performance may reflect input cost dynamics and rural demand strength.
    • Padam Cotton Yarns (April 11): Results from this textile firm could signal trends in export demand, raw material pricing, and inventory management in the broader textiles space.

    What the Street Expects

    Broadly, expectations for Q4FY25 are moderate at best. According to market experts, earnings growth may face downward revisions, especially in export-facing and margin-sensitive sectors.

    Here’s the pulse going into this earnings season:

    • IT Sector: Soft performance expected. Margin pressures, global demand softness, and delayed client spends may impact earnings.
    • Consumer-Facing Companies: FMCG and discretionary consumption may report steady growth, especially as raw material prices ease.
    • Financials: Private banks and wealth managers could see solid performance driven by loan growth and stable asset quality.
    • Industrial & Infra: Results here could reflect the ongoing momentum in India’s capex cycle. Expect a positive tone, especially if order books remain robust.
    • Textiles, Chemicals, Exporters: These sectors could lag due to weak global demand and margin compression from input cost volatility.

    Why This Earnings Season Matters More

    This is not just another quarterly update. These earnings will provide:

    • A health check of how corporate India exited FY25
    • The first formal commentary on FY26 expectations
    • A gauge of resilience in the face of global uncertainty, from Trump tariffs to inflation concerns in the U.S.

    With the RBI policy, macro data, and geopolitical news continuing to drive sentiment, earnings may provide much-needed clarity—and possibly surprises.

    Conclusion

    As always, the headline numbers matter, but this quarter, the tone of commentary will be just as crucial. Are companies seeing demand recovery? Are input costs under control? Are order books filling up? Or are there signs of caution ahead?

    For investors, this earnings season offers both opportunity and insight. Use it to recalibrate, reassess, and realign your portfolio as we transition into a new fiscal year—one that promises both challenges and potential.

    Stay tuned. This quarter could set the stage for what’s next.

    Disclaimer: This article is for informational purposes only and should not be considered as investment advice.

  • Advanced Hedging Techniques with Futures and Options

    Advanced Hedging Techniques with Futures and Options

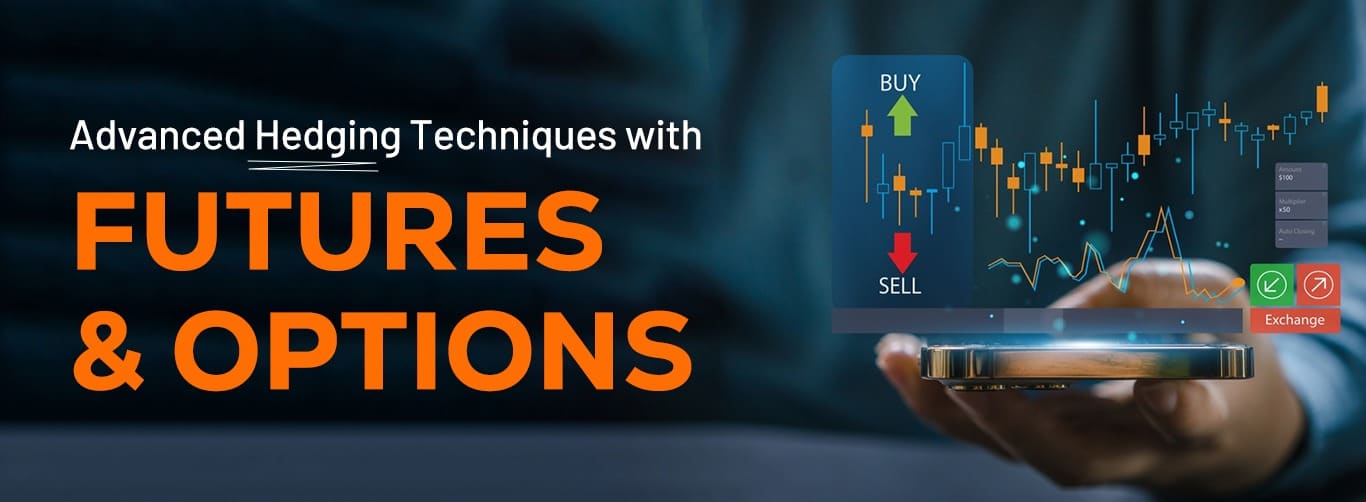
    In the dynamic landscape of financial markets, managing portfolio risk has become an essential aspect of investment strategy. Hedging, particularly through futures and options, provides investors with a structured approach to safeguarding capital against price fluctuations.

    The global growth in derivative trading underlines this trend. In 2023, futures and options contracts reached a record volume of 137 billion, with the Asia-Pacific region, and notably India, contributing significantly to this rise. This momentum reflects the increasing adoption of hedging instruments to navigate volatility and protect investment outcomes.

    This guide outlines advanced techniques to hedge positions using futures and options—designed to help market participants mitigate exposure, preserve capital, and optimize returns.

    What Is Hedging in Simple Terms?

    Hedging is a strategic process of offsetting potential losses in one position by taking an opposing position in a related asset. Much like an insurance policy, it aims to reduce the financial impact of adverse price movements without necessarily seeking to generate profits from the hedge itself.

    Why is Hedging Important?

    In an unpredictable market, even the most well-planned investments can face sudden fluctuations. Hedging acts as a protective strategy that helps investors manage risks and safeguard their portfolios from unforeseen losses. Here’s why hedging plays a vital role in sound financial planning:

    Protects Against Losses: Hedging helps limit potential losses caused by market volatility or sudden price changes.

    Ensures Stability: It keeps your portfolio value stable during uncertain times.

    Supports Long-Term Goals: Hedging allows investors to hold their positions for the long term without panic-selling.

    Improves Confidence: By reducing downside risk, investors can make calmer, more informed decisions.

    Acts as Insurance: Just like an insurance policy, it provides financial protection against unexpected market movements.

    How to Hedge with Futures Contracts

    Futures contracts are standardized agreements to buy or sell an asset at a predetermined price on a specified date. Their binding nature makes them a preferred choice for businesses and investors looking to stabilize costs or returns.

    If you’re starting your trading journey, you can open an online demat account with a trusted broker like Findoc to access futures and options markets seamlessly.


    1. Short Hedge (Selling Futures)

    A short hedge involves selling a futures contract to protect against a possible decline in the price of an asset that one intends to sell in the future.

    Use Case: A manufacturer expecting to sell copper in three months may enter a short futures position to lock in today’s prices and avoid losses from a potential market drop.

    2. Long Hedge (Buying Futures)

    A long hedge is implemented by buying futures contracts to secure the current price of an asset that is expected to be purchased later.

    Use Case: An airline company anticipating a fuel purchase might go long on crude oil futures to protect against rising prices.

    Examples: Let’s say you buy 500 shares of company A at ₹200 each, making your total investment ₹1,00,000. You are worried that the stock price may drop after the upcoming quarterly results. To protect yourself, you decide to hedge with futures by taking a short position.

    You sell one futures contract at ₹202 per share.

    • If the stock price falls to ₹180, you lose ₹20 per share in the cash market (₹10,000 total).

    • But you gain ₹22 per share in the futures market (₹11,000 total).
      Your net profit = ₹1,000, protecting your portfolio from major loss.

    Benefits of Hedging Through Futures

    • Capital Efficiency: Futures require only a margin deposit, allowing traders to control large positions with limited capital.
    • High Liquidity: Futures markets are highly liquid, ensuring rapid execution and minimal price slippage.
    • Price Certainty: Futures enable precise cost forecasting, especially in industries reliant on commodities.
    • Versatility: Suitable for hedging interest rate, currency, and commodity exposures.

    How to Hedge with Options Contracts

    Options provide the right, but not the obligation, to buy or sell an asset at a specific price before the expiration date. This flexibility allows for more tailored risk management strategies compared to futures.

    1. Call Options – Protecting Against Upside Risk

    Call options grant the right to buy an asset at a specified strike price. They are typically used when an investor anticipates a price increase but prefers to limit downside risk.

    Use Case: A fund manager might purchase a call option on the Nifty index to hedge against a potential market rally while preserving downside protection.

    2. Put Options – Shielding from Downside Risk

    Put options provide the right to sell an asset at a predetermined price. They are commonly used to protect long positions from potential losses.

    Use Case: An investor holding a portfolio of banking stocks may buy put options on a banking index to safeguard against sector-specific declines.

    Examples: Now, suppose you buy 1,000 shares of company B at ₹100 each, for a total of ₹1,00,000. To protect against possible decline, you purchase a put option at a premium of ₹5 per share with a strike price of ₹100.

    • If the stock price drops to ₹80, your cash market loss is ₹20,000.

    • But your put option gains ₹15 per share (₹15,000 total).
      Your total loss = only ₹5,000 (the premium paid).
       If the stock rises to ₹120, you ignore the option and keep your ₹20,000 gain, minus ₹5,000 premium — ending with a net profit of ₹15,000.

    Advantages of Options-Based Hedging

    • Defined Risk Exposure: Maximum loss is limited to the premium paid for the option.
    • Strategic Flexibility: Options allow for numerous strategies tailored to various market views and risk appetites.
    • Volatility Management: They are particularly useful in managing exposure to sharp price movements.
    • No Obligation: Unlike futures, options do not bind the holder to exercise the contract, offering flexibility in execution.

    Advanced Hedging Strategies in Futures and Options

    Once you’re comfortable with the basics, these techniques offer more control and precision.

    1. Spread Strategies

    Spread trading involves simultaneously buying and selling related contracts to capitalize on the price differential while limiting overall exposure.

    • Bull Call Spread: Buy a lower strike call and sell a higher strike call when anticipating moderate upside.
    • Bear Put Spread: Buy a higher strike put and sell a lower strike put when expecting moderate downside.

    2. Straddles and Strangles

    These volatility-based strategies involve taking positions on both call and put options.

    • Straddle: Purchase both a call and a put at the same strike price—ideal for uncertain directional moves.
    • Strangle: Buy a call and a put with different strike prices—more cost-effective in highly volatile environments.

    3. Delta Hedging

    This dynamic strategy involves adjusting a portfolio’s exposure to make it delta-neutral, thereby insulating it from small price movements.

    Example: If the delta of a portfolio is +0.5, selling underlying assets in proportion can help neutralize the position.

    Also read: Top Ten Option Trading Strategies for Smarter Trades to strengthen your understanding of how options can be used strategically in different market conditions.

    Difference Between Hedging with Futures vs. Options

    Feature Futures Options
    Obligation Yes No
    Upfront Cost Margin required Premium only
    Risk High (can be unlimited) Limited to premium
    Flexibility Low High

    Key Tips to Hedge Smarter

    In volatile markets, successful trading isn’t just about spotting opportunities—it’s also about protecting your capital. Hedging is a vital risk management tool, but like any strategy, it requires precision, timing, and regular fine-tuning. A smart hedge isn’t just about limiting losses—it’s about optimizing returns while keeping risk exposure in check.

    Whether you’re managing options, futures, or OTC derivatives, here are some key considerations that traders should keep in mind to implement hedging strategies more effectively and avoid common pitfalls:

    • Avoid Overhedging: Excessive hedging may erode profits rather than protect capital.
    • Monitor Liquidity: Always assess the liquidity of the instruments involved to avoid inefficiencies.
    • Account for Rolling Costs: When extending positions, factor in transaction and rollover costs.
    • Evaluate Counterparty Risk: Especially relevant for OTC derivatives.
    • Review Regularly: Hedging strategies should evolve based on market trends and portfolio adjustments.

    Risks with Hedging

    While hedging is an effective tool for managing risk, it is not without its challenges. Investors should understand the potential downsides before using hedging strategies, as improper execution can sometimes lead to higher costs or reduced returns. Here are some key risks to consider:

    • High Costs: Premiums and margin requirements can make hedging expensive.

    • Limited Profit Potential: While protecting against losses, hedging also caps potential profits.

    • Complex Strategies: Using futures and options requires market knowledge and continuous monitoring.

    • Market Timing Risk: Incorrect timing or misjudged hedge size can increase losses instead of reducing them.

    • Liquidity Risk: Some derivative contracts may not have enough buyers or sellers, making it harder to exit a trade quickly.

    Final Thoughts

    Hedging with futures and options isn’t about guessing market moves—it’s about protecting your money. When used well, these tools help you reduce risk, stabilize returns, and seize market opportunities even in turbulent times. Financial institutions and individual investors alike are increasingly leveraging these tools not only for protection but also for strategic positioning.

    Need a hedging strategy that works in real-world markets?

    Connect with Findoc to monitor live data, plan smart trades, and avoid costly errors. Take control of your portfolio today.

    Frequently Asked Questions

    Hedging is a strategy used to reduce financial risk by taking an opposite position in related assets, like futures or options, to offset possible losses.

    Investors use Futures and Options (F&O) to protect portfolios by buying or selling contracts that move opposite to their existing holdings.

    Option hedging limits losses but also restricts profits. It is more helpful in protecting investments than in making large gains.

    You can hedge a portfolio by taking a short position in Nifty futures if you expect the overall market to fall, thereby reducing portfolio risk.