findocblog

Category: Stock Market

  • ⁠Impact of Stock Market Correction? 20 Companies Fall from ₹1 Lakh Crore Club!

    ⁠Impact of Stock Market Correction? 20 Companies Fall from ₹1 Lakh Crore Club!

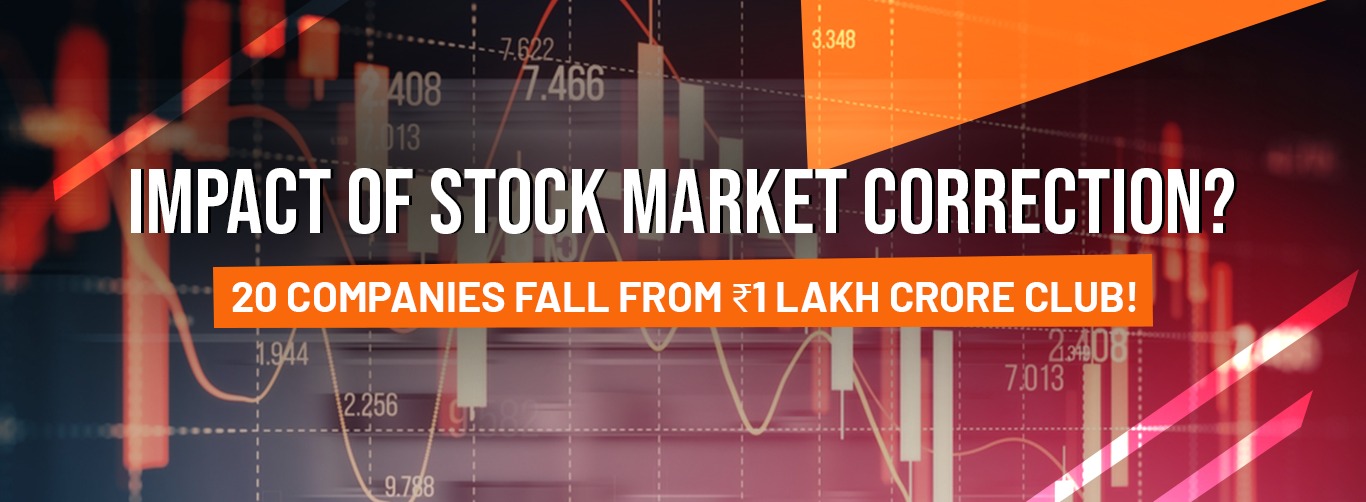
    Amid an ongoing market correction, nearly 20 companies listed on the BSE have slipped below the ₹1 lakh crore market capitalisation threshold since the end of September 2024, when Indian equities were at their peak.

    The affected firms include Mankind Pharma, Tata Consumer Products, CG Power, Havells India, Dr. Reddy’s Laboratories, Apollo Hospitals, JSW Energy, Jindal Steel & Power, Info Edge, Samvardhana Motherson, Dabur, Zydus Lifesciences, ICICI Lombard, Indus Towers, Cummins India, Bosch, ICICI Prudential Life, Canara Bank, and Polycab, among others.

    As of now, 86 companies maintain a market cap above ₹1 lakh crore—a 19% decline from 106 in September 2024. However, five new entrants have emerged, benefiting from strong stock rallies. These include Hyundai Motor India, The Indian Hotels Company, Shree Cement, Mazagon Dock Shipbuilders, and Max Healthcare Institute.

    Factors Driving the Market Correction

    The correction has been triggered by several key factors, including:

    • Sustained foreign investor selling
    • Rich valuations
    • Softening earnings
    • Slower economic momentum
    • Geopolitical concerns, particularly post the US elections

    Since the market highs in September, the Sensex and Nifty have dropped over 10%, while the BSE MidCap and SmallCap indices have fallen by nearly 15% each.

    Historical Context

    Interestingly, despite the recent correction, the number of companies with a market cap above ₹1 lakh crore has slightly increased between the end of FY24 and early FY25. Over the years, this category has seen fluctuations, with 48 companies in FY23 and FY22, up from 36 in FY21, 19 in FY20, and 27 in FY18.

    Market Outlook

    Analysts note that the market faced excessive selling pressure, leading to a much-needed valuation reset. This recalibration offers a strategic opportunity for investors to accumulate fundamentally sound stocks at more reasonable valuations.

    Morgan Stanley, in its latest report, characterised the correction as a potential buying opportunity despite lingering concerns around growth, retail investor sentiment, and stretched valuations. While acknowledging the challenge in timing the bottom, the firm remains optimistic about a market rebound. It highlighted private financials as offering the most attractive risk-reward tradeoff currently.

    Veteran investors have echoed similar sentiments, calling the correction a “normal pullback within a broader bull run.” While acknowledging temporary turbulence stemming from political and economic shifts—particularly in the US—market experts remain confident in the resilience of markets and the long-term trajectory of globalisation.

    Disclaimer: This article is for informational purposes only and should not be considered as investment advice.

  • SEBI’s Big Move! Will Foreign Investors Gain Direct Access to Indian Stocks?

    SEBI’s Big Move! Will Foreign Investors Gain Direct Access to Indian Stocks?

    The Securities and Exchange Board of India (SEBI) is reportedly considering a major policy shift that could alter the way foreign investors participate in India’s stock market. According to a recent report by the Economic Times, SEBI is exploring the possibility of allowing overseas individuals to invest directly in Indian equities, bypassing the existing foreign portfolio investor (FPI) framework.

    This potential reform aims to expand the ownership base for local risk assets, making Indian markets more accessible to global investors. However, concerns about regulatory safeguards and compliance risks remain key discussion points.

    Current Investment Framework for Foreign Investors

    At present, foreign individuals can invest in Indian primary and secondary markets only through the FPI route. Within this structure, investors are required to register under Category II FPIs, which involves engaging a local sub-custodian in India to manage compliance and operational requirements.

    Key restrictions under the current FPI framework:

    • Foreign investors can own up to 10% of a listed Indian company under the FPI route. Any stake exceeding this limit is considered foreign direct investment (FDI) and is subject to sector-specific restrictions.
    • Overseas investors who do not want to register as FPIs have the option of using participatory notes (P-notes), an instrument that has been viewed with suspicion due to its perceived lack of transparency.
    • Strict Know Your Customer (KYC) and Anti-Money Laundering (AML) regulations make it difficult for foreign individuals to invest directly in Indian equities.

    SEBI’s New Proposal

    In a meeting last week, SEBI officials and market participants discussed the potential benefits of allowing direct foreign individual investments in Indian stocks. If implemented, this move could attract ultra-high net worth individuals (UHNWIs) from major financial hubs like London, New York, and Singapore.

    Possible benefits of the proposal include:

    • Broadening the Investor Base: By allowing direct participation, India can attract a larger pool of international investors, increasing liquidity and market depth.
    • Easier Compliance for Investors: Bypassing the FPI route could simplify regulatory procedures, making it more convenient for foreign individuals to invest.
    • Strengthening India’s Global Market Standing: Providing direct access to foreign individuals could enhance India’s reputation as a globally competitive investment destination.

    Need for Safeguards and Regulatory Challenges

    While the proposal has the potential to boost foreign investments, regulatory safeguards will be crucial to mitigate risks such as money laundering and tax evasion. Legal and financial experts have highlighted the importance of maintaining stringent compliance measures.

    Key concerns:

    • Ensuring Proper KYC and AML Compliance: SEBI must implement robust measures to ensure foreign investors adhere to India’s financial regulations.
    • Tax Compliance and Repatriation Controls: Clear guidelines must be established to ensure that foreign investors fulfill tax obligations before repatriating funds.
    • Maintaining Transparency: Direct access should not create loopholes that can be exploited for illicit financial activities.

    Market Implications

    India has experienced significant foreign investor selloffs in recent months, with FPIs reducing their exposure to Indian equities. SEBI’s proposed reform could serve as a countermeasure to attract fresh international capital and stabilize market volatility.

    SEBI Chairman Tuhin Kanta Pandey, speaking at the Moneycontrol Global Wealth Summit 2025, emphasized the need for both domestic and foreign investors to support India’s economic growth. “We will be happy to engage with FPIs and AIF industry participants to address their difficulties and further rationalize regulations to promote ease of operation,” he stated.

    So, What’s Next?

    • SEBI is expected to conduct further deliberations with key stakeholders.
    • Government and RBI approvals will be critical in shaping the final decision.
    • Investors should stay informed about regulatory updates that could impact market dynamics.

    India’s capital markets stand at a pivotal juncture, and SEBI’s next steps will determine the extent to which global investors can participate in India’s growth story.

    Conclusion

    SEBI’s potential move to allow direct foreign individual investments in Indian equities marks a significant departure from the existing regulatory framework. While the proposal has the potential to enhance market liquidity and attract global investors, concerns about compliance, transparency, and regulatory safeguards must be addressed.

    With discussions still in their early stages, the outcome of this policy shift remains uncertain. However, if implemented with the right regulatory framework, this change could position India as a more accessible and attractive investment destination for international investors.

    Disclaimer: This article is for informational purposes only and should not be considered as investment advice.

  • Indian Stock Market Soars – Biggest Monthly Rally in 4 Years!

    Indian Stock Market Soars – Biggest Monthly Rally in 4 Years!

    After five consecutive months of market declines, India’s stock market has staged a spectacular comeback, delivering its biggest monthly rally in 4 years. The total market capitalization of listed firms on the Bombay Stock Exchange BSE surged by 9.4% in March, marking the highest single-month gain since May 2021.

    With this stunning rise, India has outperformed all other top 10 global equity markets, solidifying its position as the best-performing stock market globally.

    India Outshines Global Markets

    According to exchange data, India’s total market cap jumped from $4.39 trillion at the end of February to approximately $4.8 trillion, reflecting a surge of nearly $410 billion in just one month.

    In comparison, other major markets lagged behind:

    • Germany: 5.64%
    • Japan: 4.9%
    • Hong Kong: 4%
    • France: 2.7%
    • China: 2.2%
    • United Kingdom: 2%
    • Canada: 0.44%

    Meanwhile, the United States—the world’s largest equity market—declined by 3.7%, while Saudi Arabia fell 4.4%, highlighting India’s relative strength in global markets.

    This extraordinary rally was led by benchmark indices, with Sensex and Nifty rising 5% in March, while broader indices saw even stronger gains:

    • BSE MidCap Index: 8.4%
    • BSE SmallCap Index: 9.8%

    Clearly, investors are regaining confidence in Indian equities, driven by a mix of domestic and global factors.

    What is Fueling the Market Boom?

    1. Value Buying After Months of Decline

    Before this surge, Indian stocks had undergone a steep correction, particularly in the small and mid-cap segments. The sharp decline in previous months led to attractive valuations, prompting strong bargain hunting by domestic and foreign investors.

    • Nifty rebounded by over 1,100 points, while Sensex surged by 3,500 points in March alone.
    • Investors who had been waiting on the sidelines pounced on the dip, leading to a broad-based rally across sectors.

    2. Anticipation of Interest Rate Cuts

    Expectations of a rate cut by the Reserve Bank of India RBI in April played a major role in boosting investor sentiment. The latest inflation data showed consumer price index CPI inflation remained below RBI’s 4% target, increasing the likelihood of a policy shift.

    Additionally, the US Federal Reserve’s dovish stance—with two expected rate cuts in 2025—has further improved global liquidity conditions, making emerging markets like India more attractive for investors.

    3. RBI’s Liquidity Boost

    Since late 2024, the RBI has injected ₹3 lakh crore in durable liquidity through:

    • Variable Rate Repo VRR auctions
    • Swaps and Open Market Operations OMOs

    This move has eased banking system liquidity constraints, supporting credit growth and corporate earnings expectations.

    4. Foreign Investors Return to Indian Markets

    Foreign Institutional Investors FIIs have made a strong comeback, pumping money into Indian equities. Positive inflows in both cash and derivatives markets have provided much-needed market stability, reducing the volatility seen earlier in 2024.

    5. Declining Crude Oil Prices and Stable Rupee

    A fall in crude oil prices has been another tailwind for Indian markets, reducing import costs and inflation risks. Additionally, a strengthening rupee against the dollar has improved investor confidence.

    Sector-Wise Performance: Who is Leading the Rally?

    The rally was broad-based, with most sectors witnessing gains, but some stood out, such as:

    • Real Estate: Strong demand revival and lower financing costs boosted sentiment
    • Energy: Falling crude oil prices benefited oil marketing companies and power firms
    • Pharma: Defensive plays remained strong amid global uncertainties

    MidCaps and SmallCaps: The biggest gainers, rising 7.7% to 9.8%, as retail and institutional investors piled into undervalued stocks

    The Road Ahead

    While the current momentum is strong, there are a few factors that could influence market direction:

    • March Derivatives Expiry: With March F&O contracts set to expire soon, volatility may increase in the near term
    • US Market Trends: The US equity market’s weakness could spill over into global markets, including India
    • Trump’s Next Moves: Investors are closely monitoring Trump’s stance on tariffs, which could impact global trade sentiment

    Q4 Earnings Season: If corporate earnings remain strong, the rally could sustain into the next quarter

    Final Thoughts

    India’s stock market has delivered a stellar performance, defying global headwinds and reclaiming investor confidence. While short-term volatility is inevitable, the fundamentals remain strong, supported by:

    • Falling inflation and potential RBI rate cuts
    • Improved liquidity from both RBI and FIIs
    • A resilient domestic economy

    With global markets facing uncertainty, India’s growth story remains one of the most attractive investment opportunities.

    However, will the rally continue or is a correction around the corner? This is something that only time will tell, but, for now Indian markets look to be in the control of the bulls. 

    Disclaimer: This article is for informational purposes only and should not be considered as investment advice.

  • Will the Indian Stock Market’s ‘March Magic’ Rally Work in 2025?

    Will the Indian Stock Market’s ‘March Magic’ Rally Work in 2025?

    Seasoned investors and traders often recognize cyclical patterns in the stock market. One such phenomenon is the “March Magic” effect—a recurring trend where stock prices gain upward momentum as the financial year-end approaches.

    This pattern arises from various market forces in March. Mutual funds push to boost their net asset values (NAVs) before the reporting season, while corporate promoters strive to maintain or increase stock prices to enhance the value of pledged shares used as collateral. Historically, these combined efforts have often led to temporary market rallies, giving rise to the term “March Magic.”

    However, evolving market dynamics have raised questions about this cycle’s reliability. With global economic uncertainties, political disruptions, and shifting retail investor behavior, can the March Magic still work in 2025?

    Historical Trends: The Numbers Behind March Magic

    Analyzing nifty historical data can help determine whether March consistently influences stock market trends. Historically, March has shown both strong rallies and sharp corrections, making it a mixed month for investors. Let’s examine some key statistics:

    • US Stock Market: Since 1928, the S&P 500 has averaged a 0.5% gain in March. However, major sell-offs in 2000 and 2020 highlight its volatility.

    • Indian Stock Market: Over the past 23 years, March has demonstrated a bearish tendency, with 56% of those months ending in the red.

    Mean Returns Analysis

    • S&P BSE 500: -0.742 (lowest mean return across all months)
    • NIFTY 500: -0.608 (also the lowest of the year)

    Standard Deviation (Volatility)

    • S&P BSE 500: 3.884
    • NIFTY 500: 2.065

    Skewness and Kurtosis

    • Both indices show negative skewness, indicating more negative returns than positive ones.
    • High kurtosis values (5.720 for BSE 500 and 6.535 for NIFTY 500) suggest a greater likelihood of extreme price movements.

    These numbers show that while March can generate gains, it also brings heightened volatility. The so-called “March Magic” doesn’t guarantee a rally but suggests increased market activity.

    Will March Magic Work in 2025? Key Factors to Watch

    As we step into March 2025, several macroeconomic and market-specific factors will influence whether this historical trend continues. Here are the key elements to monitor:

    1. Fiscal Year-End Market Adjustments

    • Mutual funds may engage in NAV-marking strategies to push stock prices higher.
    • Corporations with pledged shares will aim for price stability or appreciation to maintain favorable borrowing conditions.

    2. Impact of Trump’s Policies on Emerging Markets

    • Past Trump policies have disrupted global markets, potentially reducing the effectiveness of cycles like the March rally.
    • Emerging markets in Asia could experience capital outflows due to policy uncertainties.

    3. Retail Investor Pressure and Overhead Supply

    • Many retail investors may hold high-cost positions from previous rallies and corrections.
    • Selling pressure from these investors could cap market gains and trigger sharp exits.

    4. Economic Policies and SEBI’s Influence

    • SEBI’s recent advisories on small and midcap stocks may drive focus toward large-cap stocks, altering March trends.
    • Fiscal policies from the Union Budget will significantly impact investor sentiment.

    5. Tax-Related Trading Adjustments

    • March often witnesses portfolio rebalancing and tax-loss harvesting as investors adjust holdings before the financial year closes.
    • These adjustments contribute to volatility, with both buying and selling pressures influencing stock prices.

    Conclusion

    While historical data suggests that March has the potential to deliver gains, it remains an unpredictable month. Fiscal year-end adjustments, investor sentiment, and external macroeconomic factors will shape market movements in 2025.

    Investors should stay cautious but remain opportunistic:

    • If a rally occurs, use it to exit breakeven positions rather than chase fresh gains.
    • Prioritize capital preservation over aggressive risk-taking.
    • Keep an eye on policy shifts, global cues, and fund movements that may impact market behavior.

    Ultimately, navigating March 2025 requires preparation and adaptability. In the stock market, history may rhyme, but it rarely repeats the same way.

  • KSB Ltd Q3 FY25 Results: Net Profit Rises 32.39% to Rs. 699 Million

    KSB Ltd Q3 FY25 Results: Net Profit Rises 32.39% to Rs. 699 Million

    KSB Ltd Q3 FY25 Results

    Parameter Q3 FY25 Q3 FY24 % Change
    Sales (Rs. Million) 7264.00 6026.00 20.54%
    Other Income (Rs. Million) 102.00 65.00 56.92%
    PBIDT (Rs. Million) 1086.00 874.00 24.26%
    Interest (Rs. Million) 4.00 16.00 -75.00%
    PBDT (Rs. Million) 1082.00 858.00 26.11%
    Depreciation (Rs. Million) 144.00 137.00 5.11%
    PBT (Rs. Million) 938.00 721.00 30.10%
    TAX (Rs. Million) 239.00 193.00 23.83%
    Deferred Tax (Rs. Million) -11.00 -5.00 120.00%
    PAT (Rs. Million) 699.00 528.00 32.39%
    Equity (Rs. Million) 348.00 348.00 0.00%
    PBIDTM (%) 14.95% 14.50% 3.08%

    KSB Ltd delivered a strong financial performance in the third quarter of FY25. The company reported a 20.54% increase in sales, reaching Rs. 7,264 million compared to Rs. 6,026 million in the same quarter last year. This growth reflects the company’s ability to capture market demand effectively.

    KSB Ltd’s other income rose by 56.92%, totaling Rs. 102 million against Rs. 65 million in the previous year’s corresponding quarter. This significant increase in other income contributed to the overall growth in profitability.

    The Profit Before Interest, Depreciation, and Tax (PBIDT) climbed by 24.26% to Rs. 1,086 million from Rs. 874 million. This rise indicates efficient cost management and better operational performance. The company reduced its interest expenses by 75%, bringing it down to Rs. 4 million from Rs. 16 million.

    The Profit Before Depreciation and Tax (PBDT) increased by 26.11% to Rs. 1,082 million, compared to Rs. 858 million in the corresponding quarter of the previous year. This growth highlights the company’s solid operational capabilities and cost efficiency.

    KSB Ltd recorded a 5.11% increase in depreciation expenses, which stood at Rs. 144 million compared to Rs. 137 million. Despite the rise in depreciation, the Profit Before Tax (PBT) surged by 30.10%, reaching Rs. 938 million from Rs. 721 million.

    The company’s tax expenses increased by 23.83% to Rs. 239 million from Rs. 193 million. KSB Ltd reported a deferred tax benefit of Rs. 11 million, which improved from Rs. 5 million in the same quarter last year.

    KSB Ltd’s Profit After Tax (PAT) grew by 32.39% to Rs. 699 million from Rs. 528 million. This increase reflects the company’s strong revenue growth and improved cost efficiency. The equity remained unchanged at Rs. 348 million.

    The company’s Profit Before Interest, Depreciation, and Tax Margin (PBIDT Margin) improved slightly to 14.95%, compared to 14.50% in the previous year. This rise demonstrates the company’s ability to maintain profitability despite increased expenses.

    Overall, KSB Ltd delivered a robust financial performance in Q3 FY25, driven by strong sales growth, better operational efficiency, and a significant increase in net profit.

    Disclaimer: This blog is for informational purposes only and should not be considered as financial advice or any buy/sell recommendations.

  • Sylph Technologies Q3 FY25 Results: Net Loss Rises by 102.09%, Sales Drop to Zero

    Sylph Technologies Q3 FY25 Results: Net Loss Rises by 102.09%, Sales Drop to Zero

    Sylph Technologies Ltd Q3 FY25 Results

    Metric Q3 FY25 Q3 FY24 % Change
    Sales (Rs. Million) 0.00 86.29 -100%
    Other Income (Rs. Million) 0.22 0.98 -77.55%
    PBIDT (Rs. Million) -17.17 -6.10 -181.48%
    Tax (Rs. Million) -1.73 1.54 -212.34%
    PAT (Rs. Million) -15.44 -7.64 -102.09%
    Equity (Rs. Million) 857.60 159.50 437.68%
    PBIDT Margin (%) 0.00% -7.07%

    Sylph Technologies Ltd released its Q3 FY25 financial results, showing significant changes across multiple financial metrics.

    Sales and Other Income

    The company reported zero sales for the quarter, marking a 100% decline compared to Rs. 86.29 million in Q3 FY24. Other income also dropped by 77.55%, falling to Rs. 0.22 million from Rs. 0.98 million in the same period last year. Year-to-date other income increased by 149.84%, reaching Rs. 7.72 million from Rs. 3.09 million in FY24.

    Profitability Metrics

    Sylph Technologies Ltd’s Profit Before Interest, Depreciation, and Tax (PBIDT) fell sharply. The company reported a loss of Rs. 17.17 million, which reflects a 181.48% increase in losses compared to a Rs. 6.10 million loss in Q3 FY24. On a year-to-date basis, PBIDT stood at Rs. -10.52 million, reflecting a 101.92% decline compared to Rs. -5.21 million last year.

    The company incurred zero interest expenses during the quarter, similar to Q3 FY24. Profit Before Depreciation and Tax (PBDT) also reflected the same Rs. -17.17 million loss, marking a 181.48% rise in losses from the previous year’s figure of Rs. -6.10 million.

    Tax and Net Profit

    Sylph Technologies Ltd reported a tax expense of Rs. -1.73 million, a significant drop from Rs. 1.54 million last year, reflecting a -212.34% change. The net profit (PAT) decreased by 102.09%, with the company reporting a loss of Rs. -15.44 million, compared to Rs. -7.64 million in Q3 FY24.

    Year-to-date net profit stood at Rs. -10.52 million, showing a 50.72% decrease from Rs. -6.98 million in the previous financial year.

    Equity and Margins

    The company increased its equity significantly to Rs. 857.60 million, reflecting a 437.68% rise compared to Rs. 159.50 million in Q3 FY24. PBIDT margins also took a hit, reporting 0.00% for this quarter compared to -7.07% in the same period last year.

    Final Thoughts

    Sylph Technologies Ltd experienced zero sales, significant losses in PBIDT and PAT, and a substantial increase in equity. Despite growth in year-to-date other income, the company’s core profitability remains under pressure due to rising expenses and falling revenues.

    Disclaimer: This blog is for informational purposes only and should not be considered as financial advice or any buy/sell recommendations.

  • Sanofi India Ltd Q3 FY25: Net Profit Rises 30.99%, Sales Up 9.74%

    Sanofi India Ltd Q3 FY25: Net Profit Rises 30.99%, Sales Up 9.74%

    Sanofi India Ltd Q3 FY25 Results

    Metric Q3 FY25 (Rs. Million) Q3 FY24 (Rs. Million) % Change
    Sales 5,149 4,692 9.74%
    Other Income 59 94 -37.23%
    PBIDT 1,242 1,090 13.94%
    PBT 1,222 993 23.06%
    PAT 913 697 30.99%

    Sanofi India Ltd reported a solid financial performance for Q3 FY25. The company’s net profit increased by 30.99% to Rs. 913 million, compared to Rs. 697 million in the same quarter last year. The company’s sales also grew by 9.74%, reaching Rs. 5,149 million, up from Rs. 4,692 million in Q3 FY24.

    The company’s other income decreased by 37.23% to Rs. 59 million, compared to Rs. 94 million in the previous year’s quarter. Despite the decline in other income, the profit before interest, depreciation, and tax (PBIDT) rose by 13.94%, reaching Rs. 1,242 million from Rs. 1,090 million.

    Sanofi India Ltd maintained a steady interest expense of Rs. 4 million, showing no change from the previous year’s quarter. The company’s profit before depreciation and tax (PBDT) increased by 21.36% to Rs. 1,318 million, compared to Rs. 1,086 million in Q3 FY24.

    Depreciation costs rose slightly by 3.23% to Rs. 96 million, up from Rs. 93 million. The profit before tax (PBT) stood at Rs. 1,222 million, marking a 23.06% increase compared to Rs. 993 million in the same quarter of the previous year.

    The company paid Rs. 309 million in taxes, reflecting a 4.39% increase from Rs. 296 million last year. Deferred tax increased by 20%, reaching Rs. 30 million from Rs. 25 million.

    Sanofi India Ltd maintained its equity base at Rs. 230 million, showing no changes from the previous quarter. The PBIDT margin improved to 24.12%, reflecting a 3.83% increase from 23.23% last year.

    The company’s year-to-date figures also showed a modest increase in sales by 0.86% to Rs. 20,132 million. However, other income declined sharply by 73.04% to Rs. 165 million. Despite this, the profit after tax (PAT) increased by 30.99% to Rs. 3,137 million, up from Rs. 2,397 million.

    Sanofi India Ltd’s strong Q3 FY25 performance reflects its ability to maintain growth in core operations while managing costs effectively. The steady rise in net profit and sales highlights the company’s solid market position and efficient operational strategy.

    Disclaimer: This blog is for informational purposes only and should not be considered as financial advice or any buy/sell recommendations.

  • Schaeffler India Q3 FY25 Results: Net Profit Rises 14.7% to Rs. 2,493.30 Million

    Schaeffler India Q3 FY25 Results: Net Profit Rises 14.7% to Rs. 2,493.30 Million

    Schaeffler India Ltd Q3 FY25 Results

    Metric Q3 FY25 (Rs. Million) Q3 FY24 (Rs. Million) % Change
    Sales 20,823.10 18,550.70 12.25%
    Other Income 365.10 305.00 19.70%
    PBIDT 4,141.40 3,585.90 15.49%
    Interest 6.10 9.80 -37.76%
    PBT 3,387.30 2,958.20 14.51%
    TAX 894.00 784.40 13.97%
    PAT 2,493.30 2,173.80 14.70%
    PBIDT Margin (%) 19.89% 19.33% 2.89%

    Schaeffler India Ltd delivered a solid performance in Q3 FY25, showcasing growth across key financial metrics. The company increased its sales by 12.25% year-on-year, reaching Rs. 20,823.10 million compared to Rs. 18,550.70 million in Q3 FY24. This rise reflects higher demand and better market conditions.

    The company’s other income grew by 19.70%, totaling Rs. 365.10 million compared to Rs. 305.00 million in the same quarter last year. This increase in additional revenue streams contributed positively to the overall performance.

    Schaeffler India Ltd boosted its Profit Before Interest, Depreciation, and Tax (PBIDT) by 15.49%, reporting Rs. 4,141.40 million against Rs. 3,585.90 million in Q3 FY24. Lower interest expenses, which dropped by 37.76% to Rs. 6.10 million from Rs. 9.80 million, further strengthened the company’s financial position.

    The Profit Before Depreciation and Tax (PBDT) increased by 17.18%, reaching Rs. 4,135.30 million, up from Rs. 3,529.10 million in the previous year. The company’s depreciation expenses rose by 31.02%, totaling Rs. 748.00 million compared to Rs. 570.90 million, reflecting investments in infrastructure and technology.

    Schaeffler India Ltd improved its Profit Before Tax (PBT) by 14.51%, reaching Rs. 3,387.30 million compared to Rs. 2,958.20 million in Q3 FY24. Tax expenses increased by 13.97% to Rs. 894.00 million from Rs. 784.40 million, aligned with the higher profit.

    Despite a deferred tax liability of Rs. 16.90 million, which reversed from a credit of Rs. -15.20 million last year, the company increased its Profit After Tax (PAT) by 14.70%. PAT stood at Rs. 2,493.30 million, up from Rs. 2,173.80 million in the previous quarter.

    The company’s PBIDT margin improved slightly to 19.89% from 19.33%, reflecting better operational efficiency and cost management.

    Schaeffler India Ltd continues to focus on growth and operational excellence, as reflected in these robust Q3 FY25 financial results. With strong sales performance and effective cost control, the company is well-positioned to maintain its growth trajectory in the coming quarters.

    Disclaimer: This blog is for informational purposes only and should not be considered as financial advice or any buy/sell recommendations.

  • Enkei Wheels (India) Ltd Q3 FY25 Results: Net Loss of Rs. 29.67 Million

    Enkei Wheels (India) Ltd Q3 FY25 Results: Net Loss of Rs. 29.67 Million

    Enkei Wheels (India) Ltd Q3 FY25 Results

    Metric Q3 FY25 (202412) Q3 FY24 (202312) % Change
    Sales (Rs. Million) 1952.00 2002.47 -2.52%
    Other Income (Rs. Million) 53.67 -48.15 -211.46%
    PBIDT (Rs. Million) 132.13 161.67 -18.27%
    Interest (Rs. Million) 37.45 28.52 31.31%
    PBDT (Rs. Million) 94.68 133.15 -28.89%
    Depreciation (Rs. Million) 131.60 123.90 6.21%
    PBT (Rs. Million) -36.92 9.25 -499.14%
    TAX (Rs. Million) -7.25 -11.85 -38.82%
    Deferred Tax (Rs. Million) 0.00 -11.85 -100.00%
    PAT (Rs. Million) -29.67 21.10 -240.62%
    Equity (Rs. Million) 89.87 89.87 0.00%
    PBIDTM (%) 6.77 8.07 -16.16%

    Enkei Wheels (India) Ltd recently released its Q3 FY25 financial results, revealing both challenges and positive takeaways. The company reported a slight decline in sales but showed improvement in other areas like interest income and depreciation.

    Sales and Revenue Performance

    Enkei Wheels (India) Ltd reported sales of Rs. 1952 million in Q3 FY25, which shows a decrease of 2.52% compared to Rs. 2002.47 million in Q3 FY24. Despite the decline in sales, the company generated Rs. 53.67 million in other income, marking a significant turnaround from the negative Rs. 48.15 million recorded in the previous year.

    Profitability Metrics

    The company’s Profit Before Interest, Depreciation, and Tax (PBIDT) fell by 18.27%, reaching Rs. 132.13 million compared to Rs. 161.67 million in the same quarter last year. Interest costs increased by 31.31% to Rs. 37.45 million, indicating higher borrowing expenses during this period.

    Profit Before Depreciation and Tax (PBDT) stood at Rs. 94.68 million, marking a decrease of 28.89% from Rs. 133.15 million in Q3 FY24. Meanwhile, depreciation costs rose by 6.21% to Rs. 131.60 million, reflecting the company’s increased investment in fixed assets.

    Net Profit and Tax Impact

    The company reported a loss before tax (PBT) of Rs. 36.92 million, a significant drop from the profit of Rs. 9.25 million in the previous year. Tax expenses fell by 38.82% to Rs. 7.25 million. Deferred tax expenses dropped sharply to zero from Rs. 11.85 million, which positively impacted the overall tax burden.

    As a result, the company recorded a net loss (PAT) of Rs. 29.67 million, compared to a profit of Rs. 21.10 million in Q3 FY24. This translates to a decline of 240.62% in net profit.

    Operational Efficiency

    The PBIDT margin dropped by 16.16%, settling at 6.77% compared to 8.07% in the previous year. Despite operational challenges, the company’s equity capital remained unchanged at Rs. 89.87 million.

    Year-to-Date and Year-End Summary

    For the year-to-date period, sales increased by 17.92% to Rs. 8444.63 million from Rs. 7161.37 million. Interest expenses rose by 31.04% to Rs. 140.16 million. The profit before tax for the year decreased by 86.11% to Rs. 22.30 million. Net profit for the year declined by 77.29% to Rs. 26.56 million.

    Final Thoughts

    Enkei Wheels (India) Ltd continues to navigate through a challenging financial landscape. While the increase in sales and reduction in deferred tax provide positive signals, the rising interest costs and declining profitability indicate areas requiring strategic focus.

    Disclaimer: This blog is for informational purposes only and should not be considered as financial advice or any buy/sell recommendations.

  • DIC India Ltd Q3 FY25 Results: Net Profit Up 199.50%, Revenue Rises 6.87%

    DIC India Ltd Q3 FY25 Results: Net Profit Up 199.50%, Revenue Rises 6.87%

    DIC India Ltd Q3 FY25 Financial Results

    Metric Q3 FY25 (Rs. Million) Q3 FY24 (Rs. Million) Change (%)
    Sales 2192.16 2051.26 6.87
    Other Income 47.02 24.75 89.98
    PBIDT 141.07 29.20 383.12
    Interest 7.39 5.42 36.35
    Depreciation 47.41 46.01 3.04
    PBT 93.19 -81.90 213.79
    TAX 21.71 -10.06 315.81
    PAT 71.48 -71.84 199.50
    PBIDT Margin (%) 6.44 1.42 352.07

    DIC India Ltd reported robust growth in its financial performance for the third quarter of FY25. The company’s revenue and profit figures showed significant improvement compared to the same period last year.

    Revenue Growth

    DIC India Ltd’s revenue rose by 6.87% to Rs. 2192.16 million in Q3 FY25 from Rs. 2051.26 million in Q3 FY24. The company’s other income increased by 89.98%, reaching Rs. 47.02 million compared to Rs. 24.75 million in the same quarter last year.

    Operating Profit Surge

    The company reported a substantial rise in Profit Before Interest, Depreciation, and Tax (PBIDT). It grew by 383.12%, reaching Rs. 141.07 million in Q3 FY25, compared to Rs. 29.20 million in Q3 FY24. The PBIDT margin improved to 6.44%, marking a 352.07% increase from 1.42% last year.

    Interest and Depreciation

    DIC India Ltd’s interest costs increased by 36.35%, rising to Rs. 7.39 million from Rs. 5.42 million. Depreciation expenses also rose slightly by 3.04%, amounting to Rs. 47.41 million compared to Rs. 46.01 million in the corresponding period last year.

    Profit Before Tax (PBT) and Net Profit (PAT)

    The company turned around its performance by reporting a Rs. 93.19 million Profit Before Tax (PBT) compared to a loss of Rs. 81.90 million in the same quarter last year. This improvement reflects a 213.79% rise. DIC India Ltd’s Profit After Tax (PAT) reached Rs. 71.48 million, showing a dramatic improvement of 199.50% compared to a loss of Rs. 71.84 million in Q3 FY24.

    Year-to-Date Performance

    For the nine months ending December 2024, DIC India Ltd’s revenue increased by 6.36% to Rs. 8815.29 million from Rs. 8288.51 million. The company’s PBIDT surged by 156.83% to Rs. 459.96 million. PAT improved significantly to Rs. 195.39 million, compared to a loss of Rs. 226.75 million during the same period in FY24.

    Final Thoughts

    DIC India Ltd’s strong performance reflects effective cost management, higher operational efficiency, and revenue growth across its segments. The company continues to focus on strengthening its market position and delivering value to its stakeholders.

    Disclaimer: This blog is for informational purposes only and should not be considered as financial advice or any buy/sell recommendations.