findocblog

Category: Stock Market

  • What’s behind the growing disconnect between the Bank Nifty Index and reality?

    What’s behind the growing disconnect between the Bank Nifty Index and reality?

    The Nifty Bank index has been one of the standout performers in the Indian equity landscape. Despite a broadly cautious macroeconomic backdrop, it has outshone not just the benchmark Nifty 50 but also most sectoral indices across both short and medium-term horizons.

    Yet, as bank stock valuations climb higher, the underlying fundamentals and management commentary paint a far more cautious picture. This raises an important question: Is the Bank Nifty rally running ahead of the actual banking sector outlook?

    Let’s examine the disconnect.

    Earnings Are Stable, But Not Spectacular

    The recently reported March quarter results (FY25) for major banks showed stable performance but offered little by way of upside surprises. There were no clear outliers in terms of credit growth, margins, or asset quality. While management expressed satisfaction with performance, few signaled any meaningful acceleration in loan or deposit growth.

    In fact, large institutions refrained from providing forward guidance for FY26. Their collective tone was one of guarded optimism, tempered by concerns about global trade tensions, domestic geopolitical risks, and lackluster industrial credit demand.

    Muted Credit Growth Expectations

    A key area of divergence is the retail lending segment. While analysts on the Street anticipate a robust 15–18% growth in FY26, many bank executives privately forecast much lower figures. This caution is driven by concerns around borrower quality, especially in the unsecured personal loan segment that saw regulatory tightening in late 2023.

    On the corporate side, loan growth remains modest, with many banks indicating that big-ticket demand from India Inc. continues to be sluggish. As a result, nearly half the loan book across many banks is expected to grow at just single-digit or low double-digit rates in the coming year.

    Legacy Headwinds Are Still Unwinding

    The recent rally in banking stocks can be partly attributed to a period of underperformance between mid-2022 and 2024. During that phase, operational resets and strategic shifts weighed on earnings and stock returns. Now that this reset appears complete, investors seem to be factoring in a clean slate and a return to normalized growth—perhaps prematurely.

    Index Composition Skews the Perception

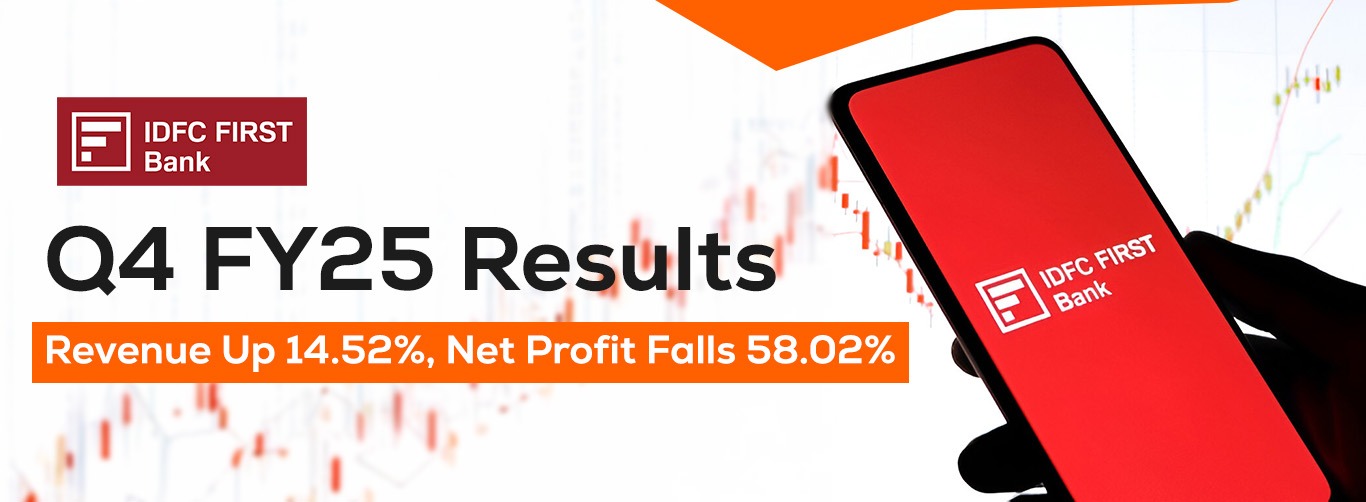
    The Nifty Bank Index, comprising a select few large-cap banks, is heavily weighted towards names that have stronger balance sheets and better investor confidence. Even when some banks underperform, like Kotak Mahindra recently, which dropped nearly 5%—the overall index may hold up due to gains in others such as IDFC First or Federal Bank.

    This creates a perception of sector-wide strength, even when performance is uneven across constituents.

    A Case of Valuations Running Ahead of Fundamentals?

    The price-to-earnings ratio of the index remains attractive by historical standards, but earnings upgrades have been limited. If growth in credit and margins stays muted, the risk of a valuation mismatch increases—particularly if macro conditions remain uncertain.

    What Should Investors Watch For?

    The disconnect between the Nifty Bank index and on-ground realities may persist in the short term. However, a few developments could act as catalysts or corrections:

    • Clear improvement in corporate credit demand
    • Signs of stabilization in unsecured retail credit quality
    • Continued regulatory easing or supportive monetary policy
    • Actual FY26 guidance from banks that matches market expectations

    Conclusion

    While the Nifty Bank index reflects investor optimism, it may not fully capture the cautious stance of the institutions it represents. For now, the rally is being driven more by sentiment and expectations than by a confirmed growth resurgence.

    Investors would do well to temper their enthusiasm and keep an eye on fundamentals. After all, when it comes to banking stocks, reality eventually catches up with valuations.

    Disclaimer: This article is for informational purposes only and should not be considered as investment advice.

  • Alan Scott Industries Announces ₹7.26 Crore Rights Issue at ₹40

    Alan Scott Industries Announces ₹7.26 Crore Rights Issue at ₹40

    Mumbai based Alan Scott Industries Ltd has announced a rights issue to raise approximately ₹7.26 crore by offering equity shares to its existing shareholders. The move comes as part of the company’s effort to bolster its capital base and support ongoing business initiatives. The record date for determining shareholder eligibility for the issue has been set as May 2, 2025, while the issue will open for subscription on May 15 and close on May 29.

    Rights Issue Details

    Under the offer, Alan Scott Industries will issue 18,15,863 equity shares at a price of ₹40 per share, carrying a face value of ₹10. The rights entitlement has been fixed in the ratio of 1:2, meaning shareholders will be eligible to subscribe to one rights share for every two fully paid-up shares held on the record date.

    Trading of Rights Entitlements (REs) will be permitted on the stock exchange from May 15 to May 23, allowing eligible shareholders the flexibility to sell or acquire additional entitlements. REs not subscribed to or sold during this period will lapse without value.

    Application Process

    Shareholders can apply for the rights shares through multiple channels:

    • Online ASBA (Applications Supported by Blocked Amount), available via most banks’ net banking platforms.
    • R-WAP (Registrar’s Web-Based Application Platform), hosted by Purva Sharegistry India Pvt Ltd.
    • Offline ASBA, by submitting a physical form at designated SCSB (Self-Certified Syndicate Bank) branches.

    The company has appointed Purva Sharegistry India Pvt Ltd as the registrar for the issue. Allotment status and application-related queries can be directed to the registrar via phone or their official website.

    About the Company

    Founded in 1994, Alan Scott Industries Ltd started its journey in the knitwear business before expanding into media, advertising, and ultimately establishing a stronghold in the health and hygiene sector. Today, the company is known for offering products such as air purifiers, oxygen concentrators, and UV light disinfectants, aimed at both household and institutional markets.

    The company operates through a multi-vertical model, with active subsidiaries in retail, health & hygiene, and technology. A core part of its strategy involves developing retail stores that showcase lifestyle and fashion brands powered by nanotechnology and advanced hygiene solutions.

    Financial Overview

    Alan Scott Industries has faced financial headwinds in recent years. According to the company’s financial disclosures:

    Fiscal Year Revenue (₹ Cr) Expense (₹ Cr) Profit/(Loss) After Tax (₹ Cr)
    2022 1.78 1.81 0.02
    2023 0.53 1.57 (1.04)
    2024 0.41 1.37 (0.96)

    While revenue has shown a decline, the management hopes that this rights issue will provide the necessary capital infusion to drive growth and operational efficiency.

    What This Means for Investors

    The rights issue is priced at a significant discount compared to current market levels, offering existing shareholders an opportunity to increase their stake at a lower cost. However, the company’s recent financial performance may prompt investors to assess their long-term conviction in the business before participating.

    With a focus on innovation and expansion into high-demand sectors like healthcare and hygiene, Alan Scott Industries aims to revitalize its growth trajectory. The funds raised through the rights issue could play a pivotal role in fueling its next phase of development.

    Key Dates to Remember:

    • Record Date: May 2, 2025
    • Last Date to Buy Shares (for RE eligibility): April 30, 2025
    • RE Trading Window: May 15 – May 23, 2025
    • Subscription Period: May 15 – May 29, 2025

    Looking Ahead

    This rights issue provides an opportunity for existing shareholders to increase their stake at a discounted price. It may also help the company improve liquidity and fund expansion plans in its key verticals. Investors should assess their portfolio goals and consider the company’s long-term prospects before participating.

    Are you an Alan Scott Industries shareholder? Let us know if you’re planning to subscribe in the comments below.

    Disclaimer: This article is for informational purposes only and should not be considered as investment advice.

  • The Great Rebound: What’s Fueling India’s $489 Billion Market Comeback?

    The Great Rebound: What’s Fueling India’s $489 Billion Market Comeback?

    After months of caution and capital flight, global investors are making a strong return to Indian equities. The Indian stock market has added nearly $489 billion in market capitalization in just over a month, rekindling foreign interest and pushing the Nifty 50 Index to outperform broader Asian benchmarks.

    So, what’s behind this massive rally? And is this the beginning of a sustained uptrend for Dalal Street? Let’s break it down.

    Global Funds Re-Enter the Fray

    Foreign Portfolio Investors (FPIs), who had been net sellers since September, have made a dramatic U-turn in April. In just the last nine trading sessions, FPIs have pumped over $4.1 billion into Indian equities—one of the strongest inflow streaks since July 2023. On April 24 alone, overseas investors added $345 million to their positions.

    This influx is reversing the trend that saw a $26 billion foreign exodus between September and February. Analysts attribute the renewed confidence to India’s domestic economic strength and resilience to global trade uncertainties.

    Tailwinds Supporting the Rally

    India’s $489 billion equity rally isn’t riding on foreign money alone. A mix of supportive domestic and international factors has buoyed market sentiment:

    • Monetary Easing: The Reserve Bank of India’s recent rate cut and liquidity infusion measures wiped out the long-standing cash deficit in the banking system.
    • Oil Prices and Inflation: Moderating crude prices and tame inflation have reinforced India’s appeal as a stable investment destination.
    • Trade Optimism: U.S. Treasury Secretary Scott Bessent’s comments hinting at an imminent trade deal with India have added a layer of optimism to the market.
    • Domestic Demand Story: Unlike many emerging markets, India is less dependent on exports. This internal demand strength has drawn funds to sectors like financials, consumer staples, defence, and healthcare.

    Market Macros

    • Nifty 50 has gained over 6.6% this April, far outpacing the MSCI Asia Pacific Index.
    • Broader indices like midcaps and smallcaps have risen 1.1% and 1.3%, respectively.
    • Currency Strength: The Indian rupee closed at 85.03 per USD—its best in two weeks—supported by equity inflows and easing geopolitical tensions.
    • Sectoral Leaders: Domestically oriented sectors—such as financials, consumer goods, and manufacturing—saw gains ranging from 2.5% to 11% since late March, reflecting renewed investor confidence in the country’s internal growth drivers.

    Investment Outlook

    India’s equity resurgence is undoubtedly attracting global capital. But smart investors know rallies bring both opportunities and risks. Expensive valuations and potential earnings downgrades could act as speed bumps. Yet, the broader narrative remains constructive:

    • Strong macro fundamentals
    • Domestic demand-led resilience
    • Regulatory and monetary support
    • Growing foreign confidence

    Going forward, investor focus should be on high-quality sectors with earnings visibility—financials, consumer staples, defence, and healthcare. Any short-term dips, particularly due to geopolitical developments, may offer compelling entry points for long-term investors.

    Conclusion

    Dalal Street’s $489 billion rebound marks more than just a rally—it signals a revival of global investor faith in India’s structural growth story. While vigilance is warranted amid valuations and regional risks, the tide appears to be turning decisively in India’s favour. For investors willing to ride short-term volatility, the road ahead could be rewarding.

    Disclaimer: This article is for informational purposes only and should not be considered as investment advice.

  • RBI’s ₹1.25 Lakh Cr Bond Buy: Hidden Rate Cut or Tactical Liquidity Play?

    RBI’s ₹1.25 Lakh Cr Bond Buy: Hidden Rate Cut or Tactical Liquidity Play?

    The Reserve Bank of India (RBI) has been making bold moves in 2025, but its recent decision to buy government bonds worth ₹1.25 lakh crore in May has sparked a bigger question in financial circles: Is the central bank engineering a stealth rate cut without actually changing the policy repo rate?

    Let’s break it down.

    Injecting Liquidity Without Cutting Rates

    When a central bank buys bonds in the secondary market, it pays cash to the sellers (usually banks), injecting liquidity into the banking system. With more liquidity in the system, the cost of overnight borrowing between banks comes down. That’s exactly what the RBI seems to be targeting.

    Currently, the RBI’s policy repo rate stands at 6.00%. But due to the ongoing bond buying program, the effective cost of overnight funds in the interbank market has dropped significantly. As of April 29, the weighted average call money rate was 5.93%, and analysts expect it to fall further to the Standing Deposit Facility (SDF) rate of 5.75%.

    In simpler terms, the RBI is keeping borrowing costs lower through liquidity, even though the headline policy rate remains unchanged. Many analysts call this a “de facto” rate cut.

    RBI Governor’s Liquidity Strategy

    Under Governor Sanjay Malhotra, who assumed office in December 2024, the RBI has aggressively pumped liquidity into the banking system. Here’s a snapshot of the liquidity infusion so far:

    • ₹2.83 lakh crore in January-March 2025
    • ₹1.20 lakh crore in April 2025
    • ₹1.25 lakh crore planned for May 2025

    This adds up to nearly ₹5.28 lakh crore in just five months. The Governor had previously stated that the RBI aims to maintain a liquidity surplus of around 1% of total bank deposits, translating to approximately ₹2.30-₹2.50 lakh crore in durable liquidity.

    Market Reaction

    The bond market reacted swiftly to the latest announcement. The yield on the 10-year benchmark government bond, which had touched 6.40% a day prior, fell to 6.32% after the May bond purchase plan was revealed. Lower yields reflect market expectations of softer borrowing costs in the near term.

    Why This Strategy Matters

    There have already been two policy rate cuts in 2025, but their transmission to the broader economy has been slower than expected. By increasing liquidity through bond purchases, the RBI is ensuring that these rate cuts reach the real economy faster. Cheaper interbank borrowing means lower lending rates for businesses and consumers, boosting credit and economic activity.

    This approach also provides the central bank flexibility. Instead of committing to more formal rate cuts (which could stoke inflation or spook foreign investors), the RBI can subtly influence short-term rates and maintain broader macroeconomic stability.

    Here’s a quick look at the liquidity tools deployed by the RBI since January 2025:

    Tool Month Amount (in billion ₹)
    Secondary Market Bond Buys Jan 388.25
    OMO (Open Market Operations) Jan 200.2
    6-month FX Swap Feb 445
    OMO Feb 800
    OMO Mar 1445.41
    3-year FX Swap Mar 1735 (870+865)
    OMO Apr 1200
    Planned OMO May 1250

    This shows a consistent and strategic effort to maintain surplus liquidity using a mix of bond purchases and forex swaps.

    Conclusion

    The RBI is clearly walking a fine line. On one hand, it is not overtly loosening policy through explicit repo rate cuts. On the other, it is delivering the same effect through targeted bond buying and liquidity infusions.

    This hybrid approach allows the RBI to stimulate credit growth and economic momentum without sending overtly dovish signals to global markets.

    Analysts believe that if inflation stays under control and external conditions remain stable, this strategy could work well in rebooting India’s economic engine.

    So yes, RBI’s big bond buy does look like a secret rate cut. And markets are already acting like it is one.

    Disclaimer: This article is for informational purposes only and should not be considered as investment advice.

  • Utkarsh Small Finance Bank Q4 FY25: Profit Declines to ₹29.67 Million

    Utkarsh Small Finance Bank Q4 FY25: Profit Declines to ₹29.67 Million

    Utkarsh Small Finance Bank Ltd reported its Q4 FY25 results, showing a slight dip in revenue but a sharp decline in profitability. The bank’s interest earned for the quarter ended March 2025 stood at ₹8,796.23 million, down 1.79% from ₹8,956.20 million in the same quarter last year.

    However, the bank saw a significant jump in other income, which rose 137.90% to ₹2,871.10 million from ₹1,206.85 million year-on-year. Despite the increase in income from non-interest sources, the bank’s profit after tax (PAT) dropped massively by 98.14% to ₹29.67 million compared to ₹1,596.56 million in Q4 FY24.

    Utkarsh Small Finance Bank Financial Statement of Q4 Fy2025

    Parameter Q4 FY25 (202503) Q4 FY24 (202403) % Change
    Interest Earned 8796.23 8956.20 -1.79%
    Other Income 2871.10 1206.85 137.90%
    Interest Expended 4682.15 3556.73 31.64%
    Operating Expenses 4645.42 4645.42 22.76%
    Operating Profit 0.00 0.00 0.00%
    Provisions & Contingencies 2226.99 738.69 201.48%
    Tax 83.10 486.90 -82.93%
    PAT 29.67 1596.56 -98.14%
    OPM (%) 26.60 31.51 -15.59%

    Rising Expenses and Provisions Hurt Profitability

    Interest expenditure surged by 31.64% to ₹4,682.15 million from ₹3,556.73 million. Operating expenses remained flat quarter-on-quarter at ₹4,645.42 million, but provisioning and contingencies saw a massive jump of 201.48% to ₹2,226.99 million, up from ₹738.69 million.

    Tax expenses also dropped significantly by 82.93%, coming in at ₹83.10 million compared to ₹486.90 million in Q4 FY24.

    Operating Profit at Zero

    For Q4 FY25, the bank reported zero operating profit. Despite having increased income sources, higher interest costs, rising provisions, and flat operational costs left no room for operating margins. This reflects in the operating profit margin (OPM), which fell to 26.60% from 31.51% in Q4 FY24.

    Yearly Performance Also Affected

    For the full year ended March 2025, the bank’s PAT stood at ₹237.07 million, a drop of 95.24% compared to ₹4,976.28 million in FY24. On the other hand, interest earned grew by 18.45% to ₹37,649.26 million, and other income surged 49.83% to ₹5,998.34 million. However, these gains were offset by a 34.77% rise in interest expended and a 189.83% increase in provisions.

    Final Thoughts

    Utkarsh Small Finance Bank’s Q4 FY25 results reflect rising costs and provisioning pressures despite stable revenue. The steep fall in net profit indicates challenges in maintaining profitability in the face of increasing expenses and credit risk. Going forward, investors should watch the bank’s provisioning trends and asset quality closely.

    Disclaimer: This blog is for informational purposes only and should not be considered as financial advice or any buy/sell recommendations.

  • DMart Q4 Financial Results 2025: Revenue Up 16.69%, Net Profit Steady

    DMart Q4 Financial Results 2025: Revenue Up 16.69%, Net Profit Steady

    Avenue Supermarts Ltd, the parent company of DMart, posted its financial results for the fourth quarter ending March 2025 (Q4 FY25), showing moderate growth in revenue and profitability. The company registered a 16.69% rise in revenue, reaching ₹1,44,623.90 million compared to ₹1,23,934.60 million in Q4 FY24.

    Dmart Financial Statements Q4 2025

    Metric Q4 FY25 (202503) Q4 FY24 (202403) % Change YoY
    Sales 144623.90 123934.60 16.69%
    Other Income 391.30 522.00 -25.04%
    PBIDT 10205.30 9924.20 2.83%
    Interest 159.90 105.30 51.85%
    PBDT 10045.40 9818.90 2.31%
    Depreciation 2160.20 1780.80 21.31%
    PBT 7885.20 8038.10 -1.90%
    TAX 1688.10 1996.10 -15.43%
    Deferred Tax 66.50 16.50 303.03%
    PAT 6197.10 6042.00 2.57%
    Equity 6507.30 6507.30 0.00%
    PBIDTM(%) 7.06% 8.01% -11.88%

    Key Highlights

    • Sales Growth: The total sales rose to ₹1,44,623.90 million in Q4 FY25, reflecting a healthy year-on-year growth of 16.69%.

    • Operating Profit (PBIDT): Operating profit showed a modest increase of 2.83% to ₹10,205.30 million from ₹9,924.20 million in the same quarter last year.

    • Net Profit (PAT): The net profit grew by 2.57% to ₹6,197.10 million from ₹6,042.00 million in Q4 FY24.

    • Interest Costs: Interest expenses rose significantly by 51.85% to ₹159.90 million.

    • Depreciation Costs: Depreciation increased by 21.31%, reaching ₹2,160.20 million.

    • Profit Before Tax (PBT): The company reported a slight dip in PBT by 1.90%, ending at ₹7,885.20 million.

    • PBIDT Margin: The PBIDT margin dropped slightly to 7.06% in Q4 FY25 from 8.01% in Q4 FY24.

    Despite the growth in revenue, bottom-line expansion remained subdued due to higher depreciation, increased interest costs, and lower other income (down by 25.04%).

    Year-to-Date and Annual Performance

    For the full year FY25, Avenue Supermarts posted annual revenue of ₹5,77,898.10 million, reflecting a 16.67% growth compared to the previous year. Net profit for the full year stood at ₹29,271.80 million, showing a 8.62% growth over FY24.

    The company’s operating efficiencies remain robust, and it has maintained steady equity of ₹6,507.30 million. However, the drop in margins suggests rising costs are impacting profitability.

    Disclaimer: This blog is for informational purposes only and should not be considered as financial advice or any buy/sell recommendations.

  • Manorama Industries Q4 FY25 Results: Net Profit Surges 238% YoY to ₹422.67 Million

    Manorama Industries Q4 FY25 Results: Net Profit Surges 238% YoY to ₹422.67 Million

    Manorama Industries Ltd has posted impressive results for the quarter ending March 2025, showcasing substantial growth in both revenue and profit. The company’s remarkable performance reflects its operational efficiency, strong market demand, and strategic management decisions.

    Key Highlights

    Manorama Industries delivered a strong financial performance in Q4 FY25, with remarkable growth in both topline and bottom-line numbers. Here’s a breakdown of the key financial metrics:

    Financial Performance Breakdown:

    • Sales: Increased by 80% year-on-year, reaching ₹2,328.06 million, compared to ₹1,293.35 million in Q4 FY24. The strong revenue growth signals robust demand and the company’s growing market presence.

    • Other Income: Saw a significant surge of 139.97%, growing to ₹90.59 million from ₹37.75 million in the same quarter last year. This increase provided a solid boost to the company’s operating income.

    • PBIDT (Profit Before Interest, Depreciation, and Taxes): Soared by an impressive 197.21%, reaching ₹729.61 million compared to ₹245.49 million in Q4 FY24, demonstrating enhanced operating efficiency.

    • Interest Costs: Rose by 73.58% to ₹119.46 million, reflecting higher borrowing costs.

    • PBDT (Profit Before Depreciation and Tax): Increased by 245.36%, reaching ₹610.15 million from ₹176.67 million, reflecting improved operational performance.

    • Depreciation: Increased by 69.84%, reaching ₹63.98 million, slightly impacting overall profitability.

    • PBT (Profit Before Tax): Increased by a remarkable 292.93%, reaching ₹546.17 million from ₹139.00 million in Q4 FY24.

    • Tax Expense: Rose sharply by 785.30% to ₹123.50 million, reflecting the surge in profitability.

    • Net Profit (PAT): More than tripled, growing by 238.00% to ₹422.67 million from ₹125.05 million, driven by improved operating efficiency and strong revenue growth.

    Manorama Industries Q4 FY25 Financial Statement (₹ in Million)

    Parameter Q4 FY25 (₹ Million) Q4 FY24 (₹ Million) % Change YoY
    Sales 2328.06 1293.35 80.00%
    Other Income 90.59 37.75 139.97%
    PBIDT 729.61 245.49 197.21%
    PBDT 610.15 176.67 245.36%
    PBT 546.17 139.00 292.93%
    PAT 422.67 125.05 238.00%
    PBIDTM (%) 31.34% 18.98% 65.11%

    Year-to-Date (YTD) Performance: FY25 Overview

    Manorama Industries’ strong Q4 performance was mirrored throughout FY25, with steady growth across key financial metrics. The company’s full-year results reflect its operational efficiency and market leadership.

    Full-Year Financial Highlights:

    • Sales Growth (FY25): The company’s full-year sales were buoyed by Q4’s strong performance, driving the business forward in a competitive market environment.

    • Profit Growth: Despite rising interest and depreciation costs, Manorama Industries managed to increase profitability across the board, positioning itself for continued growth in the coming quarters.

    Profitability and Operational Efficiency

    Manorama Industries demonstrated significant improvements in its profitability metrics, thanks to better operating efficiency and strong revenue realization. The company’s profitability margins saw substantial growth, further highlighting the strength of its business operations.

    Key Profitability Metrics:

    • PBIDT Margin (PBIDTM%): Expanded to 31.34% in Q4 FY25, up from 18.98% in Q4 FY24, showing operational leverage and efficient cost management.

    • Net Profit Margin: The significant increase in net profit, coupled with the surge in other income and efficient cost control, led to a healthy improvement in overall margins.

    Analyst’s View: Impressive Growth and Strong Outlook

    Manorama Industries has demonstrated stellar growth in Q4 FY25, with key financial metrics reflecting exceptional operational efficiency and solid demand for its products. Key takeaways from the quarter include:

    Strengths:

    • Sales grew by a robust 80% year-on-year.
    • A significant surge in other income, boosting operating performance.
    • Exceptional growth in PBT and PAT, supported by improved margins.

    Challenges:

    • Rising interest and depreciation expenses slightly impacted profit margins, though overall profitability remained strong.

    Investor Insight:

    Manorama Industries continues to showcase impressive growth across revenue and profitability metrics. The company’s ability to control costs, expand margins, and improve operating efficiency has put it in a strong position for sustained growth moving forward.

    The Bottom Line

    Manorama Industries has delivered outstanding results for Q4 FY25, with strong revenue and profitability growth. The company’s impressive 238% increase in net profit underscores its operational efficiency and strategic focus. With a solid financial performance and a positive outlook, Manorama Industries is well-positioned for continued success.

    Disclaimer: This blog is for informational purposes only and should not be considered as financial advice or any buy/sell recommendations.

  • Ugro Capital Q4 FY25 Results: Net Profit Rises 24.04%, Sales Grow 25.05% YoY

    Ugro Capital Q4 FY25 Results: Net Profit Rises 24.04%, Sales Grow 25.05% YoY

    Ugro Capital Ltd announced its Q4 FY25 results, revealing strong growth across key financial metrics. The company has posted impressive figures, particularly in sales and net profit, indicating solid operational performance despite the challenging financial landscape.

    Key Highlights

    Ugro Capital demonstrated consistent growth in Q4 FY25, with a notable rise in both top-line and bottom-line performance. Below is the detailed breakdown of the company’s financial results:

    Financial Performance Breakdown:

    • Sales: Increased by 25.05% year-on-year to ₹4,031.76 million, compared to ₹3,224.08 million in Q4 FY24. This growth reflects the company’s expanding customer base and an increase in lending activities.

    • Net Profit (PAT): Rose by 24.04%, reaching ₹405.47 million from ₹326.88 million in the same quarter last year. The growth in profitability highlights Ugro Capital’s efficient cost management and its ability to perform well in a competitive market.

    • Operating Profit (PBIDT): Marginally improved by 29.73% to ₹2,516.58 million, compared to ₹1,939.87 million in Q4 FY24, showcasing strong operational efficiency.

    • Interest Expense: Increased by 41.41% to ₹1,812.13 million, up from ₹1,281.44 million last year, reflecting higher finance costs and their pressure on margins.

    • Depreciation Expense: Rose by 33.72% to ₹132.36 million from ₹98.98 million in Q4 FY24, impacting the overall profitability to some extent.

    • Profit Before Tax (PBT): Saw a modest increase of 2.26% to ₹572.09 million, up from ₹559.14 million in the previous year, despite the pressure from rising interest and depreciation costs.

    Ugro Capital Ltd Q4 FY25 Financial Statement (₹ in Million)

    Particulars Q4 FY25 (₹ Million) Q4 FY24 (₹ Million) % Change
    Sales 4031.76 3224.08 25.05%
    Other Income 92.62 79.84 16.01%
    PBIDT 2516.58 1939.87 29.73%
    Interest 1812.13 1281.44 41.41%
    PBDT 704.45 658.43 6.99%
    Depreciation 132.36 98.98 33.72%
    PBT 572.09 559.45 2.26%
    TAX 166.62 232.57 -28.36%
    PAT 405.47 326.88 24.04%

    Year-to-Date (YTD) Performance: FY25 Overview

    For the full fiscal year (FY25), Ugro Capital continued to demonstrate consistent growth, with a 33.20% increase in sales year-on-year, signaling strong business momentum.

    Full-Year Financial Highlights:

    • Sales Growth (FY25): Ugro Capital posted a 33.20% increase in sales for the full fiscal year, continuing its positive growth trajectory.

    • Profit Growth: The company managed to balance growth and efficiency, delivering stable returns despite the cost pressures seen in Q4.

    Profitability and Operational Efficiency

    Ugro Capital’s ability to maintain strong operational performance and profitability despite rising costs is a key highlight of its Q4 results. Here’s a detailed look at the company’s efficiency:

    Profitability Metrics:

    • PBIDTM (Profit Before Interest, Depreciation, and Tax Margin): Held steady at 62.42% in Q4 FY25, up slightly from 60.17% in the same period last year, indicating consistent operational efficiency and strong margin management.

    • Tax Expense: Declined by 28.36%, offering relief to the company’s bottom line and aiding the growth in net profit.

    • Deferred Tax: Dropped sharply by 71.13%, further contributing to the positive results for the quarter.

    Analyst’s View: Consistent Growth Amid Financial Pressures

    Ugro Capital’s Q4 FY25 results are a testament to the company’s robust growth strategy, even in a competitive market environment. Key insights from the quarter include:

    Strengths:

    • Strong sales growth of 25.05% year-on-year.
    • A healthy increase in operating profit and net profit.
    • Efficient cost control leading to stable margins.

    Challenges:

    • Rising interest and depreciation expenses putting pressure on profitability.
    • Modest increase in PBT, reflecting the impact of higher finance costs.

    Investor Insight:

    Ugro Capital has shown resilience in a challenging financial environment. The company’s ability to maintain stable margins and improve profitability despite rising costs suggests solid management and a promising outlook, provided it continues to optimize its operational expenses.

    The Bottom Line

    Ugro Capital’s Q4 FY25 results reflect consistent growth and strong operational performance, despite rising interest expenses and depreciation costs. The company has successfully balanced top-line growth with cost management, and its stable profit margins are a positive sign for the future. Going forward, Ugro Capital’s ability to control rising costs and maintain strong operational efficiency will be key to sustaining its growth momentum.

    Disclaimer: This blog is for informational purposes only and should not be considered as financial advice or any buy/sell recommendations.

  • Avantel Ltd Q4 FY25 Results: Net Profit Falls 43.77%, Revenue Up 17.81%

    Avantel Ltd Q4 FY25 Results: Net Profit Falls 43.77%, Revenue Up 17.81%

    Avantel Ltd announced its financial results for Q4 FY25, presenting a mixed performance across key financial metrics. While the company saw strong revenue growth, it struggled with declining profitability due to increased costs and higher interest expenses.

    Key Highlights

    The March 2025 quarter saw significant revenue growth, yet escalating costs affected the company’s bottom line, resulting in a sharp decline in net profit.

    Financial Performance Breakdown:

    • Revenue: Increased by 17.81% to ₹491.42 million, compared to ₹417.12 million in Q4 FY24, reflecting strong market demand and operational progress.

    • Net Profit (PAT): Declined by 43.77% to ₹73.57 million, down from ₹130.83 million in Q4 FY24. The drop in profitability was primarily driven by higher costs and interest expenses.

    • Operating Profit (PBIDT): Fell by 33.16% year-on-year to ₹130.27 million, indicating pressure on margins despite revenue growth.

    • Profit Before Depreciation and Tax (PBDT): Dropped by 35.52% to ₹123.72 million, down from ₹191.87 million in the previous year.

    • Interest Expenses: Increased significantly by 115.46% to ₹6.55 million, putting further strain on profitability.

    • Depreciation Charges: Rose by 18.31% to ₹28.04 million, contributing to the decline in operating profit.

    Avantel Ltd Q4 FY25 Financial Statement (₹ in Million)

    Particulars Q4 FY25 (₹ Million) Q4 FY24 (₹ Million) % Change
    Sales 491.42 417.12 +17.81%
    Other Income 4.76 4.60 +3.48%
    PBIDT 130.27 194.91 -33.16%
    Interest 6.55 3.04 +115.46%
    PBDT 123.72 191.87 -35.52%
    Depreciation 28.04 23.70 +18.31%
    PBT 95.68 168.17 -43.11%
    PAT 73.57 130.83 -43.77%

    Year-to-Date (YTD) Performance: FY25 Overview

    Looking at the full year (FY25), Avantel Ltd showed moderate improvement in overall sales, but net profit remained relatively flat, reflecting ongoing cost pressures.

    Full Year Financial Highlights:

    • Revenue: Increased by 10.97% year-on-year to ₹2,484.84 million.

    • Net Profit: Grew by 8.05% to ₹599.16 million, compared to ₹554.51 million in FY24, marking a slight improvement in profitability despite quarterly challenges.

    Profitability Under Pressure

    Despite solid revenue growth, Avantel Ltd’s profitability faced notable headwinds in Q4 FY25 due to rising expenses. Here’s a closer look:

    Profitability Metrics:

    • Profit Before Tax (PBT): Decreased by 43.11% to ₹95.68 million from ₹168.17 million in Q4 FY24.

    • Tax Expenses: Provided partial relief as tax provision dropped by 40.79% to ₹22.11 million, helping to cushion the impact on the bottom line.

    Analyst’s View: A Mixed Quarter with Challenges Ahead

    Avantel Ltd experienced solid revenue growth in Q4 FY25, but the rise in costs and interest expenses significantly hampered profitability. Key insights from the quarter include:

    Strengths:

    • Strong revenue growth driven by operational progress.
    • Modest increase in full-year net profit.

    Challenges:

    • Increased interest expenses and depreciation charges.
    • Substantial decline in operating profit and PBT, highlighting margin pressures.

    Investor Insight:

    Avantel Ltd’s ability to manage rising costs and interest expenses will be crucial for its future profitability. The company will need to focus on maintaining its revenue growth while optimizing costs and controlling interest expenses to improve profitability in the coming quarters.

    The Bottom Line

    Avantel Ltd’s Q4 FY25 results showcase strong revenue growth but highlight significant profitability challenges, primarily driven by increased operating costs and higher interest expenses. As the company navigates these headwinds, it will need to address cost pressures effectively to sustain its revenue momentum and improve profitability moving forward.

    Disclaimer: This blog is for informational purposes only and should not be considered as financial advice or any buy/sell recommendations.

  • IDFC First Bank Q4 FY25 Results: Revenue Up 14.52%, Net Profit Falls 58.02%

    IDFC First Bank Q4 FY25 Results: Revenue Up 14.52%, Net Profit Falls 58.02%

    IDFC First Bank Ltd has announced its financial results for Q4 FY25, delivering a mixed set of numbers. While the revenue saw healthy growth, the bottom line faced significant pressure due to increased provisions and expenses. Here’s a detailed breakdown of the bank’s quarterly and full-year performance.

    Key Highlights of IDFC First Bank Q4 FY25 Financial Results

    The bank witnessed strong revenue growth in the March 2025 quarter, primarily driven by robust interest earnings and other income. However, profitability took a sharp hit due to rising expenses and provisions.

    Performance Summary:

    • Interest Earned: Rose 14.52% year-on-year to ₹94,129.40 million, compared to ₹82,192.10 million in Q4 FY24.

    • Other Income: Increased by 15.43% to ₹18,954.10 million, reflecting diversification beyond traditional banking income.

    • Interest Expended: Jumped 20.14% to ₹45,057.80 million, indicating higher borrowing and funding costs.

    • Operating Expenses: Increased by 12.23% to ₹49,909.60 million, hinting at expansion activities or administrative cost escalations.

    • Operating Profit: Remained at zero, similar to the previous year’s performance.

    IDFC First Bank Q4 FY25 Financial Statement (₹ in Million)

    Particulars Q4 FY25 (₹ Million) Q4 FY24 (₹ Million) % Change
    Interest Earned 94,129.40 82,192.10 14.52%
    Other Income 18,954.10 16,420.00 15.43%
    Interest Expended 45,057.80 37,503.40 20.14%
    Operating Expenses 49,909.60 49,909.60 12.23%
    Provision & Contingencies 14,504.70 7,223.10 100.81%
    Tax 570.60 2,172.50 -73.74%
    Profit After Tax (PAT) 3,040.80 7,243.50 -58.02%
    Equity 73,221.10 70,699.90 3.57%
    Operating Profit Margin (OPM) 19.25% 20.24% -4.93%

    Profitability Under Pressure

    Despite higher revenues, profitability took a hit due to a surge in provisions:

    • Provisions and Contingencies: Shot up by 100.81% to ₹14,504.70 million.

    • Profit After Tax (PAT): Fell sharply by 58.02% to ₹3,040.80 million, compared to ₹7,243.50 million in Q4 FY24.

    • Operating Profit Margin (OPM): Slightly decreased to 19.25%, down from 20.24% year-on-year.

    Full Year FY25 Financial Overview

    Over the full financial year, the bank continued to show top-line growth but struggled on the profitability front.

    Annual Performance Metrics

    • Total Interest Earned: ₹365,014.90 million, up 20.38% year-on-year.

    • Other Income: ₹70,217.10 million, showing a 16.99% increase.

    • Interest Expended: Rose by 24.06%, outpacing interest earned.

    • Provisions and Contingencies: Soared by 131.55%, indicating a more conservative approach to risk management.

    • Profit After Tax (PAT): Dropped 48.42% to ₹15,248.50 million, compared to ₹29,565.10 million in FY24.

    • Equity Base: Grew marginally by 3.57% to ₹73,221.10 million.

    Analyst’s View: Cautious Optimism Amid Challenges

    IDFC First Bank’s Q4 FY25 results reflect a story of strong top-line momentum clouded by rising costs and cautious provisioning. Here’s a closer analysis:

    Strengths:

    • Solid growth in interest and non-interest income.
    • Stable equity base.

    Challenges:

    • Escalating interest expenses.
    • Higher provisions denting profitability.
    • Drop in operating margins.

    The bank’s proactive provisioning signals a cautious stance in the face of macroeconomic uncertainties, which could bode well for long-term stability.

    Investor Insight:

    Going forward, investors should closely track:

    • Asset quality indicators.
    • Provisioning trends.
    • Efforts to manage rising costs and improve profitability.

    A recovery in profitability will largely depend on the bank’s ability to manage asset quality without letting expenses spiral further.

    Final Thoughts

    IDFC First Bank’s Q4 FY25 results highlight the bank’s revenue strength but also underscore the growing pressure on its profitability. With a conservative approach towards risk management and a stable equity base, the bank appears to be preparing itself for future uncertainties. Investors would do well to stay vigilant on key metrics like provisioning, interest expenses, and asset quality trends in the coming quarters.

    Disclaimer: This blog is for informational purposes only and should not be considered as financial advice or any buy/sell recommendations.